B
RAIN
M
ETABOLISM BUT
N
OT
G
RAY
M
ATTER
V
OLUME
U
NDERLIES THE
P
RESENCE OF
L
ANGUAGE
F
UNCTION IN THE
M
INIMALLY
C
ONSCIOUS
S
TATE
(MCS):
MCS+
V
ERSUS
MCS-
N
EUROIMAGING
D
IFFERENCES
Charlène Aubinet, MSc1,2, Helena Cassol, MSc, PhD1,2, Olivia Gosseries, MSc, PhD1,2, Mohamed Ali
Bahri, MSc, PhD3, Stephen Karl Larroque, MSc1,2, Steve Majerus, MSc, PhD4, Charlotte Martial, MSc,
PhD1,2, Géraldine Martens, MSc1,2, Manon Carrière, MSc1,2, Camille Chatelle, MSc, PhD1,2, Steven
Laureys, MD, PhD1,2*, and Aurore Thibaut, MSc, PhD1,2*
1Coma Science Group, GIGA-Consciousness, University of Liège, Liege, Belgium 2Centre du Cerveau2, University Hospital of Liège, Liege, Belgium
3GIGA-Cyclotron Research Center In Vivo Imaging, University of Liège, Liege, Belgium
4Psychology and Neuroscience of Cognition Research Unit, University of Liège, Liege, Belgium
*Both authors share the last position.
ORCID IDS
Charlène Aubinet https://orcid.org/0000-0001-5095-5583 Géraldine Martens https://orcid.org/0000-0001-7038-7165
CORRESPONDING AUTHOR:
Charlène Aubinet, CHU de Liège, GIGA Research (B34, + 1), Avenue de l’Hôpital 1, Liège, 4000, Belgium. Email: caubinet@uliege.be
Supplementary material for this article is available on the Neurorehabilitation & Neural Repair website along with the online version of this article.
KEYWORDS: minimally conscious state (MCS), language, brain metabolism, brain structure
ABSTRACT
Background. The minimally conscious state (MCS) is subcategorized into MCS- and MCS+, depending on the absence or presence, respectively, of high-level behavioral responses such as command-following. Objective. We aim to investigate the functional and structural neuroanatomy underlying the presence of these responses in MCS- and MCS+ patients. Methods. In this cross-sectional retrospective study, chronic MCS patients were diagnosed using repeated Coma Recovery Scale-Revised assessments. Fluorodeoxyglucose-positron emission tomography data were acquired on 57 patients (16 MCS-; 41 MCS+) and magnetic resonance imaging with
voxel-based morphometry analysis was performed on 66 patients (17 MCS-; 49 MCS+). Brain glucose metabolism and gray matter integrity were compared between patient groups and control groups. A metabolic functional connectivity analysis testing the hypothesis of preserved language network in MCS+ compared with MCS- was also done. Results. Patients in MCS+ presented higher metabolism mainly in the left middle temporal cortex, known to be important for semantic processing, compared with the MCS- group. The left angular gyrus was also functionally disconnected from the left prefrontal cortex in MCS- compared with MCS+ group. No significant differences were found in gray matter volume between patient groups. Conclusions. The clinical subcategorization of MCS is supported by differences in brain metabolism but not in gray matter structure, suggesting that brain function in the language network is the main support for recovery of command-following, intelligible verbalization and/or intentional communication in the MCS. Better characterizing the neural correlates of residual cognitive abilities of MCS patients contributes to reduce their misdiagnosis and to adapt therapeutic approaches.
Introduction
Following a severe brain injury and a period of coma, patients may progress into a minimally conscious state (MCS), recovering inconsistent but reproducible behavioral evidence of awareness.1 This clinical entity is heterogeneous, with behaviors ranging from visual pursuit to the
production of intelligible words. Consequently, a subcategorization has been suggested: the MCS- that mainly describes patients with visual pursuit and/or fixation, oriented movements, and localization to pain,2 3 4 and the MCS + for patients who recover high-level behavioral responses,
such as command-following, intelligible verbalization, and/ or intentional communication.3,4 MCS
patients may emerge from that state once they regain the ability to functionally communicate and/or use objects.5
Communication is one of the most important aspects in the recovery of postcomatose patients because it allows them to interact with their environment and to express their needs. Regaining command-following, intelligible verbalization, and/or intentional communication (ie, MCS + ) appears to be the first step before implementing functional “yes/no” communication codes, and is therefore crucial.5 Furthermore, the issue of aphasia is a major bias that all clinicians face when
diagnosing patients’ level of consciousness, in particular when assessing these “language- related abilities.”6 For instance, the presence of receptive language impairment could prevent conscious
patients from responding to commands. Therefore, neuroimaging studies are capable of providing more accurate diagnoses, bypassing behavioral and language-dependent tests.7
Initially, the clinical sub-categorization of the MCS was supported by differences in brain metabolism as measured by fluorodeoxyglucose-positron emission tomography (FDG-PET) in 27 patients (13 MCS- and 14 MCS + according to the absence or presence of command-following criteria exclusively, and based on at least 1 behavioral assessment).8 Compared with patients in
the MCS- group, those in the MCS+ group showed a higher cerebral metabolism in left-sided cortical areas, including Broca and Wernicke areas, premotor, presupplementary motor, and sensorimotor cortices. Moreover, a disconnection of Broca’s region from the rest of the language network, mesiofrontal, and cerebellar areas was observed in the MCS- group compared with the MCS+ group. Using resting functional magnetic resonance imaging (fMRI) in 19 MCS patients (9 MCS- and 10 MCS + ), we also recently observed an impaired functional connectivity in the left frontoparietal network in the MCS- group compared with the MCS + group.9 Specifically, this
difference between patient groups was significant between the left dorsolateral prefrontal cortex and the left temporo-occipital fusiform cortex, which previously has been linked to semantic abilities.10,11 Finally, a recent case series study showed that the reappearance of
command-following in 3 chronic MCS patients (ie, > 10 months postinjury) was concomitant with the recovery of brain metabolism and gray matter preservation in brain regions that have been associated with self-consciousness (eg, precuneus and thalamus) and language processing (eg, left angular and temporal cortices).12 However, these previous studies used small to very small sample sizes and
mainly focused on brain function aspects (ie, glucose metabolism using FDG-PET, and functional connectivity based on blood oxygen level-dependent signal) rather than brain structure.
Here we aim to investigate the neural correlates of the language-related abilities in a specific population of patients with disorders of consciousness who had recovered these abilities (ie, MCS+) in comparison with another population of MCS patients who had not (ie, MCS-). To do so, we examined the regional and global brain metabolism and the metabolic functional connectivity differences in patients in MCS- versus MCS+ by means of FDG-PET, as well as structural differences between these subcategories by means of gray matter volume atrophy quantification (ie, voxel-based morphometry [VBM]). In line with previous studies, we expect that MCS + patients exhibit higher glucose metabolism and less gray matter atrophy compared with MCS- patients, in particular in consciousness and language-related areas.
Methods
PARTICIPANTS
Behavioral and neuroimaging data were collected during a 1-week hospitalization of patients with disorders of consciousness for diagnostic and prognostic purposes. The PET and MRI acquisitions were performed within 4 days and patients were assessed by a team of experienced clinician-researchers using the Coma Recovery Scale-Revised (CRS-R).4,13
At least 5 CRS-R assessments were performed for each patient (ie, including on the days of neuroimaging assessments) and the best diagnosis of MCS was retained.14 Patients were
categorized as being MCS- (criteria: presence of object localization, visual pursuit and fixation, automatic motor reaction, object manipulation and/or localization to noxious stimulation) or MCS+ (criteria: presence of consistent/reproducible movement to command, including object recognition, intelligible verbalization, and/or intentional communication).1,3,5
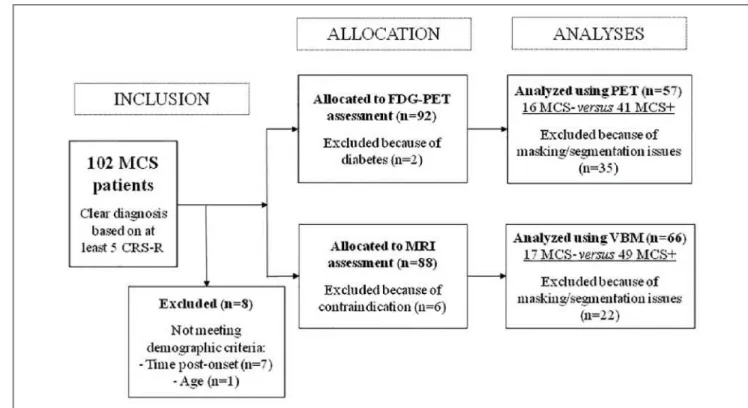
Exclusion criteria were (a) premorbid neurological conditions, (b) time postinjury less than 28 days, (c) age lower than 18 years, (d) diabetes, and (e) MRI contraindication (eg, pacemaker), and masking/segmentation issues (eg, structural brain damage exceeding 25% of the whole brain volume disabling reliable spatial normalization to the standardized stereotaxic brain template) (Figure 1). None of the patients who participated in the previous FDG-PET study of Bruno et al7 was
included in the present research. Nevertheless, 1 patient from our case series12 and 9 patients who
participated in our previous MRI study9 were included in our VBM analyses (10 out of 66 patients).
Healthy control subjects (HCS) were recruited using advertisements posted at the university and none had a history of psychiatric or neurological disease. The control groups were composed of 34 participants (age range 19-70 years, 15 women) for PET imaging and 36 participants (age range 20-75 years, 13 women) for VBM imaging.
The study was approved by the Ethics Committee of the Faculty of Medicine at the University of Liège (No. 2009241). Written informed consent to participate in the study was obtained from all HCS and from the legal surrogates of the MCS patients.
Figure I. Selection of patients according to exclusion criteria. MCS, minimally conscious state; PET, positron emission tomography; MRI, magnetic resonance imaging.
FDG-PET
We acquired FDG-PET data with a Gemini TF CT scanner (Philips Medical Systems). Following intravenous injection of 150 to 300 MBq FDG, we recorded a single PET frame for 12 minutes, after circulation of the tracer for at least 30 minutes. We kept the patients awake during the uptake period. The images were corrected for attenuation using X-ray computed tomography, as well as for random scatter and physical decay. All data were preprocessed as described elsewhere,15
smoothed with an isotropic 14 mm full-width at half-maximum (FWHM) Gaussian kernel and analyzed using Statistical Parametric Mapping 12 (SPM12; Wellcome Department of Cognitive Neurology, London, UK). To partially overcome the issue of brain lesions, the normalization was performed using a customized FDG template as described in a previous study.16 A global
normalization was performed by proportional scaling. We used the FDG-PET standardized uptake values (SUV) to estimate the global cerebral metabolic rate of glucose consumption:
at the single subject level. For regional brain metabolism, the design matrices included the scans of both patient groups and the scans of the HCS. In a first analysis, brain regions with significantly decreased metabolism were identified in MCS- and MCS+ patients compared to HCS (ie, MCS- vs HCS and MCS+ vs HCS). We also investigated the direct comparison between patient groups (ie, MCS- vs MCS + ). In the second analysis, we used a seed-based approach to explore which brain regions’ metabolism correlates with the areas that most differentiate MCS- from MCS +. In this metabolic connectivity analysis, the design matrix included the same data as in the first analysis and tested the group differences in mean levels of glucose consumption. We looked for cortical regions that presented a significant difference in reciprocal modulation with areas found to be more preserved in MCS+ compared with patients in MCS- (ie, MCS- vs MCS+ in the first analysis). Two supplementary analyses were also performed. First, the initial MCS+ sample was reduced to 20 MCS + patients (ie, randomly chosen and matched to the MCS- group for gender, age, etiology, and time postinjury) toensure that the FDG-PET results were not driven by the larger sample size of the MCS +. Moreover, the 7 MCS- patients who had both PET and MRI data were compared with 7 MCS+ patients matched for gender, age, etiology, and time postinjury, using both FDG-PET and VBM analyses.
VBM
Structural MRI data were obtained with T1 -weighted 3D gradient echo sequence (120 slices, repetition time 2.3 seconds, echo time 2.47 ms, voxel size 1 X 1 X 1.2 mm3, flip angle 9°, field of view
256 X 256 mm2). A T1 VBM analysis17 was carried out with VBM8 toolbox (http://www.
neuro.uni-jena.de/vbm/), with nonlinear warping and modulation of the gray matter to ensure the preservation of the volumes after the normalization step, and a DARTEL18 template as previously
described.19 Normalized modulated gray matter data were smoothed with an isotropic Gaussian
kernel of 12 mm FWHM. A full factorial design matrix was constructed, including the scans of both patient groups and the scans of the MRI-specific HCS, with the age of subjects centered to the mean as a regressed covariate. Indeed, gray matter structure was shown to be particularly dependent on age.20
STATISTICAL ANALYSES
We first checked the potential equivalence between patient groups regarding the time postinjury, age and CRS-R total score using Wilcoxon tests, and the gender and etiology (traumatic vs nontraumatic) using chi-square tests. The same statistical analyses were performed to investigate the equivalence of age and gender between the patient groups and their corresponding control group.
Regarding global brain metabolism, Wilcoxon tests were performed to check for SUV differences between patient groups. FDG-PET analyses for regional brain metabolism were based on t tests and identified (a) brain areas showing hypometabolism in patient groups as compared with HCS, (b) brain areas showing significant differences in the direct comparison of both patient groups (MCS- < MCS + ), and (c) brain areas whose glucose consumption significantly correlates with that
of regions emerging in the previous analysis. VBM analyses, also based on t tests, intended to identify (a) brain areas showing gray matter impairment in patient groups as compared with HCS and (b) brain areas showing significant differences by directly comparing both patient groups (MCS- < MCS + ). All FDG-PET and VBM results were thresholded at P < .05 with family-wise error (FWE) correction for whole brain multiple comparisons. Furthermore, to compare with previous studies that used a false discovery rate (FDR) correction,8 results are also given at P < .05 FDR
corrected. FWE correction is more conservative but less sensible (ie, avoid false-positives), whereas FDR correction is more sensible but less specific (ie, avoid false-negatives).21
Results
PARTICIPANTS
Between January 2011 and June 2018, 102 severely brain- injured patients stayed for 1 week in our hospital and were diagnosed MCS as assessed by repeated CRS-R. Following the exclusion criteria (Figure 1), PET analyses focused on 16 MCS- (4 women, age 42 ± 18 years) and 41 MCS+ (19 women, age 39 ± 16 years) patients. VBM analyses were conducted on 17 MCS- (9 women, age 38 ± 14 years) and 49 MCS+ (18 women, age 43 ± 17 years) patients.
As shown in Table 1, 36 patients (7 MCS- and 29 MCS + ) were included in both FDG-PET and VBM analyses. Individual demographic data of patients and their diagnosis criteria of MCS- or MCS+ are also reported in this table. All MCS+ patients exhibited reproducible responses to command in the present research.
Age and time postinjury did not differ between patient groups (Table 2), neither did gender, etiology, and handedness. As expected, CRS-R total scores differed between groups with higher scores for MCS+ patients. Regarding FDG-PET data, there was no significant difference between patients and HCS for age (W = 1069; P = .284) and gender (X2 = 0.037; P = .847). There was also no
significant difference between patients and HCS for the VBM analyses (age: W = 1405; P = .13; gender: x2 = 0.225; P = .635).
FDG-PET ANALYSES
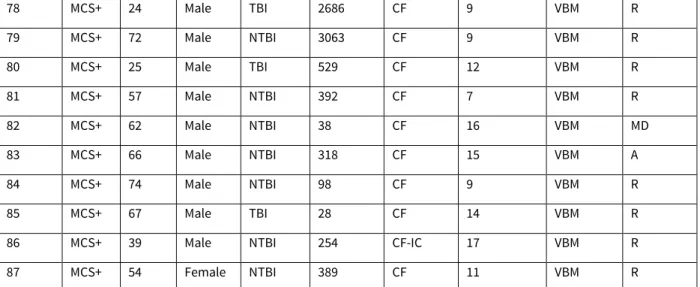
Regarding global brain metabolism, MCS+ patients showed a significantly higher SUV mean (median = 4.51) as compared with MCS- patients (median = 3.47; W = 161, P = .014; see individual data in Supplementary Table 2). Regional brain metabolism results are presented in Figure 2 and Supplementary Table 1.
COMPARISON BETWEEN PATIENT GROUPS AND HEALTHY CONTROL SUBJECTS.
The results are shown in Figure 2A. Individual hypometabolism data are reported in Supplementary Table 2. Compared with HCS, the group of MCS- patients presented an extended hypometabolism in bilateral frontal and temporoparietal areas, including the left angular gyrus
(BA39) and middle temporal gyrus (BA21), as well as left caudate and left thalamus. Compared with HCS, the group of MCS+ patients showed hypometabolism in bilateral frontal lobules including middle frontal gyri (BA10), left anterior cingulate cortex (BA32), and left thalamus.
COMPARISON BETWEEN PATIENT GROUPS.
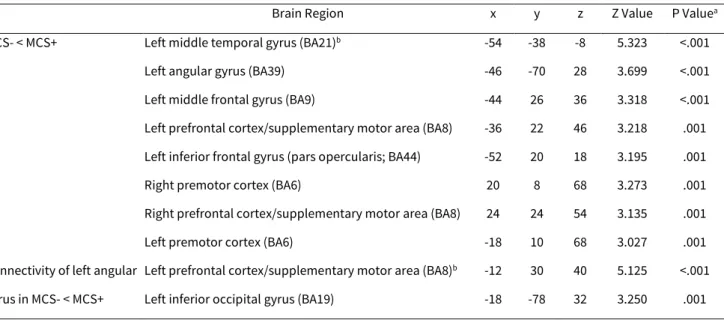
Compared with the group of MCS- patients, MCS+ patients exhibited higher metabolism in the left middle temporal cortex (BA21). The FDR-corrected results also showed higher metabolism in MCS+ patients in the left angular gyrus (BA39), left middle frontal gyrus (BA9), left inferior frontal gyrus (pars opercularis; BA44), bilateral prefrontal cortex/supplementary motor area (BA8), and premotor cortex (BA6), compared with MCS- patients. These results are shown in Figure 2B and Table 3.
The supplementary analysis performed with a smaller sample of MCS+ patients (ie, 16 MCS- vs 20 MCS + ) showed that these patients had higher metabolisms than MCS- patients in the left middle temporal cortex (BA21), left fusiform cortex (BA37), left inferior and middle frontal gyrus (BA44 and BA9), left prefrontal cortex/supplementary motor area (BA8), as well as left inferior frontal gyrus (BA47) (FWE correction). Similar results (notably concerning the left middle temporal cortex) were obtained when comparing 7 MCS- and 7 MCS+ patients, with uncorrected P < .001 (but not using FDR or FWE corrections). These data are presented in the Supplementary Material (see Supplementary Analyses 1 and 2). As the differences between patient groups regarding time postinjury and handedness were close to significant, we also performed supplementary FDG-PET analyses: (a) including time postinjury as covariate (Supplementary Analysis 3) and (b) excluding patients with left-handedness, ambidexterity, or missing handedness data (Supplementary Analysis 4). Both analyses also led to similar results.
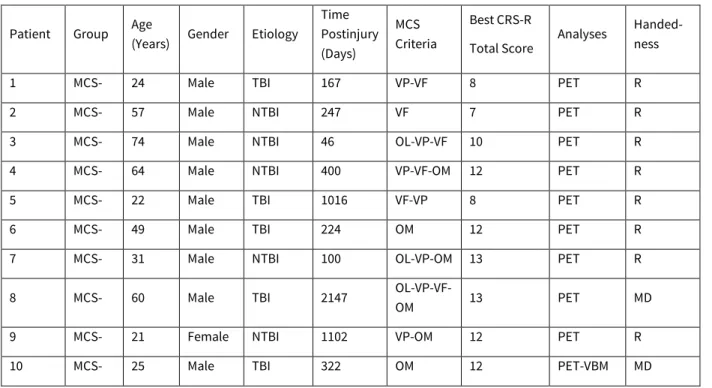
Table I. Individual Demographic Data of Patients.
Patient Group Age
(Years) Gender Etiology
Time Postinjury (Days) MCS Criteria Best CRS-R Total Score Analyses Handed- ness
1 MCS- 24 Male TBI 167 VP-VF 8 PET R
2 MCS- 57 Male NTBI 247 VF 7 PET R
3 MCS- 74 Male NTBI 46 OL-VP-VF 10 PET R
4 MCS- 64 Male NTBI 400 VP-VF-OM 12 PET R
5 MCS- 22 Male TBI 1016 VF-VP 8 PET R
6 MCS- 49 Male TBI 224 OM 12 PET R
7 MCS- 31 Male NTBI 100 OL-VP-OM 13 PET R
8 MCS- 60 Male TBI 2147
OL-VP-VF-OM 13 PET MD
9 MCS- 21 Female NTBI 1102 VP-OM 12 PET R
11 MCS- 28 Male TBI 517 VP-VF 10 PET-VBM R
12 MCS- 49 Female NTBI 467 VF 9 PET-VBM R
13 MCS- 42 Female NTBI 222 VP-VF 8 PET-VBM R
14 MCS- 19 Male TBI 1306 VP-VF 7 PET-VBM R
15 MCS- 46 Female TBI 238 VP-VF 10 PET-VBM R
16 MCS- 54 Male NTBI 159 VP-VF-OM 13 PET-VBM R
17 MCS- 40 Female TBI 1290 VP-VF 11 VBM R
18 MCS- 30 Female TBI 565 VF 12 VBM L
19 MCS- 53 Female NTBI 49 VP 7 VBM R
20 MCS- 30 Male TBI 39 OM 6 VBM R
21 MCS- 26 Female TBI 36 VP-VF-OM 13 VBM MD
22 MCS- 29 Female NTBI 745 VF 5 VBM R
23 MCS- 29 Male TBI 68 VP-VF 5 VBM MD
24 MCS- 52 Male NTBI 1459
OL-VP-VF-OM 13 VBM R
25 MCS- 68 Female NTBI 1379 PL 8 VBM R
26 MCS- 25 Male TBI 333 VP-VF 10 VBM R
27 MCS + 19 Female TBI 485 CF-IC 13 PET R
28 MCS + 62 Female NTBI 714 CF 17 PET R
29 MCS+ 30 Female TBI 565 CF 12 PET L
30 MCS+ 47 Male TBI 529 CF-IC 13 PET R
31 MCS+ 35 Male NTBI 532 CF-IC 20 PET R
32 MCS+ 78 Female TBI 2070 CF-IC 20 PET R
33 MCS+ 50 Female NTBI 273 CF-IC 13 PET R
34 MCS+ 61 Male TBI 131 CF 12 PET L
35 MCS+ 27 Male TBI 220 CF 12 PET A
36 MCS+ 48 Female TBI 287 CF-IC 11 PET MD
37 MCS+ 67 Male NTBI 39 CF-IC-IV 15 PET MD
38 MCS+ 49 Female TBI 477 CF 8 PET R
39 MCS+ 19 Male TBI 428 CF-IC 11 PET-VBM R
40 MCS+ 27 Male TBI 1544 CF 12 PET-VBM R
41 MCS+ 32 Female TBI 557 CF 11 PET-VBM R
42 MCS+ 30 Female NTBI 2407 CF 10 PET-VBM MD
44 MCS+ 50 Male TBI 253 CF 21 PET-VBM R
45 MCS+ 32 Female TBI 573 CF-IC 16 PET-VBM R
46 MCS+ 21 Female NTBI 620 CF-IC 13 PET-VBM R
47 MCS+ 38 Male NTBI 202 CF 11 PET-VBM R
48 MCS+ 26 Female TBI 310 CF 10 PET-VBM R
49 MCS+ 23 Male TBI 1231 CF 13 PET-VBM MD
50 MCS+ 60 Male NTBI 711 CF 13 PET-VBM R
51 MCS+ 30 Female TBI 2729 CF 9 PET-VBM R
52 MCS + 45 Male TBI 4786 CF 11 PET-VBM R
53 MCS+ 21 Female TBI 510 CF 7 PET-VBM L
54 MCS+ 29 Male NTBI 405 CF 17 PET-VBM L
55 MCS+ 25 Male TBI 1153 CF 16 PET-VBM R
56 MCS+ 46 Male NTBI 1379 CF 11 PET-VBM L
57 MCS+ 55 Female TBI 198 CF 18 PET-VBM R
58 MCS+ 35 Male TBI 1327 CF 9 PET-VBM R
59 MCS+ 24 Male TBI 2036 CF-IC 18 PET-VBM R
60 MCS+ 23 Male TBI 641 CF 12 PET-VBM MD
61 MCS+ 42 Female NTBI 266 CF 10 PET-VBM R
62 MCS+ 40 Male TBI 329 CF 16 PET-VBM R
63 MCS + 43 Female NTBI 100 CF 6 PET-VBM R
64 MCS + 22 Male TBI 425 CF 12 PET-VBM L
65 MCS + 69 Male NTBI 312 CF-IC 17 PET-VBM R
66 MCS + 46 Male TBI 648 CF 16 PET-VBM R
67 MCS + 65 Female NTBI 421 CF 12 PET-VBM R
68 MCS+ 67 Female NTBI 284 CF 7 VBM R 69 MCS+ 49 Male TBI 54 CF 14 VBM MD 70 MCS+ 20 Male TBI 389 CF 15 VBM R 71 MCS+ 54 Male TBI 2082 CF 15 VBM R 72 MCS+ 43 Female NTBI 3237 CF 8 VBM R 73 MCS+ 46 Male NTBI 227 CF 9 VBM R 74 MCS+ 57 Male NTBI 254 CF 6 VBM R 75 MCS+ 48 Female NTBI 205 CF 7 VBM L
76 MCS+ 45 Female NTBI 34 CF-IC-IV 19 VBM R
78 MCS+ 24 Male TBI 2686 CF 9 VBM R 79 MCS+ 72 Male NTBI 3063 CF 9 VBM R 80 MCS+ 25 Male TBI 529 CF 12 VBM R 81 MCS+ 57 Male NTBI 392 CF 7 VBM R 82 MCS+ 62 Male NTBI 38 CF 16 VBM MD 83 MCS+ 66 Male NTBI 318 CF 15 VBM A 84 MCS+ 74 Male NTBI 98 CF 9 VBM R 85 MCS+ 67 Male TBI 28 CF 14 VBM R
86 MCS+ 39 Male NTBI 254 CF-IC 17 VBM R
87 MCS+ 54 Female NTBI 389 CF 11 VBM R
Abbreviations: MCS, minimally conscious state; TBI, traumatic brain injury; NTBI, nontraumatic brain injury; VP, visual pursuit; VF, visual fixation; OL, object localization; OM, oriented movements; CF, command-following; IV, intelligible verbalization; PL, pain localization; IC, intentional communication; PET, positron emission tomography; VBM, voxel-based morphometry; R, right; L, left; MD, missing data; A, ambidextrous.
Table 2. Comparison of Patient Groups According to Demographic Data.
PET MCS- (n = 16) MCS+ (n = 41)
Age (years) 41.57 ± 17.57a 39.48 ± 15.77 Wb = 345 P = .772
Time postinjury (days) 542.5 ± 570.64 825.27 ± 901.39 W = 227.5 P = .076 CRS-R total score 10.25 ± 2.21 13.05 ± 3.55 W = 183 P = .01*
Gender 4 females 19 females X2c = 2.178 P = .14
Etiology 8 TBI 27 TBI X2 =1.22 P = .27
Handedness 0 L/14 R (2 MD) 6 L/29 R (6 MD) X2 =2.735 P = .098
VBM MCS- (n = 17) MCS+ (n = 49)
Age (years) 37.9 ± 13.65 42.66 ± 16.81 W = 361 P = .424
Time postinjury (days) 540.76 ± 508.76 859.61 ± 1024.91 W = 356.5 P = .383 CRS-R total score 9.41 ± 2.72 12.22 ± 3.69 W = 242.5 P = .011*
Gender 9 females 18 females X2 = 1.371 P = .242
Etiology 10 TBI 25 TBI X2 = 0.309 P = .579
Handedness 1 L/13 R (3 MD) 5 L/38 R (6 MD) X2 = 0.226+ P = .635
Abbrevitions: MCS, minimally conscious state; PET, positron emission tomography; VBM, voxel-based morphometry; TBI, traumatic brain injury; NTBI, nontraumatic brain injury; L, left-handed; R, right-handed; MD, missing data.
aExpressed as mean ± standard deviation. bWilcoxon rank-sum test.
cChi-square test.
FUNCTIONAL CONNECTIVITY ANALYSIS.
We then focused on the regions that most differentiated MCS+ from MCS- (ie, clusters emerging from the previous first [whole sample] comparison between patient groups), and examined their connectivity in the group of MCS+ patients compared with MCS- patients. Among these seeds, the left angular gyrus (BA39; MNI coordinates: x = -46, y = -60, z = 33) was the only one to show significant results. This region presented higher metabolic functional connectivity in MCS + compared with MCS- with the left prefrontal cortex/supplementary motor area (BA8) using FWE correction (see Figure 2C and Table 3).
INDIVIDUAL RESULTS.
As described in Supplementary Table 2, left frontoparietal hypometabolism was reported in 69% of the MCS- patients (ie, 11/16), while only 24% of the MCS+ patients had such brain metabolism impairment (ie, 10/41).
VBM ANALYSES
The results are presented in Figure 3 and Supplementary Table 3.
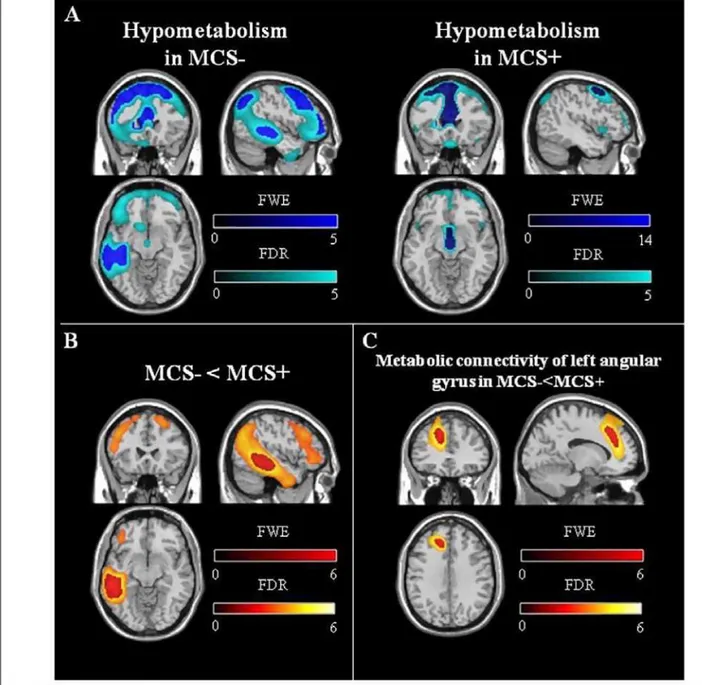
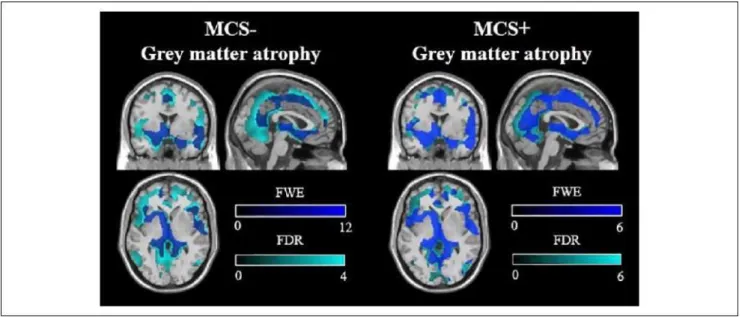
Compared with HCS, the group of MCS- patients exhibited atrophy mainly in the bilateral thalami and angular gyri (BA39), left caudate and insula, left primary sensory area, right orbitofrontal cortex (BA11), right fusiform (BA37), and occipital cortex (BA18). Compared with HCS, the group of MCS+ patients showed atrophy in the bilateral thalami, left caudate, right orbitofrontal cortex (BA11), left insula, left prefrontal cortex (BA8), right orbitofrontal cortex (BA11), right fusiform (BA37), and occipital cortex (BA18). There was no significant difference in gray matter volume between the groups of patients in MCS- and MCS +.
The supplementary analysis of 7 MCS- and 7 matched MCS+ patients did not lead to significant differences in gray matter volume, neither at a threshold for the P value of .001 uncorrected, as it was in the whole sample.
Discussion
In this study, we aimed to investigate brain function and structure underpinning the recovery of language-related abilities in MCS patients using FDG-PET and VBM techniques by comparing patients with (ie, MCS + ) and without (ie, MCS-) such behaviors. To our knowledge, this is the first study that examines brain metabolism and gray matter atrophy in the 2 groups of MCS patients (MCS- and MCS + ). Our main findings show metabolic differences in the left-sided language network sustaining the clinical subcategorization of the MCS, while no gray matter volume differences were found.
Figure 2. Brain metabolism results using positron emission tomography. (A) Comparison of glucose uptake between patients in MCS- and healthy subjects, and between patients in MCS+ and healthy subjects. (B) Comparison of glucose uptake between patients in MCS- and MCS + groups. (C) Comparison of metabolic connectivity of the left angular gyrus between patients in MCS- and MCS+ groups. All color scales correspond to the t-test value. MCS, minimally conscious state; FWE, family-wise error; FDR, false discovery rate.
As expected, both patient groups showed decreased cerebral metabolism and structural damage compared to healthy subjects. As in previous studies, we observed an alteration of brain function, in particular in the frontoparietal network (eg, Crone et al22 and Aubinet et al23). Moreover, our
structural analyses show a significant atrophy for both patient groups in subcortical structures such as the thalamus, which was also previously found to be damaged in MCS patients.24,25
In comparison with the group of MCS- patients, MCS + patients presented higher metabolism preservation in different language-related areas. Using a more conservative correction (ie, FWE), higher metabolism was identified in MCS+ compared with MCS- in the left middle temporal cortex, which has been associated to selective processing of speech,26,27 semantic processing,28,29 and word
generation.30 The FDR correction analysis also highlighted other language-related brain regions:
the left angular gyrus,31-33 the left middle frontal gyrus,34-38 the left inferior frontal gyrus (pars
opercularis),39-41 the prefrontal and premotor cortex as well as supplementary motor area,42 which
are also involved in various motor functions.43 These results are in line with previous research
showing that the left middle temporal cortex and left angular gyrus could differentiate MCS subcategories at the subject level,12 and that a preserved metabolism in these regions was
associated with residual language comprehension in 3 postcoma patients.23 The involvement of
motor regions is also not surprising since command-following, the most frequent MCS+ criteria to be observed (see Table 1), requires both language comprehension and motor execution. Note that the difference in sample size cannot be considered as a confounding factor since we obtained similar results using smaller samples of MCS+ patients (Supplementary Analyses 1 and 2).
Altogether, these findings corroborate previous results reported in the study of Bruno et al8 on a
larger sample size (n = 57). In addition, more stringent diagnostic criteria were used following the recent recommendation (ie, minimum of 5 CRS-R assessments needed before any diagnosis)14 and
therefore are likely to be more accurate than in the Bruno et al study. Finally, in the present study PET analyses were performed using the computed tomography (CT) of each individual patient, which allows a more precise image reconstruction than when the standard ellipse is used.16
Moreover, the functional connectivity analysis showed a disconnection between the left angular gyrus and the left prefrontal cortex/supplementary motor area in MCS- as compared with MCS+ (FWE correction), which could reflect a deficit in language integration in MCS- patients. Indeed, several studies have shown a reduced functional connectivity of the left frontoparietal network in aphasic poststroke patients, which subsequently increased when patients recovered language comprehension.44,45 Additionally, when looking at patients’ individual FDG-PET reports, left
frontoparietal hypometabolism was reported in 69% of the MCS- patients against 24% of the MCS+ patients, showing the overall difference between the 2 subgroups. However, it also means that our results are not systematically observable at the subject level.
The main novelty of this study is to combine functional and structural analyses in MCS- and MCS+ patients at group level in a representative sample. While functional measurements provide an accurate picture of the functioning brain areas and networks, structural data give information on the location of tissue’s damage.46 We did not find any gray matter volume difference between MCS-
and MCS +. These results suggest that brain function (rather than gray matter structure) is determinant for the presence of clinical signs of language processes in the MCS. The extent and severity of structural lesions are also not predictive of a good outcome as was shown recently.47
Gray matter structure as measured with T1, however, was found to discriminate levels of consciousness (ie, unresponsive wakefulness syndrome vs MCS) with a sensitivity of 0.92.25
Our results are clinically relevant as they contribute to the diagnosis of postcomatose patients by better characterizing their residual brain function. In line with previous multimodal studies,7 brain
metabolism seems to be the most accurate marker for the differential diagnosis of MCS- and MCS +. A preservation of glucose metabolism in the left frontoparietal network may consequently suggest the presence of a cognitive-motor dissociation48,49 in patients who do not follow command
at bedside. The efforts to seek voluntary responses should consequently be intensified in these patients by repeating the behavioral assessments or using brain-computer interfaces.50 Similarly,
speech therapists should endeavor to obtain any sign of residual language in those patients, by using various language assessments (eg, Coleman et al51 and Owen and Coleman52). Noninvasive
brain stimulation further represents an emerging approach for patients with disorders of consciousness.53,54 Techniques such as transcranial direct current stimulation could be applied on
top of the cortical representation of the left angular gyrus in MCS- patients. Indeed, applying such stimulation over a functionally impaired area could potentially induce an increase in brain metabolism and lead to an improvement of language-related behaviors. However, this hypothesis should be tested prospectively, including neuroimaging evaluations of patients’ individual structural and metabolic impairment. PET data could thus guide clinicians to target specific brain regions for non-invasive brain stimulation technique. Overall, the present study could be of great help to identify patients with cognitive abilities missed at the bedside, which should improve their rehabilitation care by choosing the most suitable therapeutic strategies.
One may ask if MCS- and MCS+ subcategories represent different states of consciousness per se or rather distinct cognitive profiles. The first hypothesis would be sustained by global brain metabolism results, which are significantly lower in MCS- patients compared with MCS+ patients. Such global glucose metabolism was previously shown to correlate with patients’ level of con- sciousness.46 Nevertheless, the second hypothesis is supported by other data. Indeed, whereas the
language network distinguishes both MCS subcategories, we found no differences in regional brain function regarding specific areas considered to be associated with various aspects of consciousness (eg, default mode network including thalamus and precuneus),15,55 in line with our
previous research using functional MRI.9
It has been proposed that MCS- patients show a preservation of neural networks associated with a feeling of pain56,57 or with internal self-awareness.8,9 However, these patients fail to understand
commands, establish a communication code or intelligibly verbalize due to a severe impairment of language function. Analogously, MCS+ patients should not be considered as “more conscious” than MCS- patients. These hypotheses raise theoretical questions about the categorization of disorders of consciousness, which could be considered as global brain dysfunctions or as a sum of focal dysfunctions (ie, including language impairment).58 Further studies are needed to address
these concerns and develop new strategies allowing disentanglement of language and consciousness impairments in this population. For example, new bedside behavioral assessments of residual language abilities could be developed. Research looking at the difference in prognosis between these 2 categories of patients could also unveil whether language function recovery is a marker of good outcome. In this regard, we hypothesize that MCS+ patients may have a better outcome than MCS- patients given their abilities to interact with their environment and because of
smaller neurophysiological impairment as exposed in the present study. Note that it has recently been shown that MCS- patients have a higher degree of disability at discharged from rehabilitation compared with MCS+ patients. However, longterm outcome differences between these 2 subcategories of patients need to be investigated, which could have a significant clinical impact. Our work is not without limitations since it is a cross-sectional retrospective study. The use of neuroimaging also requires technical settings and expertise, and consequently could be difficult to implement in current rehabilitation processes. Moreover, the fact that we did not find gray matter volume differences between both patient groups does not mean that such differences do not exist. Still a recent study using diffusion tensor imaging demonstrated a reduced connectivity of premotor and left temporal cortices with the thalamus in MCS- compared with MCS+ patients.58
White matter differences between groups of MCS- and MCS + should further be investigated. As stated above, outcome measurements were also not included. Finally, we found a metabolic disconnection within the left frontoparietal network in MCS- compared with MCS + , and further studies should bring evidence on the causality of this disconnection (ie, missing top-down/bottom-up and feedforward/feed- back connections).
Table 3. Brain Glucose Metabolism Results.
Brain Region x y z Z Value P Valuea
MCS- < MCS+ Left middle temporal gyrus (BA21)b -54 -38 -8 5.323 <.001
Left angular gyrus (BA39) -46 -70 28 3.699 <.001 Left middle frontal gyrus (BA9) -44 26 36 3.318 <.001 Left prefrontal cortex/supplementary motor area (BA8) -36 22 46 3.218 .001 Left inferior frontal gyrus (pars opercularis; BA44) -52 20 18 3.195 .001
Right premotor cortex (BA6) 20 8 68 3.273 .001
Right prefrontal cortex/supplementary motor area (BA8) 24 24 54 3.135 .001
Left premotor cortex (BA6) -18 10 68 3.027 .001
Connectivity of left angular Left prefrontal cortex/supplementary motor area (BA8)b -12 30 40 5.125 <.001
gyrus in MCS- < MCS+ Left inferior occipital gyrus (BA19) -18 -78 32 3.250 .001 Abbreviations: MCS, minimally conscious state; BA, Brodmann area.
aFalse discovery rate corrected.
Figure 3. Brain structure results using voxel-based morphometry. Comparison of gray matter structure volume between patients in MCS- and healthy subjects and between patients in MCS+ and healthy subjects. The color scales correspond to the t-test value. MCS, minimally conscious state; FWE, family-wise error; FDR, false discovery rate.
Conclusions
In the present study, we aimed to investigate the metabolic activity and functional connectivity needed for residual language abilities in postcomatose patients by means of FDG-PET, as well as possible structural differences between MCS- and MCS+ using VBM. We found metabolic differences sustaining the clinical subcategorization of MCS. Indeed, MCS+ patients showed preserved glucose metabolism in left-sided language-related areas such as the left middle temporal gyrus, compared with MCS- patients, as well as preserved connectivity in the left frontoparietal network. No gray matter volume differences were identified between MCS- patients and MCS + patients, suggesting that brain metabolism, more than structural damage, is determinant for the recovery of language-related abilities in the MCS. Our results are of clinical relevance since they contribute to reduce the misdiagnosis of MCS patients and consequently establish better therapeutic strategies.
ACKNOWLEDGMENTS
We thank Dr Z. Hampel-Arias, Dr J.-F.L. Tshibanda, Pr R. Hustinx, C. Bernard, and the entire teams from the Neurology, Radiodiagnostic, and Nuclear Medicine Departments of the University Hospital of Liege, as well as patients and their families.
AUTHOR CONTRIBUTIONS
C.A., S.L., and A.T. conceived and planned the presented research. C.A., A.T., H.C., C.C., C.M., G.M., O.G., and M.C. contributed to clinical and neuroimaging data acquirement. C.A., A.T., H.C.,
S.K.L., M.A.B., S.M., O.G., C.C., and S.L. worked on data analyses and interpretation. C.A. drafted the manuscript under A.T.’s supervision and all authors provided critical feedback and helped shape the manuscript.
DECLARATION OF CONFLICTING INTERESTS
The authors declared no potential conflicts of interest with respect to the research, authorship, and/or publication of this article.
FUNDING
The authors disclosed receipt of the following financial support for the research, authorship, and/or publication of this article: The study was supported by the University and University Hospital of Liège, the French Speaking Community Concerted Research Action (ARC 12-17/01), the Belgian National Funds for Scientific Research (FRS-FNRS), the Marie Sklodowska-Curie Actions (H2020- MSCA-IF-2016-ADOC-752686), the European Union’s Horizon 2020 Framework Program for Research and Innovation under the Specific Grant Agreement No. 785907 (Human Brain Project SGA2), the Luminous project (EU-H2020-fetopen-ga686764), the James McDonnell Foundation, Mind Science Foundation, IAP research network P7/06 of the Belgian Government (Belgian Science Policy), the European Commission, the Public Utility Foundation “Université Européenne du Travail,” “Fondazione Europea di Ricerca Biomedica,” the Bial Foundation, and the Belgian Cancer Foundation (2017-064). CA and SKL are research fellows, AT is post-doctoral research fellow and SL is research director at F.R.S-FNRS.
References
1. Giacino JT, Ashwal S, Childs N, et al. The minimally conscious state: definition and diagnostic criteria. Neurology. 2002;58:349-353.
2. Wannez S, Gosseries O, Azzolini D, et al. Prevalence of Coma-Recovery Scale-revised signs of consciousness in patients in minimally conscious state. Neuropsychol Rehabil. 2018;28:1350-1359.
3. Bruno MA, Vanhaudenhuyse A, Thibaut A, Moonen G, Laureys S. From unresponsive wakefulness to minimally conscious PLUS and functional locked-in syndromes: recent advances in our understanding of disorders of consciousness. J Neurol. 2011;258:1373-1384.
4. Thibaut A, Bodien YG, Laureys S, Giacino JT, et al. Minimally conscious state “ plus ”: diagnostic criteria and relation to functional recovery. Epub ahead of print 26 November 2019. [published online November 26, 2019]. J Neurol. doi:10.1007/s00415-019-09628-y
5. Giacino JT, Kalmar K, Whyte J. The JFK Coma Recovery Scale-revised: measurement characteristics and diagnostic utility. Arch Phys MedRehabil. 2004;85:2020-2029.
6. Schnakers C, Bessou H, Rubi-Fessen I, et al. Impact of aphasia on consciousness assessment: a cross-sectional study. Neurorehabil Neural Repair. 2015;29:41-47.
7. Stender J, Gosseries O, Bruno MA, et al. Diagnostic precision of PET imaging and functional MRI in disorders of consciousness: a clinical validation study. Lancet. 2014;384:514-522.
8. Bruno MA, Majerus S, Boly M, et al. Functional neuroanatomy underlying the clinical subcategorization of minimally conscious state patients. J Neurol. 2012;259:1087-1098.
9. Aubinet C, Larroque SK, Heine L, et al. Clinical subcategorization of minimally conscious state according to resting functional connectivity. Hum Brain Mapp. 2018;39:4519-4532.
10. Ardila A, Bernal B, Rosselli M. How extended is Wernicke’s area? Meta-analytic connectivity study of BA20 and integrative proposal. Neurosci J. 2016;2016:4962562.
11. Vigneau M, Beaucousin V, Hervé PY, et al. Meta-analyzing left hemisphere language areas: Phonology, semantics, and sentence processing. Neuroimage. 2006;30:1414-1432.
12. Aubinet C, Panda R, Larroque SK, et al. Reappearance of command-following is associated with the recovery of language and internal-awareness networks: a longitudinal multiple-case report. 2019;13:8. 13. Schnakers C, Majerus S, Giacino J, et al. A French validation study of the Coma Recovery Scale-Revised (CRS-R). Brain Inj. 2008;22:786-792.
14. Wannez S, Heine L, Thonnard M, Gosseries O, Laureys S; Coma Science Group Collaborators. The repetition of behavioral assessments in diagnosis of disorders of consciousness. Ann Neurol. 2017;81:883-889.
15. Thibaut A, Bruno MA, Chatelle C, et al. Metabolic activity in external and internal awareness networks in severely braindamaged patients. JRehabilMed. 2012;44:487-494.
16. Phillips CL, Bruno MA, Maquet P, et al. “Relevance vector machine” consciousness classifier applied to cerebral metabolism of vegetative and locked-in patients. Neuroimage. 2011;56:797-808.
17. Ashburner J, Friston KJ. Voxel-based morphometry—the methods. Neuroimage. 2000;11(6 pt 1):805-821.
18. Ashburner J. A fast diffeomorphic image registration algorithm. Neuroimage. 2007;38:95-113.
19. Di Perri C, Bahri MA, Amico E, et al. Neural correlates of consciousness in patients who have emerged from a minimally conscious state: a cross-sectional multimodal imaging study. Lancet Neurol. 2016;15:830-842.
20. Minkova L, Habich A, Peter J, Kaller CP, Eickhoff SB, Kloppel S. Gray matter asymmetries in aging and neurodegeneration: a review and meta-analysis. Hum Brain Mapp. 2017;38:5890-5904.
21. Chumbley J, Worsley K, Flandin G, Friston K. Topological FDR for neuroimaging. Neuroimage. 2010;49:3057-3064.
22. Crone JS, Soddu A, Holler Y, et al. Altered network properties of the fronto-parietal network and the thalamus in impaired consciousness. Neuroimage Clin. 2014;4:240-248.
23. Aubinet C, Murphy L, Bahri MA, et al. Brain, behavior, and cognitive interplay in disorders of consciousness: a multiple case study. Front Neurol. 2018;9:665.
24. Morozova S, Kremneva E, Sergeev D, et al. Conventional structural magnetic resonance imaging in differentiating chronic disorders of consciousness. Brain Sci. 2018;8:E144.
25. Annen J, Frasso G, Crone JS, et al; Coma Science Group Collaborators. Regional brain volumetry and brain function in severely brain-injured patients. Ann Neurol. 2018;83: 842-853.
26. Giraud AL, Kell C, Thierfelder C, et al. Contributions of sensory input, auditory search and verbal comprehension to cortical activity during speech processing. Cereb Cortex. 2004;14:247-255.
27. Vorobyev VA, Alho K, Medvedev SV, et al. Linguistic processing in visual and modality-nonspecific brain areas: PET recordings during selective attention. Brain Res Cogn Brain Res. 2004;20:309-322.
28. McDermott KB, Petersen SE, Watson JM, Ojemann JG. A procedure for identifying regions preferentially activated by attention to semantic and phonological relations using functional magnetic resonance imaging. Neuropsychologia. 2003;41:293-303.
29. Chou TL, Booth JR, Bitan T, et al. Developmental and skill effects on the neural correlates of semantic processing to visually presented words. Hum Brain Mapp. 2006;27:915-924.
30. Friedman L, Kenny JT, Wise AL, et al. Brain activation during silent word generation evaluated with functional MRI. Brain Lang. 1998;64:231-256.
31. Humphries C, Binder JR, Medler DA, Liebenthal E. Time course of semantic processes during sentence comprehension: an fMRI study. Neuroimage. 2007;36:924-932.
32. Dronkers NF, Wilkins DP, Van Valin RD Jr, Redfern BB, Jaeger JJ. Lesion analysis of the brain areas involved in language comprehension. Cognition. 2004;92:145-177.
33. Binder JR, Desai RH, Graves WW, Conant LL. Where is the semantic system? A critical review and meta-analysis of 120 functional neuroimaging studies. Cereb Cortex. 2009;19:2767-2796.
34. Slotnick SD, Moo LR. Prefrontal cortex hemispheric specialization for categorical and coordinate visual spatial memory. Neuropsychologia. 2006;44:1560-1568.
35. Zhang JX, Leung HC, Johnson MK. Frontal activations associated with accessing and evaluating information in working memory: an fMRI study. Neuroimage. 2003;20:1531-1539.
36. Ranganath C, Johnson MK, D’Esposito M. Prefrontal activity associated with working memory and episodic long-term memory. Neuropsychologia. 2003;41:378-389.
37. Hugdahl K, Lundervold A, Ersland L, et al. Left frontal activation during a semantic categorization task: an fMRI-study. Int JNeurosci. 1999;99:49-58.
38. Desmond JE, Gabrieli JDE, Glover GH. Dissociation of frontal and cerebellar activity in a cognitive task: evidence for a distinction between selection and search. Neuroimage. 1998;7(4 pt 1):368-376.
39. Anderlini D, Wallis G, Marinovic W. Language as a predictor ofmotor recovery: the case for a more global approach to stroke rehabilitation. Neurorehabil Neural Repair. 2019;33:167-178.
40. Grossman M, Cooke A, DeVita C, et al. Sentence processing strategies in healthy seniors with poor comprehension: an fMRI study. Brain Lang. 2002;80:296-313.
41. Heim S, Eickhoff SB, Amunts K. Specialisation in Broca’s region for semantic, phonological, and syntactic fluency? Neuroimage. 2008;40:1362-1368.
42. Fox PT, Ingham RJ, Ingham JC, Zamarripa F, Xiong JH, Lancaster JL. Brain correlates of stuttering and syllable production. A PET performance-correlation analysis. Brain. 2000;123(1 pt 10):1985-2004.
43. Matsumura M, Sadato N, Kochiyama T, et al. Role of the cerebellum in implicit motor skill learning: a PET study. Brain Res Bull. 2004;63:471-483.
44. Zhu D, Chang J, Freeman S, et al. Changes of functional connectivity in the left frontoparietal network following aphasic stroke. Front Behav Neurosci. 2014;8:167.
45. Sharp DJ, Turkheimer FE, Bose SK, Scott SK, Wise RJ. Increased frontoparietal integration after stroke and cognitive recovery. Ann Neurol. 2010;68:753-756.
46. Stender J, Kupers R, Rodell A, et al. Quantitative rates of brain glucose metabolism distinguish minimally conscious from vegetative state patients. J Cereb Blood Flow Metab. 2015;35:58-65.
47. Brown AW, Pretz CR, Bell KR, et al. Predictive utility of an adapted Marshall head CT classification scheme after traumatic brain injury. Brain Inj. 2019;33:610-617.
48. Edlow BL, Chatelle C, Spencer CA, et al. Early detection of consciousness in patients with acute severe traumatic brain injury. Brain. 2017;140:2399-2414.
49. Schiff ND. Cognitive motor dissociation following severe brain injuries. JAMA Neurol. 2015;72:1413-1415.
50. Annen J, Blandiaux S, Lejeune N, et al. BCI performance and brain metabolism profile in severely brain-injured patients without response to command at bedside. FrontNeurosci. 2018;12:370.
51. Coleman MR, Rodd JM, Davis MH, et al. Do vegetative patients retain aspects of language comprehension? Evidence from fMRI. Brain. 2007;130(pt 10):2494-2507.
52. Owen AM, Coleman MR. Functional neuroimaging of the vegetative state. Nat Rev Neurosci. 2008;9:235-243.
53. Thibaut A, Schiff N, Giacino J, Laureys S, Gosseries O. Therapeutic interventions in patients with prolonged disorders of consciousness. Lancet Neurol. 2019;18:600-614.
54. Thibaut A, Chennu S, Chatelle C, et al. Theta network centrality correlates with tDCS response in disorders of consciousness. Brain Stimul. 2018;11:1407-1409.
55. Demertzi A, Soddu A, Laureys S. Consciousness supporting networks. Curr Opin Neurobiol. 2013;23:239-244.
56. Chatelle C, Hauger SL, Martial C, et al. Assessment of nociception and pain in participants in an unresponsive or minimally conscious state after acquired brain injury: the relation between the Coma Recovery Scale-Revised and the Nociception Coma Scale-Revised. Arch Phys Med Rehabil. 2018;99:1755-1762.
57. Chatelle C, Thibaut A, Bruno MA, et al. Nociception Coma Scale-Revised scores correlate with metabolism in the anterior cingulate cortex. Neurorehabil Neural Repair. 2014;28: 149-152.
58. Pistoia F, Sarà M, Sacco S, Carolei A. Vegetative states and minimally conscious states revisited: a Russian doll approach. Brain Inj. 2013;27:1330-1331.
59. Zheng ZS, Reggente N, Lutkenhoff E, Owen AM, Monti MM. Disentangling disorders of consciousness: insights from diffusion tensor imaging and machine learning. Hum Brain Mapp. 2017;38:431-443.