Vincent Uyttendaele*, **, Jennifer L. Knopp**, Marc Pirotte***, Philippe Morimont***, Bernard Lambermont***, Geoffrey M. Shaw****, Thomas Desaive*, and J. Geoffrey Chase**
* GIGA – In silico Medicine, University of Liège, Belgium
(email: [email protected], [email protected]) **Department of Mechanical Engineering, University of Canterbury, Christchurch, New Zealand
*** Department of Medical Intensive Care, University Hospital of Liège, Belgium **** Department of Intensive Care, Christchurch Hospital, New Zealand
Abstract: Glycaemic control (GC) in the intensive care unit (ICU) has been widely debated over the last
20 years. While many studies showed benefits, many others failed to replicate the results, blaming the increased related risk of hypoglycaemia. Current ICU guidelines thus often suggest higher glycaemic target ranges, led by the fear of hypoglycaemia – permissive hyperglycaemia. However, recent studies have shown improved safety and performance in GC outcome, using model-based computerised methods. The Stochastic-Targeted (STAR) framework is a patient-specific risk-based dosing protocol modulating insulin and nutrition. This study presents recent intermediate results of the STAR-Liège clinical trial, targeting 4.4-8.0 mmol/L glycaemic band. Clinical data from patients controlled under STAR and STAR insulin only (STAR-IO) are compared to retrospective data under the standard protocol (SP), targeting higher 5.6-8.3 mmol/L glycaemic ranges.
Overall, STAR performance was significantly higher (88% blood glucose measurements in the 4.4-8.0 mmol/L or 80-145 mg/dL target band) compared to STAR-IO (78%) and SP (55%). Incidence of hypoglycaemia was similar (1% below target), while hyperglycaemia was much higher for SP (31% above target) compared to STAR (9%) and STAR-IO (11%). The resulting lower median blood glucose (BG) levels in STAR (6.5 mmol/L), compared to STAR-IO (6.7 mmol/L) and SP (7.7 mmol/L), was achieved with less variability, but required higher clinical workload for STAR (12 measurements per day) compared to SP (7 measurements per day). Compliance to protocol was higher for STAR (98%) compared to STAR-IO (90%) and SP (79%).
Although targeting lower glycaemic ranges, STAR provided better GC compared to the SP. Typically, the full version of STAR also modulating nutrition, was able to better control extremely insulin resistant patients, further improving glycaemic control results. The results of this clinical trial indicate the capability to provide the safe, effective control for all patients required to improve outcomes.
Keywords: Glycaemic control, Hyperglycaemia, Hypoglycaemia, Insulin, Insulin therapy
1. INTRODUCTION
Stress-induced hyperglycaemia is a common complication in critically ill patients resulting from stress and inflammatory metabolic response to injury (McCowen et al., 2001), and is associated with increased morbidity and mortality (Krinsley, 2003). Glycaemic control (GC) for these patients has been associated with improved outcomes (Chase et al., 2010a; Krinsley, 2004; Reed et al., 2007; Van den Berghe et al., 2001). However, the associated increased risk of hypoglycaemia (Brunkhorst et al., 2008; Finfer et al., 2009; Finfer et al., 2012; Preiser et al., 2009) has been the heart of a debate on what appropriate glycaemic target band to choose in intensive care units (ICUs) (Gunst et al., 2016; Krinsley, 2018; Preiser et al., 2016a; Preiser et al., 2016b). To date, guidelines often suggest a higher target band due to fear of harm (Krinsley, 2018; Singer et al., 2019), hypoglycaemia
being potentially more harmful than the potential benefit (Penning et al., 2014a; Penning et al., 2015).
However, these recommendations are often based studies failing to achieve safe and effective control for all patients. Most importantly, recent analyses suggest increased hypoglycaemia could mainly be due to protocol compliance and protocol design rather than GC itself (Uyttendaele et al., 2019b). Additionally, another study shows glycaemic outcomes and mortality is a function of the quality of control achieved and not patient condition (Uyttendaele et al., 2017). These results overall suggest safe, effective control for all must be achieved for all patients before potentially assessing its impact on clinical outcomes (Chase et al., 2017).
The STAR (Stochastic Targeted) GC framework is a personalised risk-based dosing approach (Evans et al., 2012; Fisk et al., 2012). It uses a validated physiological model and
stochastic predictions to evaluate the risk of hypo- and hyper- glycaemia for any given treatment (Lin et al., 2008; Lin et
al., 2011). STAR has shown positive results in New Zealand
and Hungary, providing safe control for nearly all patients (Stewart et al., 2016). While STAR is not the only successful model-based protocol (Chase et al., 2008; Mesotten et al., 2017; Van Herpe et al., 2013), it is the only controller also modulating nutrition for increased quality of control, while optimising carbohydrate intake.
This study presents intermediate results of the STAR-Liège clinical trial, currently ongoing at the University Hospital of Liège, Belgium. STAR-Liège aims to assess safety and performance of STAR in a general ICU environment, and compare results to local standards. This trial includes patients on a STAR Insulin-Only version (STAR-IO), leaving nutrition at clinician discretion, or on full STAR modulating both insulin and nutrition inputs. This study thus also analyses the impact of modulating nutrition on glycaemic control outcomes, in the context of a proven GC framework.
2. METHODS
2.1 STAR-Liège protocol (STAR & STAR-IO)
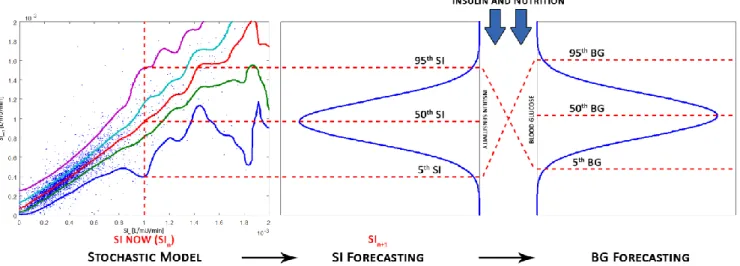
STAR is a model-based GC framework developed in Christchurch, New Zealand (Evans, et al., 2012). It uses a clinically validated physiological model to identify insulin sensitivity (SI) from clinical data (Chase et al., 2010b; McAuley et al., 2011). This parameter represents patient-specific response to insulin, and is identified from clinical data, using integral based methods (Docherty et al., 2012). A stochastic model is then used to evaluate future potential metabolic variability (Davidson et al., 2019; Davidson et al., 2020; Lin et al., 2006; Lin, et al., 2008; Uyttendaele et al., 2018a; Uyttendaele et al., 2019a). This probabilistic model forecasts the 90% likelihood range of future SI. STAR can thus evaluate the corresponding 90% confidence interval (CI) of likely future BG for any specific insulin and nutrition intervention.
STAR computes recommendations based on predicted risks, by determining what combination results in the 90% CI of predicted BG best overlapping the clinically specified target band (Fig. 1). This approach minimises to 5% the risk of being below the lower limit of the target band. This risk-based dosing approach is unique in GC, and extensively explained in the literature (Evans, et al., 2012). STAR always maximizes safety first, and suggests 1-3 hourly blood glucose (BG) measurements. Overall, STAR accounts for inter- and intra- patient variability, offering a unique risk-based dosing approach and modulating both insulin and nutrition inputs. STAR is fully computerised and used on Android Operating System Tablets. STAR easily adjusts to local ICU practises and has shown encouraging results in different ICUs across different countries. Nurses enter BG, insulin, and nutrition data directly in the tablet. STAR then operates using the patient data to compute the new treatment. The University Hospital of Liège Ethics Committee approved this trial (#B707201733994) and the use of this data.
STAR-Liège is started if two consecutive BG measurements > 8.0 mmol/L (145 mg/dL). The target band is 4.4-8.0 mmol/L (80-145 mg/dL). Insulin is continuously administered through intra-venous catheter. The maximum insulin rate is 9U/h. Increments of maximum 2U/h are allowed between successive interventions. Nutrition, in the full STAR version, can be temporarily decreased down to a minimum of 30% of the original clinically set 100% goal feed (GF). Typically, nutrition is reduced if insulin alone is not sufficient to decrease persistent elevated BG levels. Nutrition can only be reduced by a maximum 30% between consecutive measurements. In STAR-IO, nutrition is left at clinician discretion. In the case of hypoglycaemia, a dextrose bolus (20ml of 30% glucose) is administered intravenously while insulin is stopped, and a new BG measurement will be needed within one hour.
STAR stopping criteria are BG levels stable (in target band) for 6 hours at low insulin rates (≤2U/h), or after 72 hours of control. BG measurements are taken using a blood gas analyser. This clinical trial aims to include 20 patients in each arm.
Fig. 1. STAR uses stochastic models to forecast change in SI based on current SI value, and determines BG outcomes for
2.2 Local Standard Protocol (SP)
Clinical trial results are compared to retrospective data from the local standard GC protocol (SP). SP is a table-based protocol targeting 5.6-8.3 mmol/L (100-150mg/dL). BG measurements are typically taken 4-hourly when 5.6 mmol/L < BG < 10.0 mmol/L (100 mg/dL < BG < 180 mg/dL), 1-hourly otherwise. There is no specified maximum insulin infusion rate. Starting criteria is BG > 10.0 mmol/L (180 mg/dL). BG measurements are made using glucometers or blood gas analyser. In the case of nutrition stoppage, insulin is automatically stopped. Insulin administration is stopped only when BG is below 3.3 mmol/L (60 mg/dL), and a 20ml of 30% glucose bolus is administered for severe hypoglycaemia (BG < 2.2 mmol/L).
2.3 Protocol comparison and analysis
To date, 12 patients were included under STAR-IO and 10 patients under STAR. Results from 20 retrospective patients under SP are used for comparison. Statistics and details on these patients can be found in (Dickson et al., 2017) and (Penning et al., 2014b).
Safety, performance, nutrition, workload, and compliance are compared. Safety is assessed by the percentage BG in mild and severe hypoglycaemic (BG ≤ 4.0 mmol/L and BG ≤ 2.2 mmol/L respectively), and in severe hyperglycaemia (BG > 10.0 mmol/L). Performance is evaluated by the percentage BG in target band (4.4-8.0 mmol/L or 5.6-8.3 mmol/L), and per-patient median BG achieved. Workload considers the number of measurements per day. Nutrition comparisons are made using the per-patient dextrose rates achieved in g/h and in % of the original GF. Compliance is analysed by the % of interventions unchanged from the original protocol recommendations. Only changes in insulin rate (and/or nutrition for STAR) occurring within 15 minutes after recommendation time are considered, unless it resulted from clinical stoppage. BG measurements are resampled hourly to allow fair comparison of the data, using linear interpolation (Stewart et al., 2018b).
3. RESULTS
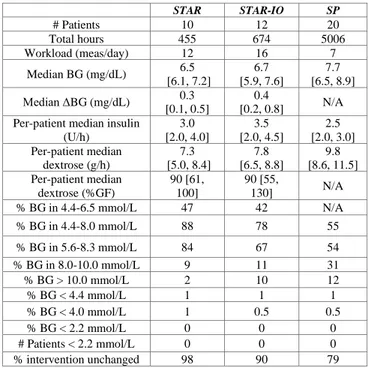
Clinical results for STAR-IO, STAR, and retrospective results for SP are presented in Table 1. Resampled BG, insulin, and nutrition cumulative distribution functions (CDFs) are shown in Fig. 2.
Performance is significantly higher for STAR. Lower (6.5 [6.1, 7.2] mmol/L) BG levels were achieved compared to STAR-IO (6.7 [5.9, 7.6] mmol/L) and SP (7.7 [6.5, 8.9] mmol/L), with less variability for STAR compared to STAR-IO (overall median [IQR] hour-to-hour BG measurements difference of 0.3 [0.1, 0.5] mmol/L vs. 0.4 [0.2, 0.8] mmol/L). Time in target band (4.4-8.0 mmol/L) was much higher for STAR (88%) compared to STAR-IO (78%). SP %BG in that range was only 55%. Considering the SP target band (5.6-8.3 mmol/L), STAR outperformed both STAR-IO and SP (84%, 67%, and 54%).
Table 1. Clinical results for STAR-IO, STAR, and SP.
STAR STAR-IO SP # Patients 10 12 20 Total hours 455 674 5006 Workload (meas/day) 12 16 7 Median BG (mg/dL) 6.5 [6.1, 7.2] 6.7 [5.9, 7.6] 7.7 [6.5, 8.9] Median ΔBG (mg/dL) 0.3 [0.1, 0.5] 0.4 [0.2, 0.8] N/A Per-patient median insulin
(U/h) 3.0 [2.0, 4.0] 3.5 [2.0, 4.5] 2.5 [2.0, 3.0] Per-patient median dextrose (g/h) 7.3 [5.0, 8.4] 7.8 [6.5, 8.8] 9.8 [8.6, 11.5] Per-patient median dextrose (%GF) 90 [61, 100] 90 [55, 130] N/A % BG in 4.4-6.5 mmol/L 47 42 N/A % BG in 4.4-8.0 mmol/L 88 78 55 % BG in 5.6-8.3 mmol/L 84 67 54 % BG in 8.0-10.0 mmol/L 9 11 31 % BG > 10.0 mmol/L 2 10 12 % BG < 4.4 mmol/L 1 1 1 % BG < 4.0 mmol/L 1 0.5 0.5 % BG < 2.2 mmol/L 0 0 0 # Patients < 2.2 mmol/L 0 0 0 % intervention unchanged 98 90 79
Data given as median [IQR] as appropriate, multiply by 18 for mg/dL.
Fig. 2. BG, Insulin, and Nutrition cumulative distribution
functions for STAR and STAR-IO.
Safety was high and similar across all protocols, but STAR had slightly higher mild hypoglycaemia (1% BG < 4.0 mmol/L) compared to STAR-IO and SP (0.5%). No patients in any arms experienced severe hypoglycaemia. On the other extreme, severe hyperglycaemia (BG > 10.0 mmol/L) was significantly lower for STAR (2%), compared to STAR-IO (10%) and SP (12%). Mild hyperglycaemia (8.0-10.0 mmol/L) for STAR and STAR-IO were similar (9% and 11%), and significantly lower than SP (31%).
Higher per-patient median insulin rates were administered for STAR-IO (3.5 [2.0, 4.5] U/h) compared to STAR (3.0 [2.0, 4.0] U/h) and SP (2.5 [2.0, 3.0]), while the per-patient median dextrose rate was higher for SP (9.8 [8.6, 11.5] g/h) compared to STAR-IO (7.8 [6.5, 8.8] g/h) and STAR (7.3 [5.0, 8.4] g/h). However, this difference between STAR and STAR-IO becomes smaller when considering the %GF (90 [61, 100] vs. 90 [55, 130] %GF).
Overall, these results were achieved with higher workload for STAR-IO (16 measures per day) and STAR (12 measures per day) compared to SP (7 measures per day). However, these outcomes are expected from protocol design.
Finally, compliance to protocol was high for all protocols, but, interestingly, much higher for STAR (98%) and STAR-IO (90%) compared to the standard protocol (79%).
4. DISCUSSION
Clinical results from this ongoing trial are encouraging, and suggest key observations. Overall, STAR (and STAR-IO) achieved safe and effective control for all patients, despite targeting a lower target band than SP or those usually recommended in ICU guidelines. This result suggests intensive GC to lower target bands is possible without increasing hypoglycaemic risks. Furthermore, it reinforces the idea that GC has been wrongly blamed for hypoglycaemia (Uyttendaele, et al., 2019b), while protocol design is the primary concern to safely achieve high quality GC outcomes. This goal is essential before assessing potential clinical outcome, and failing to do so would suggest poor protocol design (Uyttendaele, et al., 2017).
The difference in %BG in the 4.4-8.0 mmol/L range using STAR (~80-90%) compared to SP (55%) is significant, and these ranges have been associated with improved outcomes in numerous studies (Krinsley et al., 2015; Penning, et al., 2014a; Signal et al., 2012). While this result could be explained from the modestly different target band, SP only managed to have 54 %BG within target (5.6-8.3 mmol/L), where STAR (84%) and STAR-IO (67%) performed better in this range also.
SP %BG in mild hyperglycaemia is high compared to STAR and STAR-IO (31% vs. ~10%). The higher target could somewhat explain this result, or the higher BG level starting criteria (10.0 mmol/L compared to 8.0 mmol/L with STAR). However, it is likely a consequence of clinical judgement considering BG in 8.0-10.0 mmol/L as acceptable. The lower compliance to protocol for SP (79%) could also explain this result (Penning, et al., 2014b).
A previous analysis showed that 68% of the 21% total
interventions changed from original protocol
recommendations were made when BG was above target band. For those 68%, nurses (unexpectedly) decreased insulin in 62% of the deviations. While in band, 18% of the 21% total intervention changes were made, from which 78% were a decreased in insulin rate. In STAR and STAR-IO, compliance to protocol was high, and even higher for STAR. Typically, nurses increased insulin for very resistant patients.
However, insulin effect saturates insulin at 9U/h. Two changes were made to reduce insulin, while close to 4.4 mmol/L, by fear of hypoglycaemia.
STAR’s lower incidence of mild and severe hyperglycaemia compared to STAR-IO is a consequence of nutrition modulation. This result is also reflected in the overall nutrition rates achieved, and insulin requirements (Fig. 2). While being somewhat lower in STAR, the gain in performance is significant. In fact, nutrition below GF for STAR is minimal, because nutrition is mainly temporarily decreased for very resistant patients, where BG remains high while receiving the maximum insulin rate. These patients BG levels can only be lowered if glucose intake is lowered. A recent study analysed the nutrition delivery of STAR compared to other ICUs in the world, and showed STAR performs equal to the best ICUs in the world (Stewart et al., 2018a). Therefore, despite modulating nutrition, STAR does not underfeed patients, and still manages to improve GC outcomes.
The main trade-off using STAR is the increased workload. Workload for STAR (12 measures per day) compared to SP (7 measures per day). However, the increased safety and performance explain the increased clinical burden. Additionally, in a previous study, virtual trials of SP on virtual patients created using this cohort data suggested, despite similar GC outcomes, a likely low compliance to protocol (Uyttendaele et al., 2018b). Simulations show SP needed an average of 11 measurements per day when exactly following the protocol, much higher than the 7 observed here, and, more importantly, very close to the 12 measurements per day required by STAR.
This model-based GC protocol identifies and directly uses inter- and intra- patient variability to improve safety and efficacy of GC, avoiding reliance on clinical judgment (Chase et al., 2018). Altogether, the improved safety, improved performance, and lower glycaemic variability, all associated with lower mortality, lower morbidity and lower ICU length of stay (Ali et al., 2008; Chase, et al., 2010a; Egi
et al., 2006; Egi et al., 2010; Krinsley, 2005; Mesotten et al.,
2009; Van den Berghe et al., 2006), might be worth the slightly increased workload.
This study compares clinical data to retrospective patients and has some limitations. The number of patients in each arm are not identical, and the results are not based on the exact same underlying cohorts. However, these patients are from the same general medical ICU, and the cohorts are believed to be representative of the overall population. More work is needed to generalise STAR to other population.
5. CONCLUSIONS
STAR was able to achieve safe and effective GC, while targeting lower intermediate glycaemic ranges, associated with improved outcomes. The full STAR version is also able to tailor nutrition needs for the patient, by temporarily reducing caloric intake for persistent hyperglycaemia. This approach significantly improves GC performance compared
to the insulin-only version, STAR-IO. These intermediate results of the STAR-Liège clinical trial are encouraging, and suggest the continuation of this trial.
GC needs to be safe and effective for all patients, regardless of patient condition. Computerised model-based methods using key physiological parameters to identify patient-specific needs have recently proven positive results in GC targeting lower glycaemic ranges. It is thus maybe time to reopen the debate on GC, and avoid to be guided by fear of hypoglycaemia.
REFERENCES
Ali, N. A., O'Brien, J. M., et al. (2008). Glucose variability and mortality in patients with sepsis. Crit Care Med,
36, 2316-2321.
Brunkhorst, F. M., Engel, C., et al. (2008). Intensive insulin therapy and pentastarch resuscitation in severe sepsis. N Engl J Med, 358, 125-139.
Chase, J. G., and Dickson, J. (2017). Traversing the valley of glycemic control despair. Critical Care.
Chase, J. G., Preiser, J. C., et al. (2018). Next-generation, personalised, model-based critical care medicine: a state-of-the art review of in silico virtual patient models, methods, and cohorts, and how to validation them. Biomed Eng Online, 17, 24.
Chase, J. G., Pretty, C. G., et al. (2010a). Organ failure and tight glycemic control in the SPRINT study. Crit
Care, 14, R154.
Chase, J. G., Shaw, G., et al. (2008). Implementation and evaluation of the SPRINT protocol for tight glycaemic control in critically ill patients: a clinical practice change. Crit Care, 12, R49.
Chase, J. G., Suhaimi, F., et al. (2010b). Validation of a model-based virtual trials method for tight glycemic control in intensive care. Biomed Eng Online, 9, 84. Davidson, S., Pretty, C., et al. (2019). Multi-input stochastic
prediction of insulin sensitivity for tight glycaemic control using insulin sensitivity and blood glucose data. Comput Methods Programs Biomed, 182. Davidson, S., Uyttendaele, V., et al. (2020). Virtual patient
trials of a multi-input stochastic model for tight glycaemic control using insulin sensitivity and blood glucose data. Biomedical Signal Processing and
Control.
Dickson, J. L., Stewart, K. W., et al. (2017). Generalisability of a Virtual Trials Method for Glycaemic Control in Intensive Care. IEEE Transactions on Biomedical
Engineering, 65.
Docherty, P. D., Chase, J. G., et al. (2012). Characterisation of the iterative integral parameter identification method. Med Biol Eng Comput, 50, 127-134. Egi, M., Bellomo, R., et al. (2006). Variability of blood
glucose concentration and short-term mortality in critically ill patients. Anesthesiology, 105, 244-252. Egi, M., Bellomo, R., et al. (2010). Hypoglycemia and
outcome in critically ill patients. Mayo Clin Proc,
85, 217-224.
Evans, A., Le Compte, A., et al. (2012). Stochastic targeted (STAR) glycemic control: design, safety, and performance. J Diabetes Sci Technol, 6, 102-115. Finfer, S., Chittock, D. R., et al. (2009). Intensive versus
conventional glucose control in critically ill patients.
N Engl J Med, 360, 1283-1297.
Finfer, S., Liu, B., et al. (2012). Hypoglycemia and risk of death in critically ill patients. N Engl J Med, 367, 1108-1118.
Fisk, L. M., Le Compte, A. J., et al. (2012). STAR development and protocol comparison. IEEE Trans
Biomed Eng, 59, 3357-3364.
Gunst, J., and Berghe, G. (2016). Blood glucose control in the ICU: don’t throw out the baby with the bathwater! Intensive Care Med, 42.
Krinsley, J. S. (2003). Association between hyperglycemia and increased hospital mortality in a heterogeneous population of critically ill patients. Mayo Clin Proc,
78, 1471-1478.
Krinsley, J. S. (2004). Effect of an intensive glucose management protocol on the mortality of critically ill adult patients. Mayo Clin Proc, 79, 992-1000. Krinsley, J. S. (2005). Glucose control reduces ICU stay and
mortality. Perform Improv Advis, 9, 4-6, 1.
Krinsley, J. S. (2018). Is It Time to Rethink Blood Glucose Targets in Critically Ill Patients? Chest, 154, 1004-1005.
Krinsley, J. S., and Preiser, J. C. (2015). Time in blood glucose range 70 to 140 mg/dl >80% is strongly associated with increased survival in non-diabetic critically ill adults. Crit Care, 19, 179.
Lin, J., Lee, D., et al. (2006). Stochastic modelling of insulin sensitivity variability in critical care. Biomedical
Signal Processing and Control, 1, 229-242.
Lin, J., Lee, D., et al. (2008). Stochastic modelling of insulin sensitivity and adaptive glycemic control for critical care. Comput Methods Programs Biomed, 89, 141-152.
Lin, J., Razak, N. N., et al. (2011). A physiological Intensive Control Insulin-Nutrition-Glucose (ICING) model validated in critically ill patients. Comput Methods
Programs Biomed, 102, 192-205.
McAuley, K. A., Berkeley, J. E., et al. (2011). The dynamic insulin sensitivity and secretion test - a novel measure of insulin sensitivity. Metabolism, 60, 1748-1756.
McCowen, K. C., Malhotra, A., et al. (2001). Stress-induced hyperglycemia. Crit Care Clin, 17, 107-124. Mesotten, D., Dubois, J., et al. (2017). Software-guided
versus nurse-directed blood glucose control in critically ill patients: the LOGIC-2 multicenter randomized controlled clinical trial. Crit Care, 21, 212.
Mesotten, D., and Van den Berghe, G. (2009). Clinical benefits of tight glycaemic control: focus on the intensive care unit. Best Pract Res Clin Anaesthesiol, 23, 421-429.
Penning, S., Chase, J. G., et al. (2014a). Does the achievement of an intermediate glycemic target reduce organ failure and mortality? A post hoc
analysis of the Glucontrol trial. J Crit Care, 29, 374-379.
Penning, S., Lambermont, B., et al. (2014b). In silico assessment of a computarized model-based glycaemic control approach in a Belgian medical intensive care unit. IFAC Proceedings Volume, 47, 9913-9918.
Penning, S., Pretty, C., et al. (2015). Glucose control positively influences patient outcome: A retrospective study. J Crit Care, 30, 455-459. Preiser, J. C., Chase, J. G., et al. (2016a). Glucose Control in
the ICU: A Continuing Story. J Diabetes Sci
Technol, 10, 1372-1381.
Preiser, J. C., Devos, P., et al. (2009). A prospective randomised multi-centre controlled trial on tight glucose control by intensive insulin therapy in adult intensive care units: the Glucontrol study. Intensive
Care Med, 35, 1738-1748.
Preiser, J. C., and Straaten, H. M. (2016b). Glycemic control: please agree to disagree. Intensive Care Med, 42, 1482-1484.
Reed, C. C., Stewart, R. M., et al. (2007). Intensive insulin protocol improves glucose control and is associated with a reduction in intensive care unit mortality. J
Am Coll Surg, 204, 1048-1054; discussion
1054-1045.
Signal, M., Le Compte, A., et al. (2012). Glycemic levels in critically ill patients: are normoglycemia and low variability associated with improved outcomes? J
Diabetes Sci Technol, 6, 1030-1037.
Singer, P., Blaser, A. R., et al. (2019). ESPEN guideline on clinical nutrition in the intensive care unit. Clin
Nutr, 38, 48-79.
Stewart, K. W., Chase, J. G., et al. (2018a). Nutrition delivery of a model-based ICU glycaemic control system. Ann Intensive Care, 8, 4.
Stewart, K. W., Pretty, C. G., et al. (2018b). Interpretation of Retrospective BG Measurements. J Diabetes Sci
Technol, 12, 967-975.
Stewart, K. W., Pretty, C. G., et al. (2016). Safety, efficacy and clinical generalization of the STAR protocol: a retrospective analysis. Ann Intensive Care, 6, 24. Uyttendaele, V., Dickson, J., et al. (2018a). A 3D insulin
sensitivity prediction model enables more patient-specific prediction and model-based glycaemic control. Biomed Signal Process Control.
Uyttendaele, V., Dickson, J. L., et al. (2017). Untangling glycaemia and mortality in critical care. Crit Care,
21, 152.
Uyttendaele, V., Knopp, J. L., et al. (2019a). 3D kernel-density stochastic model for more personalized glycaemic control: development and in-silico validation. BioMedical Engineering OnLine, 18, 102.
Uyttendaele, V., Knopp, J. L., et al. (2018b). Preliminary results from the STAR-Liège clinical trial: Virtual trials, safety, performance, and compliance analysis.
IFAC-PapersOnline, 51, 355-360.
Uyttendaele, V., Knopp, J. L., et al. (2019b). Is intensive insulin therapy the scapegoat for or cause of
hypoglycaemia and poor outcome? IFAC Journal of
Systems and Control, 9.
Van den Berghe, G., Wilmer, A., et al. (2006). Intensive insulin therapy in the medical ICU. N Engl J Med,
354, 449-461.
Van den Berghe, G., Wouters, P., et al. (2001). Intensive insulin therapy in critically ill patients. N Engl J
Med, 345, 1359-1367.
Van Herpe, T., Mesotten, D., et al. (2013). LOGIC-insulin algorithm-guided versus nurse-directed blood glucose control during critical illness: the LOGIC-1 single-center, randomized, controlled clinical trial.