Université de Montréal
3D adaptive Wiener filter to restore brain SPECT image with reference MRI
par
Wei Li
Institut de génie biomédical
Mémoire présenté à la faculté des études supérieures en vue de l’obtention du grade de Maîtrise ès sciences appliquées
en génie biomédical
Avril, 2005
© Wei Li, 2005
r
J
o
ûde Montréal
Direction des bibliothèques
AVIS
L’auteur a autorisé l’Université de Montréal à reproduire et diffuser, en totalité ou en partie, par quelque moyen que ce soit et sur quelque support que ce soit, et exclusivement à des fins non lucratives d’enseignement et de recherche, des copies de ce mémoire ou de cette thèse.
L’auteur et les coauteurs le cas échéant conservent la propriété du droit d’auteur et des droits moraux qui protègent ce document. Ni la thèse ou le mémoire, ni des extraits substantiels de ce document, ne doivent être imprimés ou autrement reproduits sans l’autorisation de l’auteur.
Afin de se conformer à la Loi canadienne sur la protection des renseignements personnels, quelques formulaires secondaires, coordonnées ou signatures intégrées au texte ont pu être enlevés de ce document. Bien que cela ait pu affecter la pagination, il n’y a aucun contenu manquant.
NOTICE
The author of this thesis or dissertation has granted a nonexclusive license allowing Université de Montréal to reproduce and publish the document, in part or in whole, and in any format, solely for noncommercial educationat and research purposes.
The author and co-authors if applicable tetain copyright ownership and moral rights in this document. Neither the whole thesis or dissertation, nor substantial extracts from it, may be printed or otherwise reproduced without the author’s permission.
In compliance with the Canadian Privacy Act some supporting forms, contact information or signatures may have been removed from the document. While this may affect the document page count, it does not represent any loss of content from the document.
Université de Montréal Faculté des études supérieures
Ce mémoire intitulé
3D adaptive Wiener filter to restore brain SPECT image with reference MRI
présenté par: Wei Li
a été évalué par un jury composé des personnes suivantes:
Prof. Fanda Chenet, Ph.D., président rapporteur
Prof. Jean Meunier, Ph.D., directeur de recherche
Prof. Jean-Paul Soucy, Ph.D., codirecteur de recherche
Acknowledgement
I wish to take this opportunity to express my sincere thanks to my advisor, Prof. Jean Meunier, for bis indispensable guidance, valuable suggestions, continuous encouragement and financial assistance in ail the time of research and writing of this thesis. I have greatiy benefited from not oniy bis insights and enthusiasm on research, but aiso bis uniimited patience and devotion to education.
I wouid like to thank my co-advisor, Dr. Jean-Paul Soucy, from University of Montreai Hospitai (CHUM) and Montreai Neurological Institute (McGiii University) for providing me raw data, having important discussions with me and heiping me complete this thesis. I also want to thank Prof. Max Mignotte for his wonderful course, Image Processing, and his previous research works.
My colleagues of the laboratory of Vision give me lots of helps, specially, Elise Nguyen and Jean-François Laliberté. I want to say many thanks for being your colleague.
Finally, I am very grateful for my parents for their deep love. I believe that my father would be happy if he saw the finish ofthis thesis.
V
Abstract
Single Photon Emission Computed Tomography (SPECT) brain bÏood flow imaging is a routine diagnostic technique used in clinical settings to provide accurate assessments of a variety of neurological and psychiatric diseases, such as, epilepsy, dementias and other neurodegenerative affections, strokes, traumatic brain injury, etc.. However, brain SPECT imaging offers relatively low spatial resolution and often limited contrast, making it potentially difficuit to interpret.
A restoration technique for enhancing image contrast and reducing noise using a 3D adaptive Wiener filter is presented in this work. The well-known Wiener filter is a global filter which is optimal in the sense that it minirnizes the mean square error between the original image and the estimate. When the Wiener filter is applied to restore degraded images, a priori information about the point spread flrnction (PSF) and the power spectrum of the original image and noise have to be available. Unfortunately, these information are generally unknown.
To overcome these limitations of the Wiener filter, we propose using a reference image to provide a priori information on the brain SPECT image and to track precisely
the change of contrast and mottle. The reference image is produced by a higher resolution brain MRI scan of the same patient co-registered to the SPECT study. According to the characteristics of the brain SPECT imaging, we also assume that the PSF of the system is a Gaussian ftinction with unknown standard deviation and the system noise is an additive white Gaussian noise (AWGN). The 3D adaptive Wiener filter then can automatically choose the best combination of its two parameters (the PSF width and the power spectrum density of noise) based on the contrast-mottle criterion to finally restore the SPECT image.
Tests are conducted with both synthetic SPECT images resulting from a digital Hoffman phantom and actual clinical SPECT cases. Our resuits show that the contrast of images is significantly improved by at Ïeast a factor of 2 while kceping amplification of noise at acceptable level.
Résumé
L’imagerie SPECT du flot sanguin cérébral est un outil important dans le diagnostic et l’évaluation de maladies neurologiques et psychiatriques telles que l’épilepsie, les démences de type Alzheimer, les accidents vasculaires cérébraux, les lésions cérébrales traumatiques, etc.. Cependant, les images SPECT souffrent d’une pauvre résolution et d’un faible contraste qui peuvent rendre le diagnostic difficile pour les médecins.
Une méthode de restauration utilisant le filtre adaptatif de Wiener 3D a été proposée pour améliorer le contraste des images et réduire le bruit. Le filtre de Wiener est un filtre global bien cornai qui est optimal dans le sens où l’erreur quadratique moyenne entre l’image originale et l’estimation est minimisée. Quand le filtre de Wiener est appliqué pour restaurer les images dégradées, des connaissances a priori sur la fonction de réponse impulsionnelle (PSF) du système de formation de l’image et les spectres de puissance de l’image original et du bruit sont nécessaires. Malheureusement, ces informations ne sont souvent pas disponibles.
Pour contourner ces problèmes, nous proposons d’utiliser une image de référence qui est capable de fournir une information apriori sur l’image SPECT du cerveau et de suivre précisément les changements du contraste et du bruit. L’image de référence est générée par le recalage d’une image IRM de ce même cerveau sur l’image SPECI. Nous supposons aussi que la PSF du système est une fonction Gaussienne avec un écart-type inconnu et le bruit est un bruit blanc gaussien additif (AWGN). Le filtre adaptatif de Wiener 3D peut alors choisir automatiquement la meilleure combinaison de ces deux paramètres (la largeur de la PSF et le spectre de puissance du bruit) basée sur un critère de contraste-bruit pour restaurer l’image SPECT.
Les tests sont faits sur des images SPECT synthétiques qui sont produites avec un fantôme numérique de Hoffman et de vraies images SPECT obtenues en clinique. Nos résultats indiquent que le contraste des images est amélioré au moins par un facteur 2. En même temps, l’amplification du bruit demeure acceptable.
vii
List of Contents
Acknowledgement iv
Abstract y
Résumé vi
List of Contents vii
List of Figures ix
List ofAbbreviations xi
Chapter 1 1
Introduction 1
1.1 SPECT imaging 1
1.1.1 The history of development of SPECT imaging 1
1.1.2 SPECT instrumentation 4
1.1.3 Application ofbrain SPECT imaging in clinic 10
1.2 Sources ofdegradation in SPECT imaging 12
1.3 Image restoration techniques overview 17
1.4 DICOM standard 22
1.5 Content of the rest of this thesis 23
Chapter 2 24
Adaptive Wiener Filtering 24
2.1 Introduction 24
2.2 Restoration problem formulation 25
2.3 Wiener filter 29
2.3.1 Introduction 29
2.3.2 Inverse filter— least-squares unconstrained restoration 29
2.3.3 Wiener filter least-squares constrained restoration 30
2.4 Adaptive Wiener filter 33
2.4.1 Limitations ofthe Wiener filter 33
2.4.2 image contrast-mottle criterion 34
Chapter 3 .39
MRI Data Preprocessing 39
3.1 Introduction 39
3.2 Segmentation and registration 40
3.2.1 Segmentation 40
3.2.2 Registration 41
3.3 MRI data preprocessing 43
3.3.1 Removal of skull and scalp with Brain Extraction Tool (BEl) 44
3.3.2 MRI-SPECT registration with AIR 45
3.3.3 Segmentation of the registered MRI volume 48
3.3.4 Regional cerebral activity assignment 49
Chapter 4 50
Experirnent and Resuits 50
4.1 Restoration of synthetic brain SPECT image of Hoffinan Phantom 50
4.1.1 Hoffman phantom 50
4.1.2 Synthetic SPECT 50
4.1.3 Restoration of synthetic brain SPECT image 52
4.2 Restoration of reat brain SPECT image 53
4.2.1 Reference image 53 4.2.2 Restoration 54 4.3 Discussion 55 Chapter 5 64 Conclusion 64 References 66
ix
List of figures
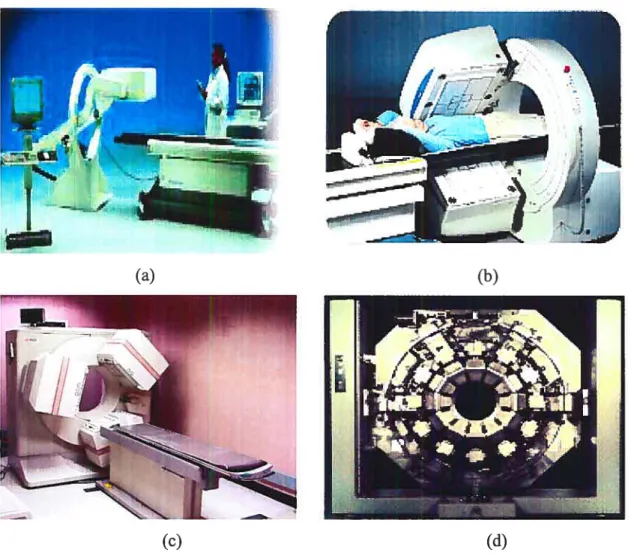
Figure E: SPECT system with (a) One head. b) Bi-head. (c) Tri-head. (d) Full-ring
detector 5
figure 2: (a) Four types of collimator: parallel, pinhole, converging and diverging. (b)
Parallel collimator 6
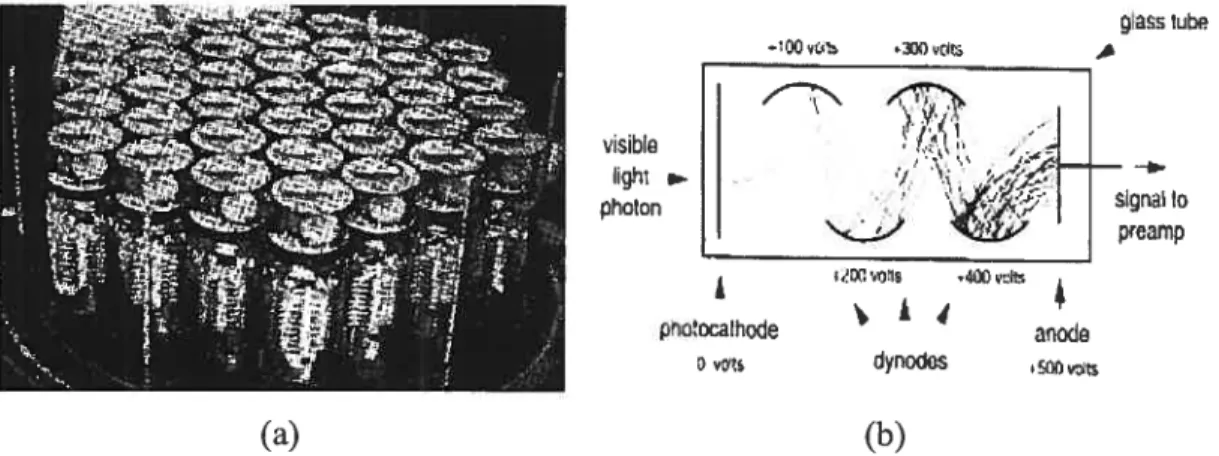
Figure 3: ta) PMT array. (b) The flinctional diagram of one PMT 7
Figure 4: (a) The functional diagram of the position circuitry. (b)The position of
scintillation chosen by the position circuitry $
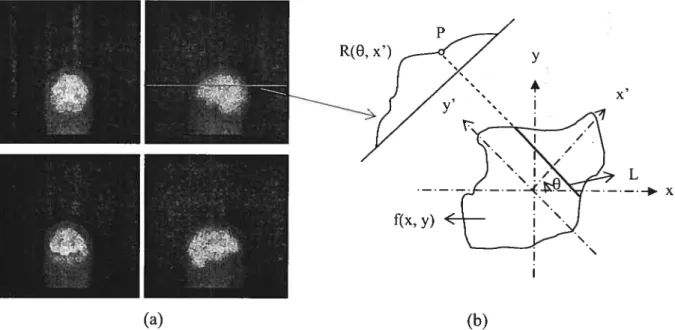
Figure 5: (a) 3D SPECT data acquisition, a set of 2D projections (a total of 90
projections). (b) 1D projection ofa plane at angle O $
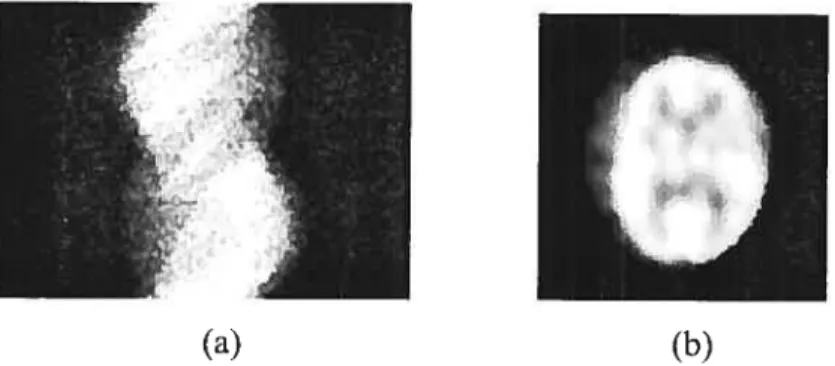
Figure 6: (a) The collection of Radon transforms of a brain suce at all angles. (b) A
suce ofa brain SPECT image 9
Figure 7: Four effects of attenuation. (a) Photoelectric effect. (b) Compton scattering.
(c) Coherent scattering. (d) Pair production [ABO5] 13
Figure 8: Differential cross-section for the photo-electric effect, Compton scattering, coherent scattering and pair production and total cross-section for water as a
function of photon energy [SanO3] 14
Figtire 9: (a) Lower sensitivity and higher resolution collimator. (b) Higher sensitivity
and lower resolution collimator 15
f igure 10: The block diagram of an imaging system 25
Figure 11: The bÎock diagram of the Wiener filter 33
Figure 12: Interpretation ofthe proposed technique 38
Figure 13: The block diagram ofthe system 39
Figure 14: Three views ofa surface mesh 44
Figure 15: The flow chart ofthe Brain Extraction Tool 47
Figure 16: Trilinear interpolation 48
Figure 17: (a) Original Hoffman phantom suce. (b.1) Synthetic SPECT slice with PSF FWHM =7.94 mm and noise variance = 1000, contrast C, =18.10%
and mottic ]‘vfd =32.70% . (c.1) Restored image for (b.l), contrast C. =
FWHM = 11.91 mm and noise variance = 100, contrast C, =7.80% and
mottie Md=24.91%. (c.2) Restored image for (b.2), contrast C, 28.74 %
and mottieMr= 27.78% 51
Figure 18: The flow chart ofthe adaptive Wiener filter 56
Figure 19: (a) A suce ofthe MRI volume in axial view. (b) A suce of SPECI volume
in axial view 57
Figure 20: (a) The original SPECT. (b) The MRI after brain extraction and scaling (c)
The registered MRI. (d) The segmented and registered MRI 58
Figure 21: (a) The original SPECT image. (b) The restored SPECT image 59
Figure 22: Synthetic SPECT #2. (Up) Contrast vs. K with different G in voxel. (Low)
Mottie vs. Kwith different ain voxel (1 voxel =1.69 mm and fWHM = 3.97
mm) 60
Figure 23: Real SPECT. (Up) Contrast vs. Kwith different G in voxel. (Low) Mottle vs.
xi
List of Abbrevïafions
YD One Dimensional
2D Two Dimensional
3D Three Dimensional
ACR American College ofRadiology
AIR Automated Image Registration
ARMA Auto-Regressive Moving Average
AWGN Additive White Gaussian Noise
CHUM University of Montreal Medical Center
CSF Cerebrospinal Fluid
DICOM Digital Imaging and Communications in Medicine
EEG Electroencephalogram
FWHM Full Width at Haif Maximum
GM Grey Matter
MAP Maximum a Posteriori
ML Maximum Likelihood
MRI Magnetic Resonance Imaging
NEMA National Electrical Manufacturers Association
PSF Point Spread Function
PMT Photomultiplier Tube
SPECT Single Photon Emission Computed Tomography
SID Square Intensity Differences
Introduction
Single Photon Emission Computed Tornography (SPECT) imaging of cerebral blood flow lias been widely used in diagnosing brain diseases due to its ability to reveal abnormal regions of cerebral blood flow at a cost-efficient level. However brain SPECT images suffer from limited resolution and lower contrast compared to Magnetic Resonance Imaging (MRI) scans, which unfortunately can only provide anatomical information. Thc goal of this work is to improve the quality of the present SPECT images in clinic with the help of MRI data using a restoration approach. In this chapter, we will first introduce sorne general information about SPECI imaging, including a
brief history, instrumentation, and examples of applications to clinical problems. We then address the issue of degradation that affects the quality of brain SPECT images in
the second section. Section 1.3 contains a literature review of restoration techniques for dealing with degradation problem. A brief description about the Digital Imaging and Communications in Medicine (DICOM) standard that is widely used in the medical imaging comrnunity will be given in section 1.4. FinaÏly, we will present the organization ofthe rest ofthis thesis.
1.1
SPECT imaging
1.1.1 The history of develop ment of SPECT imaging
SPECT is routinely used to help diagnose a variety of diseases in every organ system of the human body. SPECT imaging uses a gamma camera to collect gamma rays emitted from a patient previously administered with a small dose of a radiotracer (usually composed ofa carrier molecule determining the localization ofthe agent, and of a radioactive atom providing the detectable signal) and reconstnicts 3D images based on
2 data thus collected. SPECT allows us to visualize functional information about a patient’s body system or specific organ.
SPECT imaging is one of the rnost common tools in Nuclear Medicine. Nuclear Medicine lias a complex and multifaceted heritage. Many scientists and researcliers made their contributions to its development. Here we oniy mention those major evolutions in the histoiy. Altliough the first emission computed tomography device, MARK IV, was deveïoped by Kuhi and Edwards in 1963 [KE63], the foundation of Nuclear Medicine was laid down at the end of the l9tli century and the beginning ofthe 2Otli century.
Ail began with the discovery ofX-rays in 1895 by Roentgen, a German pliysics professor. Whuïe experirnenting with electron beams in a gas discharge tube, he discovered some unknown (X) rays capable of producing an image on nearby photographic plates. Roentgen won the first Nobel Prize in physics in 1901. Roentgen’s remarkable discovery precipitated one of the most important medical advancernents in human history.
Henri Becquerels discovery of natural radioactivity with uranium salts was in 1896 [NobOS]. This extraordinary discovery caused a real revolution in scientific thought and lcd to a new breaktlirough in the understanding of the universe. He was tlierefore named “father ofradioactivity”.
Two years later, in 1898, Pierre and Marie Curie discovered the radioactive element polonium. Tliey introduced tlie new terrn: “radioactive” {AE93]. After mucli very difficuit and tiring work, the Curies were able to establish thc cliemical properties of polonium and those ofanother radioactive elernent, radium [CC 1898]. Both polonium and radium were more radioactive than uranium. The Curies and Henn Becquerel were
1903 Nobel Laureates.
Lord E. Rutherford was a British physicist. He discovered three different kinds of radiation produced by uranium cornpounds in 1899 [BLO4]. He then separated and namcd them alpha, beta and gamma radiation according to their penetrating abilities. He also proposed a model ofthe atomic nucleus. He was a 190$ Nobel Laureate.
In 1913 Frederick Soddy introduced the name “isotope”. He obtained the 1921 Nobel Prize in Chemistry.
The first artificial radioactive isotopes were produced by Irene Curie, the daughter of Pierre and Marie, in 1934 (Noble Laureate in 1935). At the tirne, uses of radionuclides were only for some treatments(therapy) and metabolic tracer studies, rather than imaging, because more sophisticated, econornical means to produce radioactive materials for widespread application in medicine, military and other industries were not available.
The widespread clinical use of Nuclear Medicine did not start until the mid of 2Oth century. The l950s were a major milestone in Nuclear Medicine. In 1957, Walter Tucker’s group at the Brookhaven National Laboratory invented the first iodine-132 and technetium-99rn generator [SNMO5]. Technetium-99m, a radioactive isotope of the man-made element technetium with a suitable haif-life of about 6 hours, relatively low gamma energy (140-keV) and causing minimal radiation damage to body organs, thus, becomes the most widety used radioisotope.
In 1952, Hal O. Anger invented the first gamma camera, which included a pinhole collimator in front of a thallium-activated NaI(Tt) crystal (5/6” thick) and a large piece of photographic paper for ïn vivo studies of a turnor [WagO3]. In 1957, Anger replaced the film and screen with a NaI(T1) crystal 4 inches in diameter followed by 7 photomultipiiers. This is a truly revolutionary contribution to Nuclear Medicine as it is a stationary imaging system (versus Benedict Cassen’s rectilinear motion of its scanner) that is simultaneousiy sensitive to the ail radioactivity in a large field ofview. Anger’s design bas flot been dramatically improved and has only been evotving slowly to the present day. Modem Gamma cameras commonly tise a lead collimator perforated with many parallel, converging or diverging holes instead of the original pin-hole configuration.
There were also important developrnents in image reconstruction, such as algorithm for compensation of photon attenuation and emission tomography. In 1963, Kuhl and Edwards presented the first tomography imaging system using detectors mounted around a patients head, which became the precursor to SPECT. However these
4 images were ofpoor quality, so the technique was flot wideÏy accepted. In the same year, Alan M. Cormack, a nuclear physicist, developed mathematical algorithms to calculate internai attenuation values, which is very important for image reconstruction. In 1967, Godfrey N. Hounsfield developed image reconstruction algorithms for tomography using computers. The algorithms took into account the effects of photon attenuation and scatter. Both Cormack and Hounsfield were awarded the 1979 Nobel Prize in Physiology or Medicine.
The concept of the SPECT device was developed between 1974 and 1977 (J. Keyes and ass. and R. Jaszczak and ass.), while conimercial production started in 1982
[SteOl].
Since then, SPECT imaging lias become a major field in Nuclear Medicine [BPLM97] and the original single-headed camera has been replaced with two-, three and four-headed scanners, or even full-ring systems (see Fig. 1), which provide faster scanning with superb resolution.
1.1.2
SPECT înstrumentation
Most commercial SPECT equipments are based on the rotating gamma camera, either single- or multi-head, shown in Figure 1. A triple-headed SPECT system can
provide three times as much data as single headed camera for the same data acquisition time, which results in higher resolution. No matter how the SPECT system is equipped, with one or multiple heads, the basic hardware components remain the same. A SPECT imaging system essentially includes:
* Collimator
* Detector/NaI (Tl) scintillation crystal * Light guide
* Photomultiplier tube (PMT)
* Circuit for signal amplification and positioning * Computer for data analysis and image reconstruction
(a) (b)
(c) (d)
6 IIip- ii I
t!UtITf11I
L
ûblec Con-,ng IIItViUI\TrTITr/77
Dirgirij Image in cta’ ————-.. Ubjef:I////HfIft1,\\\\\
Ct:jeL (a) (b)Figure 2: (a) Four types of collimator: parallet, pinhole, converging and divergïng. (b) Parallel collimator.
The coilimator is the first object that an emitted gamma photon encounters afier exiting the body of a patient who is injected with a radioactive tracers, such as 99mTc, or FilIn The collimator is a crucial component of the gamma camera. Figure 2(a) shows four major types of collimators: parallel hole, pinhole, converging hole and diverging hole. The paraliel-hole collimator is the most widely used, because the image size remains the same as the object size. This type of collimator selects photons having direction perpendicular to the surface of the scintillation crystal and absorbs ail the rest of the radiation. Pinhole collimators offer higher magnification than parallel collimators and are used to magnify very small objects such as the thyroid by placing the object close to the pinhole, but at the cost of varying sensitivity depending on the location of the object and some distortion. The diverging and converging collimators can minimize and magnify the image. They create distortion in the images. The former is useful for imaging a large object with a small camera, andthe latter, for imaging smaller objects.
After going through the collimator, the incident gamma photons are detected by the scintillation crystal that is the real gamma radiation detector. NaI(Tl) is the preferred
material due to its higher conversion efficiency — about 13% of the energy deposited in
the crystal is emitted as visible light. The interaction of gamma ray photons with the crystal causes the release of the electrons that in tum interact with the crystal lattice to produce light photons. This phenomenon is called scintillation.
The light emitted by the crystal is then captured, amplified and localized by an
arrayofphotomultiplier tubes. As shown in Fig. 3(a), PMT array is attached to the back of the crystal. Each PMT consists of one photocathode and several dynodes (a typical photomultiplier tube has 10 to 12 dynodes). The photocathode converts light photons into electrons, and dynodes amplify the electrical signal at each step. Figure 3(b) describes the functions of a photomultiplier tube.
Usually, a gamma photon will be detected by more than one PMT. A position circuitry (Fig. 4(a)) is thus needed to determine the position of the scintillation event, based on the fact that the doser a PMT is to the scintillation event, the larger the output signal (Fig. 4(b)). The position of scintillation is finally determined by the calculation of the center of gravity ofthe outputs ofthe different PMTs.
In SPECT acquisition, a computer receives all incoming projection data (i.e. planar views acquired at multiple angles around the patient) and uses reconstruction algorithms to produce a final readable 3D image that depicts the 3D spatial distribution of gamma photo radioactivity within the patient.
casstube —00 A visible Iigh -photon 5IgnnIn preamp i’IXji -401) pnooathcjde  dynodes (b) (a)
v
(a) (b)
Figure 4: fa) The functional diagram of the position circuitry. (b)The position of scintillation chosen by the position circuitry.
Figure 5: (a) 3D SPECT data acquisition, a set of2D projections fa total of 90 projections). fb) 1D projection of a plane at angle O.
SMC _______________________ Ni [ry1I $ X-
HX
L
X L .—.—.-* X (a) (b)Before introducing SPECT image reconstruction, let’s look at the data acquisition process. The SPECT data acquisition is a set of 2D projections, which are obtained by rotating the gamma camera heads around the patient at various angles and shown in f ig. 5(a). Mathernatically, for parallel beam tornography, 1D projection of a
planar activity pattemJ(x, y) at angle O can be described by the radon transform for a set of parameters (x’,
),
which is the une integral through the imageJ(x,y), where the une is positioned according to the value of (x’,),
shown in f ig. 5(b). The 1D projection function can be expressed by R(x’, 9)=
[
f(x’ cos O— vsin O, x’ sin O+ y’cos O)dy’
For example, the value at point P in fig. 5(b) is the integral value along line L. The collection of Radon transforms of each slice of the object at ail angles is cailed the sinogram (Fig. 6). A set of2D sinograms forrri the raw data ofa 3D SPECT image.
Figure 6: (a) The collection of Radon transforms of a braïn slice at ail angles. (b) A suce of a brain SPECT image.
The most common reconstruction algorithm is filtered backprojection. It is based on the Fourier slice theorem, which telis us that the 1D Fourier Transform of the projection function at angle O is identical to the spectrum along that angle O in the frequency domain, i.e. the 2D Fourier Transform of the image. The principle of the filgtered backprojection for 2D image reconstruction is thus (a) taking 1D Fourier transforms of the projection function for each angle, (b)multiplying the result of the step (a) with a filter function
Iu
(where w is the radius in the polar coordinate system) in the frequency domain, (c) and then finding the inverse Fourier Transform. This algorithm can be easily extended to 3D volume. Without data filtering, the resultant reconstnicted images would be extremely noisy and unreadable, so the fiÏtered backprojection is actually used for the image reconstruction in most commercial SPECT systems. f igure 6(b) shows a slice of a brain SPECT image.10 1.1.3 Application ofbrain SPECT imaging in clinic
Brain SPECT imaging using a varicty of tracers (not just for evaluating blood flow) is a common application of SPECT imaging in the clinical world. It provides accurate assessment of regional cerebral functional activity that is important for the diagnosis of a variety of conditions. It can be used for instance in: (1) Iocating focal activation in epilepsy, (2) confirming and eventually specifying a clinical diagnosis of dementia, (3) giving supplementary information in addition to other imaging techniques (e.g. MRI or fMRI) to distinguish viable brain turnor from cerebral necrosis after radiation or chemotherapy, (4) allowing clinicians to clarify the nature of movernent disorders suci as Parkinson’s disease. Some information on those diseases is listed below. Many other conditions can also be evaluated with above techniques.
Epilepsy, a condition where a subject suffers from recurrent seizures, is a common and serious neurological condition. At any one tirne between 1 in 140 and 1 in 200 people in the United Kingdorn (at Ieast 300,000 peopte) are being treated for epilepsy [MBWMB96] [WST98]. Each year, in a cornmunity of 250,000 people between 125 and 200 wilI develop epilepsy [fCMCO2]. In the United States, the prevalence (the number of people with the disease at any one time) of aduit-onset epilepsy is around 2 million [FCA200Ï], and incidence (new cases occurring in a population during a specific period, here one year) is 135,500 [FCA2001]. Accurate preoperative localization of the seizure focus is very important for effective surgical treatment of patients with medically intractable complex partial seizure. lie
investigation from Cascino et al. [CBMSO4J shows ictal SPECT may be a reliable indicator ofthe ictal onset zone in patients’ intractable partial epilepsy for which surgery could be considered.
Alzheimer’s disease is the most common cause of dernentia among people aged 65 and older. Scientists estimate that up to 4 million people currently suffer from the disease, and the prevalence doubles every 5 years beyond age 65 in the United States [ADERCO5]. It is aÏso estimated that approxirnately 3 60,000 new cases (incidence) will occur each year and that this number will increase as the US population ages [BGK98].
A recent study from the University ofTexas Southwestern Medical Center by Frederick et al. pubtished in May 2004 [fHRHO4J showed that SPECT imaging may lead to early diagnosis ofAlzheimer’s disease. Researchers used SPECT to measure blood flow in the posterior cingulate cortex — an area of the brain that plays a part in orientation, sensory
interpretation and vocabulary retention. The posterior cingulated sign allows doctors to differentiate early-stage Alzheimer’s disease from other forms of dementia, such as frontotemporal disease.
Around 33,000 people are diagnosed annually with brain turnor (incidence) in the United States [ABTAOO]. Evaluation of possible recurrence after therapy remains a significant clinical problem, and SPECT imaging with tracers such as 99tTcMIBI can potentially help differentiate post-therapy damage from actual tumor recurrence. SPECT is not routinely used in the initial diagnosis of a brain tumor in the United States, but might complement information obtained from other scans to help doctors understand the effects of a tumor on brain activity and function.
The incidence and prevalence for Parkinson’s disease are 54,927 [APTAOO] and 1.5 million [NPF98], respectively, in the United States. Diagnosis can be quite difficuit early on, even for specialized neurologists, and reports have accumulated recently on the potential of SPECT imaging with Iigands targeting certain components of a specific neurotransmission system (the dopamine system) to allow for early, sensitive and specific diagnosis of this disease. For example, the findings from D. J. Tuite, MD, of Adelaide and Meath Hospital in Dublin [RSNAO2] show that SPECT images are useftil for early diagnosis of Parkinson’s disease. They tested 50 patients using radiopharmaceutical agent ioflupane with SPECT. The sensitivity of the SPECT diagnosis achieves 98% and the specificity 97%. He mentions too, that positron emission tomography (PET) is probably just as effective as SPECT but it is much more expens ive and is not readity.
In addition, brain SPECT imaging is flot only important for diagnosis, but also useful for case management, research, and follow-up of therapy efficacy such as potential neuroprotective and neurorestorative therapies for Parkinson’ s disease.
12 Since the total population of ail those brain diseases is huge, it is very important to have an efficient and accurate tool for diagnosis. Although brain SPECT imaging bas been employed for diagnosis for decades, researches by doctors and researchers are stili on-going in order to provide earlier or more accurate diagnosis with SPECT.
1.2
Sources of degradation in SPECT imaging
SPECT imaging is widely used in diagnosis, follow-up of patients and therapeutic management. However, the images suffer from relativcly poor spatial resolution and low contrast that can make it difficuit for physicians to corne up with an accurate interpretation for diagnosis, in particular, early diagnosis, i.e. when expected changes rnight be rather Iirnited. In this section, we wiH introduce those major degrading effects in SPECT imaging.
The degradation of SPECT images cornes from many sources: gamma photon attenuation, inherent blurring from collimator and scintillation detecor, scattering effect, and statistical noise. These degradations make SPECT images blutTy and noisy.
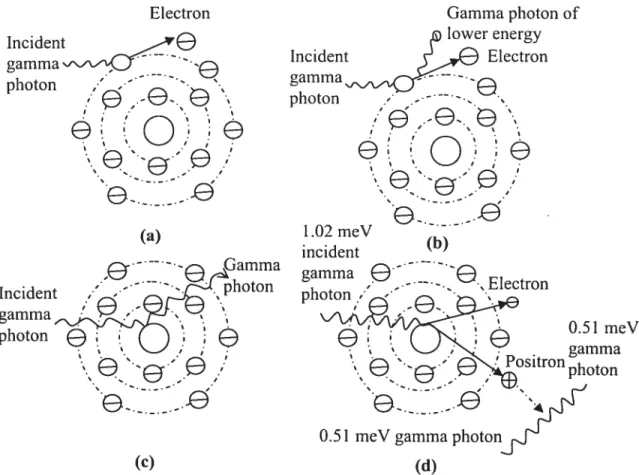
Attenuation is caused by the interaction of photons in the patient’s body ai-id other media on the path to the scintillation detector. The interaction of photons with rnatter causes four major effects [SanO3], photoelectric effect, Compton scattering (also known as incoherent scattering), coherent scattering, and pair production. The photoelectric effect takes place when a gamma photon strikes an orbital electron of the atom ofmaterials (body or media) and the total energy ofthe gamma is spent in ejecting that electron from its orbit, as shown in Fig. 7(a). The photoelectric effect occurs when the energy of gamma ray is below 50 keV. Compton scattering is an interaction in which a part of the energy of the incident gamma photon being transferred to an orbital electron to cause its ejection, a new and lower energy gamma photon having the remainder of the original photon’s energy is ernitted with a direction different from that of the incident gamma photon, as shown in Fig. 7(b). Compton scattering is thought to be the dominant phenomenon for gamma rays in the intermediate energy range 100 keV to 10 MeV. Figure 7(c) shows coherent scattering effect, which occurs when the incident
gamma photon interacts with the whoie atom. There is no internai energy exchange between the gamma photon and scattering atom, so the gamma photon just changes direction. Pair production is the case where a high energy gamma passes close enough to a heavy nucleus such that ail the energy of the gamma is converted into the mass of an eiectron-positron pair. If the original gamma has at least 1.02 meV energy, the positron is then converted into two gamma photons with 0.51 keV energy each, shown in Fig. 7(d). Obviousiy, such energies are flot encountered in clinicai Nuclear Medicine.
Attenuation causes a reduction in the number of photon detected by the gamma camera, resuiting in degradation of information about the distribution of the tracer within the body because attenuation is generaiiy not unifonn.
Gamma photon of lower energy Incident Electron gamma - - --- e photon -
-—
ee: (O,
e0
8
e
;/ 1.02meV incident (b) gammae-J.Z:e.
Electron photon -.-
e-.. e :,(
‘:è
\•.
e’-8-.e
PositronPhOtOfl0.51 meV gamma photonf Eiectron Incident ve gammasr\/_ - -. photon -
-
- -- -. ;e
_•—e—.. ‘•.:.
: ;I (a) ‘t-
g.photon photonJQ•)
è
..
e-8-.e
,.;‘ (e) (il)Figure 7: Four effects of attenuation. ta) Photoelectric effect. (b) Compton scattering. (c) Coherent scattering. (d) Pair production LABO5J.
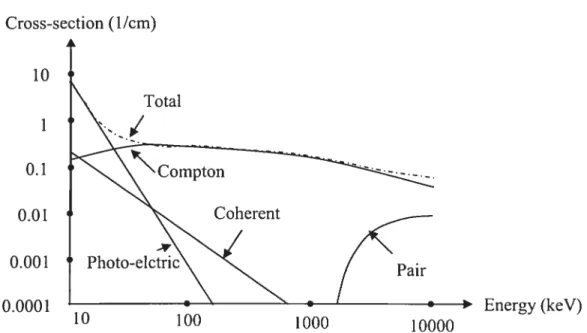
‘4 Cross-section (17cm) 10 0.1 0.01 0.001 0.0001 Energy (keV)
Figure 8: Differential cross-section for the photo-electric effect, Compton scattering, coherent scattering and pair production and total cross-section for water as a function of photon energv
ISanO3].
Each of those effects, as mentioned, has a probably of occtirrence which strongly depends on the photon energy and the property of materiat. f igure $ shows the attenuation cross-section with respect to the photon energy. Due to low energy gamma photons uscd in SPECT, typically 100-300 keV, and to the fact that the human body is mainly made of water, photons experience more Compton scattering than the photoelectric interaction. The attentiation in SPECT is thus the main resuit of Compton scattering.
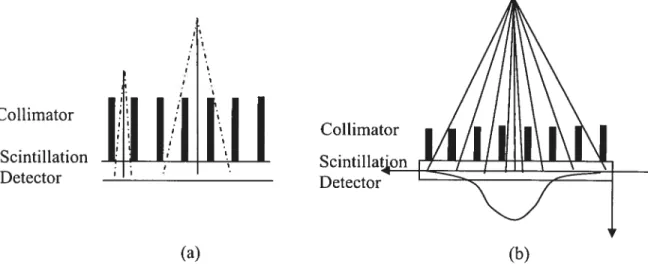
The collirnator is a crucial component ofthe gamma camera, because collimation has the greatest effect on determining SPECT system spatial resolution and sensitivity, which are the main quaÏity parameters of SPECT imaging system. Spatial resolution denotes the ability ofthe equipment to reproduce fine details, while sensitivity relates to the fraction of incident photons that is actually recorded by the imaging system. Resolution of a collimator is inversely related to its sensitivity. The resolution in Nuclear Medicine is usually expressed as the “fuII-width-at-half-maximum” (FWHM) amplitude. When a collimator bas longer holes with a srnaller diameter, it bas better spatiaL resolution because the angle of acceptance is smaller and more scatter is rejected, while
Total
its sensitivity is lower because fewer photons reach the scintillation detector. Figure 9(a) shows this feature. The coltimator in Fig. 9(b) has opposite properties, higher sensitivity and lower resolution, because it bas shorter holes with a wider diameter. Due to this characteristic, the design of a gamma camera for general purpose is a compromise between resolution and sensitivity. In other words, SPECT images are aiways bÏurred by the finite size and length of the collimator bores.
In addition to the effect of collimation, SPECT image resolution is also restrained by scintillation detector’s response (the intrinsic resotution), and the distance of object to collimator. The intrinsic resolution varies with different manufacturers. The typical value of intrinsic resolution is between 3-5 mm (FWHM). In generat, system resoltition falls about I mm for each additional centimeter increased ofa patient position from the face of a parallel-hole collimator. In Nuclear Medicine, resolution defines the degree of blurring along the boundaries between different regions of the image. The major factor limiting the resolution in SPECT is therefore the collirnator-detector response blurring.
Besides collimation effect and the detector response blurring, detection sensitivity and the spatial resolution are also influenced by the dose of the agent used, the image voxel size, the number of projections, the acquisition time, and filtering process [CatOl]. R R R R
IiI I /1 [ I I
Scintillation[ I I
J
I
Detector t (a) Coïlimator Detector (b)Figure 9: (a) Lower sensitivity and higher resolution collimator. (b) Higher sensitivity and lower resolution collimator.
16
Because the collimation blurring and the detector’s intrinsic transforni function are the two independent blurring sotirces, they can be analyzed as two sub-systems in series [MD79]. When the phenomenon of scattering is absent, the point spread flinction (PSF) for parallel-hole collirnators is typically approximated as a Gaussian function [BB73] [GTMPB$8]. The detector PSF depends on the precision ofthe positioning-logic circuits, and is usually modeled by a Gaussian function too.
The hypothesis that the PSF has Gaussian distributions for Fan-beam (diverging) collimator is confirmed by Pareto et aï. [PPFJCRO1]. Gaussian function is also used to simulate the intrinsic response ofthe detector for fan-beam collimator [f1G98].
Noise is the superposition of many factors, including photoelectric noise, electronic thermal noise, transmission noise and quantization noise. Since the detection of photons in SPECT is a Poisson process and the detection probability is veiy low, around iO, measures of the projections include Poisson noise [SanO3]. Without attenuation correction, noise in SPECT is characterized by Poisson function. However, after application of the attenuation correction algorithrn, the (slightly stronger) noise has a distribution similar to a Gaussian [AF99].
Some degradation is reduced or corrected by SPECI imaging design itself or image reconstruction procedure. For example, Compton scattering, can be reduced by using detectors with good energy resolution, which can distinguish the scattered photons from the original incident gamma photons. During the reconstruction, special mathematic algorithms, such as uniform atgorithms, can compensate most attenuation
effect. The present commercial SPECT systems frequently use the filtered
backprojection reconstruction algorithm to process the acquired data for producing final images. Because the filtered backprojection algorithm cannot deal with photon interaction or detector characteristics, resolution degraded by the imaging process cannot be recovered by the reconstruction process. Although multi-detector system has been designed, which results in relative high spatial resolution and rapid imaging of the object, the typical spatial resolution of SPECT brain perfusion images can only achieve around 10 mm FWHM in the plane ofthe suce.
Thus, two problems, blurring and noise in the observed SPECT images, are commonly experienced in the context of image restoration for medical image processing.
1.3
Image restorafion techniques overvïew
Attering acquisition and reconstruction strategies to account for a source of degradation is costly in tertns of processing time, added complexity in imaging and processing, and I or enhancement other sources of degradation [KinO3]. As a resuit, actual SPECT images in clinic are usually noisy and have low contrast and spatial resolution when compared to those acquired with other imaging modalities. The objective of restoration is thus to recover as rnuch information abotit the object being imaged from the degraded reconstnicted image by modeling the imaging system and noise.
Image restoration is a field of digital image processing that attempts to reduce the effects of the PSF blutring and to remove the noise as rnuch as possible. In other words, image restoration intends to achieve an improved image that is as close as possible to the real scene. Thus restoration techniques usually focus on modeling the degradation of imaging system, implernenting the inverse process, and fonnulating a criterion to yield an optimal resuit. It should not be confused with another image improvement technique — enhancernent, in which the chosen features are made more
visible for further detection. Image restoration techniques share the sarne objective with image reconstruction processing and try to solve the same mathematical problem. However restoration is based on a full image, while reconstruction operates on a set of projection data.
A variety of restoration techniques have been developed, and also it exists a number of ways in classifying them. We classify these rnethods into two categories, restoration with a priori information and blind deconvolution without or with partial a
priori information.
in the first category, we continue to classify them into linear restoration and non linear restoration methods. With linear methods, imaging system is modeled as a linear
18 shift-invariant system, which is a common mode! used in medical imaging systems. In other words, the degraded image is the convolution of the ideal image with the PSF of the system, plus superposition of additive noise. In non linear algebraic rnethods, the non Iinearity is introduced by either a nonlinear image formation and recording system mode!, or a !inear shift-invariant system model with some constraints that produce non linearity, e.g. non-negativity constraint — an image is formed aiways of positive
intensities. This constraint is aiways tnie since the image is gcnerated by the transport of radiant energy. Non linear properties may also corne from the formulation of the restoration problem, for examp!e, the use of complex optirnization criteria.
Since there are multiple different restoration algorithms, we only introduce those methods that are the basis for others. For linear a!gebraic approach, a large class of restoration filters is derived based on least-squares criterion ftrnctions, considering either unconstrained or constrained approaches, which include inverse filtering, constrained !east—square filter, Wiener fi!ter, Tichonov-Miller, and maximum entropy method. For nonlinear approach, there are Van-Cittert, Landweber with positivity constrain, conjugate gradients forrn of Tichonov-Mi!ler and stochastic (random) rnethods that ernp!oy maximum !ikelihood estimation and expectation-maximization a!gorithm.
Linear restoratïons
The linear shift-invariant system model in the spatial domain assumes that the observed image, reprcsented as a stacked vector g and resulting from the imaging system, is equa! to the product of a point spread function matrix H and the tme image vector f, plus the noise vector n (see section 2.2).
Inverse ifitering is an unconstrained linear restoration approach using !east square criterion, which assumes that the norrn of the noise is as srna!! as possible. In other words, it finds the estimate that minimizes the norm of the difference between the measured image g and the b!urred estimate Hi It is one of the simp!est deconvolution methods. However, this method cannot tolerate any noise. In reality, noise is ampÏified due to the fact that the spectral properties of the noise are not taken
into account. As a consequence, this solution may flot be irnplemented in practical applications where the data term is aiways affected by noise. The key problem of inverse filtering is that it treats both image structure and noise equally because it cannot distinguish them.
In mathematical terms, the restoration problem is ill-posed or ill-conditioned, that is, the problem cannot be uniquely solved. Small changes in the data can cause arbitrarily large changes in the resuits. In addition, the goals of image restoration, removing noise and deblurring (increasing contrast and resolution), are in conflict, because blur caused by any source is actually a form of bandwidth reduction of the image due to the image formation process, so a high-pass fitter is needed to undo this part. On the other hand, noise is also composed of high frequencies, so a low-pass fitter shoutd be chosen to remove it. The ill-posed nature of restoration leads to more than one solution for the same system. Regtilarization methods are usually applied to solve ill posed problems.
Regularization methods use a prioii information for restoring degraded images. Ihe key characteristic of regularization is a trade-off concept, that is, the choice of the penalty term, which balances between fidelity to measurements and to ci priori information. Depending on the type of prior knowledge, there will be different mathematical expressions serving as a penalty term.
Constrained least-squares filter is a deterministic regularization method, which uses deterministic prior information about the original image. It is much more effective than the simple inverse filter. Hunt proposed this method that minimizes sorne linear operator on the object
QÎ
with some other conditions, for instance, the norm of the noise signal [Hunt 73j. Using the method of Lagrange multipliers, the constrained teast square problem becomes to seek an estimate to minimize +a(g —Hif — 2)
wherethe parameter a is often obtained by an iterative method.
Wiener filter is a special case of constrained least-squares filters. from the viewpoint of implementation, Wiener filter is one of stochastic regularization approaches [BK97], which tries to minimize the mean square error between the original
20 image and the estirnate subject to knowledge of signal and noise covariance matrices, Rf
and R, so it is also called least-mean-square filter. Here, the linear operator is chosen to be equal to (Rf)”2(R)”2. The Fourier version of the Wiener filter can be very effective when the frequency characteristics of the image and additive noise are known (at least to some degree), and under the assumptions that both signal and noise covariance are stationary and independent. The Wiener filter is by far the most common deblurring technique used because it rnathematically retums the best resuits and takes the shortest computational time to find a solution. The detail derivation of Wiener filter wiIl be presentcd in Chapter 2.
The Tikhonov-Miller [Mi170J [PTVF92I restoration is linear and non-iterative in its original form. The method is based on a rnean-square-error criterion and an energy bound that is the regularization pararneter, the ratio of the noise power to the object power. Due to this botind, those spectral components outside the bandwidth of the PSF in the estimate
Î
will be suppressed. The solution may include negative values.Introducing an appropriate cost function, such as entropy, is another way of regutarization. The maximum-entropy method introduced by Jaynes in 1968 [Jay6s] and frieden in 1972 {Fri72] are widely used for astronomical image restoration. The principle of maximum entropy is a method for analyzing the available infonnation in order to determine a unique epistemic probability distribution [WikO5]. If the object fis normaflzed to unit energy, then each
f
scalar value can be interpreted as a probability. Using constrained least-squares approaches, the maximurn-entropy filter tries to minimize the negative of the entropy f’ lnf subject to the constraint that is11g
—111112 =1111112 [AH77]. Maximum entropy helps suppress artificial oscillations but issensitive to noise and slow when compared with other methods. Non ]inear restoration
For non-linear methods, the results nonnally cannot be obtained by an analytical form. Instead, an iterative procedure is employed.
Van Cittert iterative deconvolution [Cit3l], known as basic iterative deconvolution (BlD), is based on the linear degrading system. In this technique, just like other iterative methods, the first step is to set the initial estimate to the measured image g. The basic idea ofthis algorithm is that if this first estimate fi is correct, the difference
ofthe measured image and the output g that is the resuit ofblurring the first estimate f with the PSF, g - gj, should 5e zero. If not, the correction might be made based on this
difference. Ibis algorithm is repeated until the error is below a threshold, or the update is no longer significant. Because this algorithm does not put any restraints on the fidelity to prior knowïedge, it might resuit in severe noise amplification.
Iterative Tikhonov—MiIIer method is a modification of the analyticat Tikhonov— Miller form. It adds an extra non-linear element property, positivity. Because the Tikhonov—MiÏler method includes a penalty term, it can thus effectively control noise amplification.
Many methods try to find the optimal value of the penalty terni based on Tikhonov’s regularization. For instance, the Conjugate Gradient Least-Square methods [HH94] use the number of iterations as a regularization pararneter for the Tikhonov equation with no other regularization tenn.
Stochastic approaches are also used for image restoration. They are particularly effective when the blur function and the signal and noise power spectra can flot be obtained. In stochastic approaches, the original image is assumed to be a realization of a random field, usually Gaussian or Markov. Maximum LikeÏihood (ML) and Maximum a
Posteriori(MAP) approaches are specific types ofstochastic methods.
Richardson [Fri72] and Lucy [Luc74] proposed the well-known Lucy
Richardson algorithrn, which is derived from the maximum likelihood expression for a non linear system (with Poisson noise) through an iterative method. Lucy uses a correction terrn based on the ratio between the observed image and the estimate. A first
guess must be specified, a constant for example, to start the iteration. This method is effective when the PSF and a littie information about noise are known. However, this technique has a common problem just like other maximum likelihood methods, noise amplification, because it attempts to fit data as closely as possible.
22 A similar technique was proposed by Hunt in 1977 in which Maximum a
Posteriori probability method was applied. The MAP solution differs from the ML
solution solely because of the a priori information. The MAP estimate and the Wiener
fiher estimate in linear systems are the same on Gaussian densities [AH77]. The MAP problem is solved by the steepest descent method. An initial guess in MAP is usually made from a Wiener filter used as a linear approximation.
in the second category, blind deconvolution, both the true image and the PSF are estimated through an iterative approach using partial information about the imaging system. There are two main approaches to blind deconvolution of images, identifying the PSf separately from the estimation ofthe true image and simultaneously estimating the PSF and the truc image [KH96]. Kundur et al. listed five blind deconvolution methods: a priori blur identification methods that fail into the first approach, Zero Sheet Separation rnethods, ARMA (Auto-Regressive Moving Average) Parameter Estimation
methods, Nonparametric Deteministic Image Constrains Restoration and
Nonparametric methods based on high order statistics that fail into the second approach. An iterative approach has an advantage — an additionat regularization obtained
by ending iteration before convergence. On the other hand, iterative image restoration algorithrns usually need a good estimate. for this purpose, the observed image is chosen for the first estimate. This is an obvious and frequently used way. However, when noise is present in the measured image, it may hamper the convergence ofthe algorithm.
In our work, we propose an adaptive Wiener filter, a new approach based on the Wiener filter, for improving SPECT images. Our approach overcornes the limitation of the Wiener filter and keeps its simplicity, stability, ability to remove noise, and efficiency of increasing contrast and resolution.
1.4
DICOM standard
In the medical imaging society, the DICOM standard is commonly used for the transmission and storage ofdigitat medical images from the rnost common modalities in hospitals and clinics, such as SPECT and MRI. The standard was developed by the joint
committee of the American College of Radiology (ACR) and the National Electrical Manufacturers Association (NEMA) founded in 1983. The entire DICOM [DICOMO4] standard consists of 18 parts. Image format is only one ofseveral issues and is addressed in Part 10 ofthe standard. By convention, image files that are compliant with Part 10 of the DICOM standard are referred to as DICOM format file.
Unlike other medical image formats, a single DICOM file contains both head and image data. Using MRIcro [RorO4] software package, the DICOM files can be easily converted to other image formats applied frequently for medical image processing, such as the Analyze format that includes two separated components, header (.hdr) and image (.img) files.
The raw data we processed for this study are the DICOM format images.
1.5
Content of the rest of this thesis
We have reviewed the history of SPECT imaging, its application in clinic. degrading factors in SPECT imaging systems, different restoration rnethods that cari improve degradation, and the DICOM standard for digital medical images. In Chapter 2, we wiII first derive Wiener filter mathernatically, then we propose our adaptive Wiener filter. The third chapter describes the methodologies of the additive Wiener filter for restoration of SPECT images. Chapter 4 presents the experimental resuits on both Hoffman phantom and real SPECT images. The thesis is ended by the conclusion in the Iast chapter.
24
Chapter 2
Adaptive Wiener Filtering
2.1
Introduction
In chapter 1, many common linear and non linear image restoration appro aches were reviewed. Among them, the Wiener filtering is the most common linear restoration technique due to its simplicity, capability of being computed in a straightforward and economical way and tolerance to noise.
The well-known Wiener filter is a global filter that is optimal in the sense that it minimizes the mean square eiior between the original image and the estimate. However, when we apply the Wiener fiher to restore degradcd images, o priori information, such as the PSf and the power spectra of the original image and noise, are needed. Unfortunately, these information are normaÏly unknown.
In this work, we propose an iterative Wiener filter to overcome these limitations. Since we work in biomedical imaging, we assume that for the same patient, a higher resolution image (an anatomic image, such as, a MRI scan that uses magnets and radio waves and provides much higher details in the soft tissues, or a CT scan that uses x-ray and gives a good information of the bone structures) is acquired in addition to the SPECT image. We use this higher resolution MRI (or CI) volume with a set of image processing as our reference image to approximate the real scene — the “non-degraded
SPECT image” that in fact neyer existed. Then the PSf and the power spectrum of noise are iteratively estimated based on a Gaussian PSF and Additive White Gaussian Noise (AWGN), as well as a criterion of image goodness — the contrast-mottle criterion.
In the following sections, we shall first formulate the restoration problem, then introduce the Wiener filtering algorithm, and finally present our adaptive method based on the Wiener filter.
2.2
Restoratïon problem formulation
Before formulating the restoration problem, we have to define the degradation model for SPECT imaging. This degrading system is assumed to be a [inear shift invariant system with additive noise [MM00], which is a common modet used for most medical imaging systems. Although living systems are flot linear, vie can linearize them based on some reasonable assumptions, because such linear mode! will then allow us the luxury of borrowing from the field of linear systems theory, Fourier analysis, linear algebra, nurnerical analysis, and rnany other disciplines for dues as to useful inversion technique [AH77]. The focus of this thesis is image restoration hence the system linearization will flot be further discussed.
We start modeling a two dimensional imaging system. An imaging system is usualty an image degradation process consisting ofthe input, the system, and the output, shown in fig. 10.
A mathematica! formula ofthis system may be expressed by:
g(x,y) = —k,y—t)f(k,Ï)+n(x,v) = j(x,v) h(x,v) +n(x,y) (2.1)
Â=I /I
where J(x, y) andg(x, y) represent an original and degraded MX N images respectively,
h(x, y) is the blur operator, also called the point spread function, and n(x, y) denotes additive noise introduced by the imaging system. indicates two-dimensional convolution. Here we assume the imagej(x, y) and the function h(x, y) are periodic both
/(x. y)
n(x,v)
y)
26 in x and y directions with periods M and N, respectively. The resulting image g(x, y) is
also periodic with the same periods asJ(x, y)and h(x, u).
Early classical techniques derive the Wiener filter from frequency-domain concepts. In this work, we introduce the algebraic approach derived by Gonzalez and Wintz [GW$7] that allows us to compare the Wiener filtering with other restoration techniques. Therefore, we represent Eq. (2.1) in terrns of a matrix-vector formulation, which is given by g = Hf + n (2.2) 1(0,0) j(0,N—1) f(l,0) f(l,N—l) [(M —1,0) J(M —1, N—1) n(0,0) n(0,N—l) ii(I,0) ii(1, N—1) n(IVI —1,0) i;(A’I —1,N—1)
where g, f, and n have the same rneanings as for Eq. (2. 1) except for the vector formulation. These vectors have MN (it means MxN) dimensions obtained by stacking the rows (one can stack the columns too) of each of functions,J(x,y), g(x, y) and n(x, y).
The matrix H is MN x Pv[Nrepresenting a superposition of blur operator and bas special properties. These special properties are desirable for representing linear shifi-invariant system and lead to the following special matrix structure:
gr g(O,O) g(0,N—1) g(l,0) g(1,N-1) g(M —1,0) g(M —1, N —1) f= n=
H 11 — H —2
= II H H — H,
11M—I 11M—2 11M—3 “O MNxMN
(2.4)
where H is called a MNX MN block-circulant matrix with M X M blocks and each sub matrix H is itself a circulant NXN matrix. It is formed from the i-th row of the array h(x,y) as follows:
h(i,O) h(i, N—1) h(i, N—2) h(i,1)
H = h(i,1) h(i,O) h(i, N
—1) ... Jz(i,2)
h(i,N—l) h(i,N—2) h(i,N—3) h(i,O)
(25)
where the array Ïi(x,v) is the blurring ftmction. The matrix H has the circulant property because of the assurned periodicity ofh(x,v).
According to the degradation model, it is clear that the goal of restoration is to solve the inverse problem of Equation (2. 1) or (2.2), in other words, to find the inverse transformation such that the original image can be recovered from the measured data:
f =H(g—n)
(2.6) The inverse transformation W’ should exist and be unique, and noise characteristic should be known. If these conditions were satisfied in most applications, the restoration problem would not be a critical issue in image processing. However, the real word is aiways not the one we desire. For the situation where there is no inverse transforniation (singular), which is flot unusual, the restoration problem has no solution. Even ifH’ exists, it may be ill-posed. Hadamard first introduced the definition of iiI posedness in the field of partial differential equations [Had23]. A problem is welI-posed when a solution exists, is unique and depends continuously on the initial data. It is iii posed when it fails to satisfy at least one of these criteria. Andrews concluded that image
28 restoration is an ill-posed or ill-conditioned problem at best and a singular problem at worst [AH77].
Therefore, in the best case, there is usually no unique solution for restoration problem in view of noise and ill-conditioning. We thus use some prior knowledge to make an ill-posed problem welt-posed, so the class of admissible solutions can be restricted. We will discuss them in the next subsection. It is important to keep in mmd that the resuits for restoration problems are usually obtained in the optimal sense.
Notice that, even if the inverse transformation W1 exists and is unique, and n is known, directly computing W’ would be time consuming. For example, if we suppose M
= N= 512, MN= 262,144 and H would be a 262,144 by 262,144 matrix to be inverted.
Fortunately, the complexity of this problem can be reduced considerably by taking advantage ofthe circulant properties of H {GW87].
Since H is a block-circulant matrix, we can solve Equation 2.2 in a feasible way, by diagonalizing H.
If H is a block-circulant matrix, according to [Hun73] we can write H as:
H = EDE’ (with EE1 = E1E = 1) (2.7)
or D = E1HE (2.8)
where D is a diagonal matrix whose elements D(k, k) are related to the discrete Fourier transform ofh(x,y).
Multiplying both sides ofEq. (2.2) by E’, and applying Eq (2.7), we get: E1g=DE’f+En
(2.9) The product E’g is anMNx1 vector, containing the stacked rows ofthe two dimensional discrete Fourier transform matrix G(tt, y) ofg(x,y). It is the same for the vectors E’f and E’n.
Now the restoration problem becomes solving the followïng equation in the frequency domain, which avoids the calculation ofthe inverse matrix W’. Eq. (2.9) can be written as:
G(u,y) JI(u,v)F(it,y)+ N(u,y)
(2.10)
In the following subsections, we shah introduce sorne criteria to obtain the solution for Eq. (2.10), the restoration problem.
2.3
Wiener filter
2.3.1 Introduction
The main technique used in order to transform the ill-posed problem into a well posed one is the so-called “regularization procedure” [Mi170]. They usually use some a
priori information for the derivation of a solution. The Least-squares criterion is one of
those techniques that will give a unique solution and possesses simplicity. Two approaches, unconstrained and constrained, could be considered to solve the least squares restoration problem. We derive these two approaches using GonzaÏez and Wintz formulation [GW87].
2.3.2 Inverse filter — Ieast-squares unconstrained restoration
We will first introduce the solution for unconstrained restoration problems. This rnethod will lead to the inverse filtering, which is not our goal but has some important relation with Wiener filtering.
We can rewrite Eq. (2.2) to express the noise term:
n=g—Hf
(2.11) The unconstrained criterion here is to find the estimate of the original f to minimize
fig
—
in a least-sqtiare sense under the assumption that the norm ofthe noise term is as srnahl as possible. This problem can be therefore expressed by minimizing the criterion function:
J(Î)=
g—HÎwith respect to
Î,
where,—
HÎ[
= (g— —
IIÎ),
the square norm of (g—HÎ).It is noted that
Î
is flot constrained by other requirernents except that it is required to minimize Eq. (2.12).Minirnization of Eq. (2.12) is obtained by differentiating the function J with respect to
Î.
By setting the resuit to zero we get the following equation:Î
=(HTH)HTg= H(H’’HTg = H’g(2.13) Replacing W1 in the above equation by Eq. (2.7), we have:
Î
=(EDE’)g = fD’E’g(2.14) Multiplying both sides of Equation (2.14) by E’ as we did previously, yields:
f’Î
= D’E’g(2.15)
Using notations in the frequency domain, the above equation is expressed by:
G(tt,v) F(u,v) =
H(tt,v)
(2.16) which is refereed to as the inverse filter method.
2.3.3 Wicner tï]ter least-squares constrained restoration
In constrained image restoration, we wiIl flrst define a matrix
Q
with appropriate dimension and then choose an estirnateÎ
to minirnizeQÎ[,
subject to the constraint—
HÎ[
= In other words, we seek an
Î
that minirnizes the following criterionfunction:
J(Î)
=NQÎN2
+ag—HÎN2
—InI2
(2.17) where a is a constant called the Lagrange multiplier.
Minirnization is carried out by differentiating Eq. (2.17) with respect to
Î
and setting the resuit equal to zero:ai =2QTQÎ_2aHT(g_Hî)=o
(2.18) We obtain the solution for the general constrained restoration probtem by soïving (Eq. 2.1$) for
L
This is givenby:î=(HTH+)QTQ)HTg
(2.19) where y = lia is chosen to satisfy the constraint —Hî[
=
IIII2•
Wiener lias derived an optimal solution based on the statistic of the image and noise features, mean and correlation. 1f each element of f and n is considered as a random variable, we can define two cotTelation matrices:
E(JJ)
E(JJ)R1 =E(ff
)=
. : (2.20)
E(L) •.. E(ftl\If!vI)
E(n0n0) E(n0n1) E(n0ii11_1)
E(n1;i) E(n1 ‘)
. E(n!l1.1N._1)
R=E(nn)= ..
(2.21)
E(nAJN-1n0) E(n1_nMN_I)
where Et.) denotes the expected value operation. Since the elements of f and n are reat,
E(f,j)
=
E(f1f) and E(n,n,)=
E(nn) , the matrices Rf and R are real andsymmetric with alI non-negative eigenvalues. Andrews and Hunt showed that R and R can be made to approximate block-circulant matrices and can be diagonalized by the matrix E [AH77]. It leads to the Fourier transform ofthe correlations, Rf and R ,which
32
= EAE’ and R EBE (2.22)
We can easily get the transpose of H from Eq. (2. 7), given by:
HT =EDE’ (2.23)
where D* is the complex conjugate of the matrix D. Choosing matrix
Q
such thatQTQ
= using Eqs. (2.7), (2.22) and (2.23), and rnultiplying Eq. 2.19 by E1,after some matrix manipulations we have:
= (D*n+
yA’B)’ D*Elg
(2.24) where the elements of A and B are the Fourier transforms of the elements in Rf and R, respectively. As we have rnentioned, these terms are the power spectra of signal and noise and will be denoted by P, (u,v) and J-jzt,v) , respectively.
Choosing y= 1, we get the following equation in the frequency domain:
II*(ttv)
f(u y) = G(u,v)
I
II(u,y) +F,(ti, y)/P, (u,y)= I
I
H(ti,y) 2G(tt y) = H,,. (u, v)G(u,y)
H(tt,v) H(u,v) 12 +z(u,v)/Pr(u,v)
(2.25)
for u and y = 0, 1, ..., M-1 (M = N). The Wiener filter is given by the term within bracket:
H (u,v) = H(tt,y) 2 (2.26)
H(u,v) H(tt,v) 12 +1(u,v)/P1(u,v)
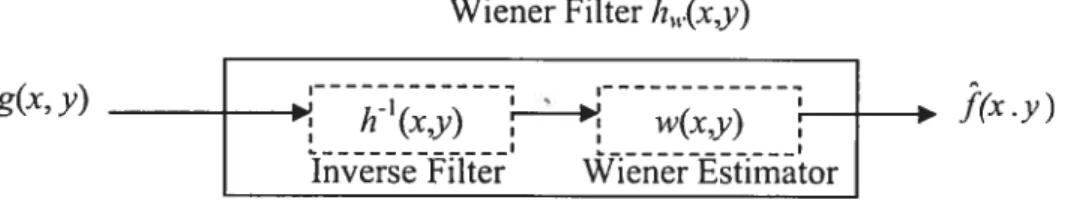
From the above equation, we can see that the Wiener filter consists of two parts, the inverse filter and the Wiener estimator as shown in Fig. 11.
Wiener Filter h11(x,y)
g(x,y)
Fӕ
J
Inverse Filter Wiener Estimaor
Figure 11: The block diagram of the Wiener luter.
It is noted that the derivation of the Wiener filter is based on a statistical model of the image in which the rneasured image is a single realization of a random field. The resuit obtained by using the Wiener filter is thus optimal in an average sense.
Equation(2.26) can be easily extended to three dimensions:
II*(u,e, w) H (u,y,w) =
I
H(u,e, w) 12 +J (ti,y,w)/P, (tt,e, w)(2.27)
Hence, using the Wiener filter, one can estirnate the original image under the assumption that we have ci priori information such as the PSF of the imaging system and the power
spectra ofthe original image and noise are known.
2.4
Adaptive Wïener filter
2.4.1 Limitations ofthe Wiener filter
The needed conditions to apply the Wiener filter is that the PSf of the imaging system and the power spectra of the signal and the noise are known. However, this is flot the case in practical use. In this work, therefore, we propose an adaptive Wiener filter that uses a reference image as the original image and estimates the PSf and the power spectra of noise according to an image contrast-mottle criterion.
Metabolic SPECT and anatomie MRI brain images contain complernentary information necessary to interpret brain function and pathology. SPECT images can offer physiologie information such as cerebral blood flow, cerebral oxygen utilization, local glucose metabolism and local protein synthesis, but with lower spatial resoÎution, while MRI scans provide good soft tissue discrimination and higher spatial resolution. In clinical application, patients often receive both MRI and SPECT scans.