HAL Id: pastel-00985466
https://pastel.archives-ouvertes.fr/pastel-00985466
Submitted on 29 Apr 2014HAL is a multi-disciplinary open access archive for the deposit and dissemination of sci-entific research documents, whether they are pub-lished or not. The documents may come from teaching and research institutions in France or abroad, or from public or private research centers.
L’archive ouverte pluridisciplinaire HAL, est destinée au dépôt et à la diffusion de documents scientifiques de niveau recherche, publiés ou non, émanant des établissements d’enseignement et de recherche français ou étrangers, des laboratoires publics ou privés.
Hydro-mechanical behaviour of bentonite-sand mixture
used as sealing materials in radioactive waste disposal
galleries
Simona Saba
To cite this version:
Simona Saba. Hydro-mechanical behaviour of bentonite-sand mixture used as sealing materials in ra-dioactive waste disposal galleries. Other. Université Paris-Est, 2013. English. �NNT : 2013PEST1140�. �pastel-00985466�
Thèse présentée pour obtenir le grade de
Docteur de l’Université Paris-Est
Spécialité : Géotechnique
par
Simona Saba
Ecole Doctorale : SCIENCES,INGENIERIE ET ENVIRONNEMENT
Comportement hydromécanique différé des barrières
ouvragées argileuses gonflantes
JURY
Tom Schanz Rapporteur
Enrique Romero Rapporteur
Gioacchino Viggiani Examinateur
Anh Minh Tang Examinateur
Jean-Dominique Barnichon Examinateur
Pierre Delage Invité
Nicolas Lenoir Invité
Dissertation presented for the degree of
Doctor of Paris-Est University
Specialty : Geotechnics
by
Simona Saba
Doctoral school: SCIENCE,ENGINEERING AND ENVIRONMENT
Hydro-mechanical behaviour of bentonite-sand
mixture used as sealing materials in radioactive waste
disposal galleries
REVIEWERS
Tom Schanz Enrique Romero Gioacchino Viggiani
Anh Minh Tang Jean-Dominique Barnichon
Pierre Delage Nicolas Lenoir
" $ ' " ! ( ) !! * + , - . & ' & & / 01 ( 1 0 - 2 # ' ! ! # ! ! ' " ! ! $ ! ! 3 ' " ' 4 . # + 5 .+ 6 ' $ 7+ 8 # 3 9 & # ' ! 7+ 8 # 3 9* # ' $ $ ! # & " " ! ' & * & ! ' # ! 7( . +9 & " # ! ! & ' ' , ! ! * $ * * ' $ ! " : & # 0 " & ! 0 ' * # #( 2 # . + ( 7 & ( ; 9 " " ! 3 "' 7 9 ! # ! * & ' * ! " ! ! ' " ! < / : ! * & ! ! '
Le travail de thèse ici présenté a été effectué au sein de l’Equipe
Géotechnique (CERMES) du Laboratoire Navier à l’Ecole des
Ponts ParisTech. Il a été financé par l’Institut de Radioprotection
et de Sûreté Nucléaire (IRSN).
The presented PhD work was carried out in the Geotechnical
division (CERMES) of “Laboratoire Navier” at “Ecole des Ponts
ParisTech”. It was financed by the French Institute for Radiation
Protection and Nuclear Safety (IRSN).
Dans le but de vérifier l’efficacité des dispositifs de scellement ou des barrières ouvragées dans le stockage géologique des déchets radioactifs, l’Institut de Radioprotection et de Sûreté Nucléaire (IRSN) a mis en œuvre le projet expérimental SEALEX (SEALing performance EXperiments) auquel ce travail est étroitement lié. Dans le cadre de ce projet, des essais in-situ sont effectués à l’échelle représentative et dans des conditions naturelles sur un mélange compacté de bentonite et de sable. Ce matériau de mélange a été choisi pour sa faible perméabilité et surtout pour sa capacité de gonflement qui permet de colmater les vides existant dans le système, notamment le vide technologique correspondant au vide radial entre le noyau de scellement et la roche hôte et qui est inévitable au cours de l’installation du noyau dans le forage. Une fois les vides scellés, le gonflement à volume constant engendre une pression de gonflement aussi bien sur la roche hôte (radiale) que sur les structures de confinement en béton (axiale). Le comportement de ce matériau dans ces conditions de couplages hydromécaniques est alors étudié dans ce travail. La microstructure du matériau à son état initial a été premièrement examinée par micro-tomographie rayons-X. Ceci a permis de caractériser la distribution des grains de bentonite et de sable ainsi que le réseau de pores dans l’échantillon. Des macro-pores se sont retrouvés concentrés à la périphérie de l’échantillon ainsi qu’entre les grains de sable, ce qui pourra affecter à court terme la perméabilité. L’hydratation du même matériau en condition de gonflement limité a été ensuite observée par photographie 2D et par micro-tomographie aux rayons-X. Le mécanisme de gonflement par production de gel de bentonite, la cinétique de gonflement, la diminution de densité et l’homogénéisation du matériau final ont été analysés. L’hydratation en conditions de gonflement empêché a été aussi étudiée par des essais où la pression de gonflement a été mesurée dans deux directions : radialement et axialement. La différence retrouvée entre les pressions de gonflement axiales et radiales indique la présence d’une anisotropie de microstructure qui a été analysée en fonction de la masse volumique sèche de bentonite dans le mélange. Des essais en modèle réduit reproduisant à une échelle 1/10ème les essais in situ (SEALEX) ont été également effectués afin d’étudier le comportement du noyau compacté après rupture des structures de confinement. Des mesures locales de pression de gonflement le long des échantillons ont permis de mettre en évidence l’évolution du gradient de densité durant le gonflement axial. Finalement une comparaison entre les résultats obtenus dans ce travail et ceux d’un essai in situ (SEALEX) a été faite. Une bonne correspondance entre les valeurs d’humidités relatives a été retrouvée pour les mêmes longueurs d’hydratation tout en prenant en compte la saturation par le vide technologique radial. Un facteur de temps égal à 100 a été retrouvé en comparant les pressions de gonflement entre les essais à échelle réduite (1/10) et les essais in situ.
Mots clés : Mélange bentonite/sable ; stockage des déchets radioactifs ; gonflement ; microstructure ; anisotropie ; essais à échelle réduite ; comportement hydromécanique.
In order to verify the effectiveness of the geological high-level radioactive waste disposal, the French Institute for Radiation protection and Nuclear Safety (IRSN) has implemented the SEALEX project to control the long-term performance of swelling clay-based sealing systems, and to which this work is closely related. Within this project, In-situ tests are carried out on compacted bentonite-sand mixture in natural conditions and in a representative scale. This material is one of the most appropriate sealing materials because of its low permeability and good swelling capacity. Once installed, this material will be hydrated by water from the host-rock and start swelling to close all gaps in the system, in particular the internal pores, rock fractures and technological voids. Afterwards, swelling pressure will develop. In the present work, laboratory experiments were performed to investigate the sealing properties under these complex hydro-mechanical conditions taking into consideration the effect of technological voids. The microstructure of the material in its initial state was first examined by microfocus X-ray computed tomography (µCT). This allowed identification of the distribution of grains of sand and bentonite as well as the pores in the sample. Macro-pores are found concentrated at the periphery of the sample and between the grains of sand, which could affect in the short term the permeability. The hydration of the same material in limited swelling conditions was then observed by 2D photography and 3D µ CT. The swelling mechanism with bentonite gel production, the swelling kinetics, the density decrease and the homogenisation of the material were analyzed. The hydration in the conditions of prevented swelling was also studied by swelling pressure tests with radial and axial measurements of swelling pressure. The difference found between the axial and radial swelling pressures suggested the presence of an anisotropic microstructure. Mock-up tests at a 1/10 scale of the in situ SEALEX tests were carried out for the study of the recovery capacity of the mixture in case of the failure of the confining structures. Local measurements of swelling pressures along the sample allowed analysis of the density gradient evolution during axial swelling. Finally, a comparison between the laboratory results and those from an in-situ test was done, showing a good fitting in the relative humidity curves for the same infiltration length while considering the saturation effect from the technological void. The swelling pressure comparison resulted in a time factor of 100 between the laboratory (1/10) and in situ tests. Keywords: Bentonite/sand mixture; radioactive waste disposal; microstructure; swelling; anisotropy; mock-up tests; hydro-mechanical behaviour.
Journal Papers
1. Saba, S., Delage, P., Cui, Y.J, Tang, A.M., Lenoir, N. and Barnichon, J.D. 2014. Further insight into the microstructure of compacted bentonite/sand mixture. Engineering Geology Volume 168, Pages 141–148.
2. Saba, S., Barnichon, J.D., Cui, Y.J., Tang, A.M. and Delage, P. 2013. Microstructure and anisotropic swelling behaviour of compacted bentonite/sand mixture. Accepted to be published in Journal of Rock Mechanics and Geotechnical Engineering.
3. Saba, S., Cui, Y.J, Tang, A.M., Tran, T.P.H. and Barnichon, J.D. 2013. Anisotropic swelling of compacted bentonite/sand mixture. Submitted to Soils and Foundations. 4. Saba, S., Barnichon, J.D., Cui, Y.J. and Tang, A.M. 2013. On the hydro-mechanical
behaviour of compacted bentonite/sand mixture: comparison between laboratory and in situ experiments. Submitted to Engineering Geology.
5. Saba, S., Barnichon, J.D., Cui, Y.J. and Tang, A.M. 2013. On the hydro-mechanical behaviour of compacted bentonite/sand mixture by small scale infiltration tests. Submitted to Canadian Geotechnical Journal.
6. Saba, S., Cui, Y.J., Barnichon, J.D. and Tang, A.M. 2013. Small scale infiltration column with local measurements of swelling pressure: cell validation. Submitted to Geotechnical Testing Journal.
7. Saba, S., Cui, Y.J, Delage, P., Lenoir, N., Tang, A.M. and Barnichon, J.D. 2013. Limited swelling and homogenisation of compacted bentonite/sand mixture: a 3D investigation using X-ray computed tomography (µCT). Ssubmitted to Applied Clay Science.
8. Wang, Q., Cui, Y.J., Tang, A.M., Barnichon, J.D., Saba, S. and Ye, W.M. 2013b. Hydraulic conductivity and microstructure changes of compacted bentonite/sand mixture during hydration. Engineering Geology 164, 67-76.
Conference communications
1. Saba, S., Cui, Y.J., Barnichon, J.D. and Tang, A.M. 2012. Swelling of highly compacted bentonite-sand mixtures used as sealing materials in radioactive waste disposal. In proceedings of E-Unsat 2012, Unsaturated soils: Reasearch and Applications. pp 241-247 June 20-22, Naples, Italy. (Oral presentation).
2. Saba, S., Delage, P., Cui, Y.J, Tang, A.M., Lenoir, N. and Barnichon, J.D. 2013. Further insight into the microstructure of compacted bentonite/sand mixture. Clays in natural and Engineered Barriers for Radioactive Waste Confinement, 5th International Meeting, Oct. 22-25 2012, Montpellier, France. (Oral presentation).
3. Saba, S., Cui, Y.J., Tang, A.M. and Barnichon, J.D. 2012. Anisotropic swelling of compacted bentonite/sand mixture. Clays in natural and Engineered Barriers for Radioactive Waste Confinement, 5th International Meeting, Oct. 22-25 2012, Montpellier, France. (Poster).
4. Saba, S., Barnichon, J.D., Cui, Y.J., Tang, A.M. and Delage, P. 2013. Microstructure and anisotropic swelling behaviour of compacted bentonite/sand mixture. UNSAT-WASTE 2013, July 7-10, Shanghai, China. (Oral presentation).
VI
5. Saba, S., Wang, Q., Tang, A.M., Cui, Y.J. and Barnichon, J.D. 2011. Hydro-mechanical behaviour of compacted bentonite-sand mixture used as sealing materials in radioactive waste disposal. Mechanics and Physics of Porous Solids (MPPS) Symposium. Apr. 11-20 2011 Paris, France.(Poster).
ABSTRACT ... III PUBLICATIONS ... V
INTRODUCTION...1
Chapter 1Microstructure of the material at its initial state... 7
INTRODUCTION... 9
Further insight into the microstructure of compacted bentonite/sand mixture ... 11
1 Introduction ... 11
2 Material and methods ... 12
3 Results ... 15
4 Discussion ... 23
5 Conclusion... 25
References ... 25
Chapter 2Free/limited swelling upon direct contact with water ... 29
INTRODUCTION... 31
Swelling of highly compacted bentonite-sand mixtures used as sealing materials in radioactive waste disposal ... 33
1 Introduction ... 33
2 Materials and methods ... 34
3 Results and discussion... 35
4 Conclusion... 37
References ... 38
Limited swelling and homogenisation of compacted bentonite/sand mixture: a 3D investigation using X-ray computed tomography (µCT) ... 39
1 Introduction ... 39
2 Materials and methods ... 41
3 Results ... 43
4 Discussion ... 51
5 Conclusion... 53
References ... 54
Chapter 3 Swelling pressure anisotropy investigation ... 57
INTRODUCTION... 59
Anisotropic swelling of compacted bentonite/sand mixture ... 61
1 Introduction ... 61
2 Materials and methods ... 63
3 Experimental results ... 66
4 Discussion ... 70
5 Conclusion... 73
References ... 74
Microstructure and anisotropic swelling behaviour of compacted bentonite/sand mixture. 77 1 Introduction ... 77
2 Material and methods ... 79
3 Results and discussions ... 83
4 Conclusions ... 88
VIII
Chapter 4 Hydro-mechanical response of mock-up tests... 93
INTRODUCTION... 95
Small scale infiltration column with local measurements of swelling pressure: cell validation ... 97
1 Introduction ... 97
2 Materials... 98
3 Experimental set-up... 99
4 Test procedure ... 107
5 Results and discussion... 109
6 Conclusion... 113
References ... 114
Investigation of the swelling behaviour of compacted bentonite/sand mixture by mock-up tests ...117
1 Introduction ... 117
2 Materials... 119
3 Experimental methods... 119
4 Mock-up tests ... 121
5 Swelling pressure versus suction... 132
6 Simulation of confinement failure in Mock-up 2... 135
7 Conclusion... 139
References ... 141
Chapter 5 Link between laboratory experiments ... 143
and in situ tests ... 143
INTRODUCTION... 145
On the hydro-mechanical behaviour of compacted bentonite/sand mixture: comparison between laboratory and in situ experiments ... 147
1 Introduction: ... 147
2 Materials studied ... 149
3 SEALEX in situ test ... 149
4 Laboratory tests ... 153
5 Experimental results and comparison ... 156
6 Conclusion... 163
References ... 164
CONCLUSION...167
INTRODUCTION
The management of radioactive waste is a major concern for the countries that produce or use nuclear energy like China, Belgium and France among others. These wastes are treated differently depending on their activity and their period (i.e. half-life). In France, High Level and Intermediate Level Long-Lived (HL/IL-LL) wastes are temporarily stored at surface by the respective producers awaiting a long-term sustainable management solution. Deep geological disposal has been considered as a possible solution to successfully isolate these wastes from the biosphere for a very long period. This involves placing the waste in an underground facility, located several hundreds of meters in a relatively impermeable rock, in order to isolate them over periods allowing for the radioactive decay of isotopes they contain. Such storage is based on the concept of multi-barrier: the natural or geological barrier (host rock) and engineered barriers (waste container, buffer and sealing elements). In the French concept, once the wastes containers will be installed, galleries and access shafts are closed and sealed by swelling clay based cores. Compacted mixture of bentonite and sand is one of the candidate sealing materials in this system thanks to their low permeability, high swelling and high radionuclide retardation capacities (Pusch, 1979; Yong et al., 1986; Villar et al., 2008). Moreover, addition of 30% sand has a negligible effect on the hydraulic conductivity of the mixture (Cho et al., 2000) but was found to be advantageous with respect to ease of handling, manufacturing and cost (Agus, 2005).
Once installed in the repository, these sealing materials will be subject to coupled hydro-mechanical loadings: hydration due to the infiltration of pore water from the natural barrier and mechanical confinement resulting from the relatively prevented swelling of the engineered barriers. It is therefore essential to understand well their behaviour under such loadings when assessing the overall repository safety.
In this context, a number of laboratory studies has been conducted to investigate the performance of buffer/sealing materials (e.g. Delage et al., 1998; Lloret et al., 2003; Agus and Schanz, 2005; Romero et al., 2005; Lloret & Villar, 2007). Various experiments were also performed in underground research laboratories (URL) such as FEBEX at Grimsel (Switzerland), RESEAL at Mol (Belgium), KEY at Bure (France) and SEALEX at Tournemire (France), to which this work is closely related.
In order to identify the key factors related to the long-term performance of bentonite-based sealing systems, the French institute IRSN (Institut de Radioprotection et de Sûreté Nucléaire) has launched the SEALEX project. This project consists of a series of in situ experiments
Introduction
4
performed in natural conditions and at a representative scale in the Tournemire URL. The tests program was specially built in order to provide useful information about the effect of technical specifications, design, construction, defects, etc. (Barnichon et al. 2009, 2010). Clay cores made of pre-compacted disks of MX80 bentonite/sand mixture were considered. The cores were introduced in boreholes excavated in claystone where they undergo the saturation process. During this process, the injected water volume, total pressure and relative humidity changes are monitored at several positions. The impact of the technical specification and design of the sealing plug will also be investigated by changing the intra-core geometry (jointed vs. monolithic disks), core composition (MX80/sand ratio) and core conditions (pre-compacted vs. in situ (pre-compacted). Furthermore, the effect of altered conditions will be also studied by simulating the decrease of swelling pressure caused by a failure of the concrete confining structure. Considering the complexity of the in-situ conditions, it appears important to identify the hydro-mechanical behaviour of compacted mixture in laboratory conditions in order to obtain useful information for interpreting the results obtained in the field conditions. Problematics and objective of the study:
Once the initially unsaturated bentonite/sand core is in place, it undergoes a process of saturation by infiltration of pore water. The present work specially focuses on the interface between the seal and the host-rock while considering the presence of radial technological void. This void is the annular gap that is technically needed for the installation of the seal in the gallery (Barnichon et al., 2010, 2012). Once in contact with water, a first mechanism of bentonite free swelling by gel formation starts to fill the void (Cui et al, 2002; Cui et al, 2008). A density gradient is then present between the compacted centre and loose gel at the interface with the host-rock. This gel will consolidate over time being blocked between the continuously swelling compacted centre and the relatively stiff host-rock. Meanwhile, the swelling of the compacted centre to the rear of this gel induces a reduction of their density which can approach that of the consolidated gel. Theoretically, the density gradient is expected to decrease over time and to reach a final state of uniform density. In reality, as a result of the complex interface and microstructure of compacted materials, this ideal case of uniform final density may never be reached. If the density gradient persists in the clay core in the final state, it must be taken into account in the assessment of overall safety of the storage system, for instance by considering the hydro-mechanical properties as a function of density. The objective of this work is to study the long term evolution of the density gradient and that in terms of microstructure, swelling stress and density measurements.
The testing program consists of different types of experimental laboratory tests that were performed in order to study several phenomena. The initial microstructure was investigated by microfocus X-ray computed tomography (µCT) and Mercury Intrusion Porosimetry (MIP); the limited swelling and homogenisation were studied by time lapse photography and µCT; the anisotropy of swelling pressure was studied by constant volume elementary tests and finally the hydro-mechanical behaviour was investigated by 1/10 mock-up tests and by comparing with the results from in-situ experiments.
Organisation of the dissertation:
The results of this work are subjected to 8 published, submitted and to-be-submitted papers. One of them was published in the proceedings of E-Unsat 2012 Conference; two other papers were accepted with moderate modifications in Engineering Geology journal and Journal of Rock Mechanics and Geotechnical Engineering. The other papers were submitted to Soils and Foundations, Applied Clay Science, Engineering Geology, Canadian Geotechnical Engineering and Geotechnical Testing journal. The dissertation includes 5 chapters composed each by an introduction and the corresponding papers/manuscripts, in their original form. The first chapter presents the microstructure of the compacted material at its initial compacted state before hydration. The study was done by microfocus X-ray computed tomography (µCT) in addition to Mercury Intrusion Porosimetry (MIP). µCT is a non-destructive 3D imaging technique increasingly used in the field of geosciences. The bentonite and sand grains organisation in the sample was examined; the pores distribution in the sample was further investigated using image analysis. A qualitative and quantitative study of the 3D sample is shown in this chapter as well as an analysis of the complementary features of the two techniques (MIP and µCT).
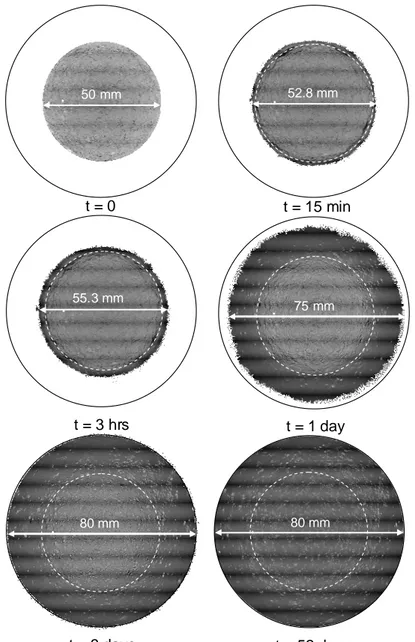
The second chapter involves the limited swelling of the material after being immersed in water. A 2D examination by time lapse photography constitutes the first part of the chapter and a 3D investigation using µCT constitutes the second part. In the first part, the swelling mechanism was observed and analysed especially in terms of gel production and swelling kinetics. By µCT, the 3D limited swelling was observed; the gel formation and the sample homogenisation due to swelling was further studied by image analysis.
Constant volume swelling and anisotropy were studied in the third chapter. In a first part, the swelling stress was measured in two different directions (radial and axial). Emphasis was put on the anisotropy of swelling pressure knowing that the swelling pressure of compacted
Introduction
6
bentonite/sand mixture was studied in the past but only by considering a single global swelling pressure (axial) for the clay core. On the other hand, in practice, the seal swells in both directions, axially towards the confining elements and radially towards the host-rock. The swelling pressure kinetics, final swelling pressure values and the anisotropy was further studied. In a second part of this chapter, an investigation of the microstructure features was conducted to complete the analysis of the results on the anisotropy of swelling pressure. The microstructure observation was made using µCT on unsaturated compacted sample and a saturated sample after swelling pressure test.
In connection with the SEALEX project, 1/10 mock-up tests were performed to study the saturation of the compacted sample with local measurements of swelling pressure. In the first part of the fourth chapter, the cell specially designed for this purpose is described in details. The obtained measurements like the swelling pressures, the volume of infiltrated water, and the axial displacement were compared to other results in literature in order to validate the cell. In the second part of this chapter, the hydro-mechanical behaviour of compacted bentonite/sand mixture was studied by combining the swelling pressure measurements with the previous suction measurements by Wang et al. (2013b). In this same part, the failure of confining elements was experimentally simulated and the sealing of the created void was investigated. The density gradient was also studied from the radial swelling pressure measurements along the sample.
Finally, the results obtained from the laboratory tests were compared with the in situ results. A SEALEX test was chosen for this comparison where the same material was tested with measurements of swelling pressure and relative humidity. Despite the significant differences in the scale of tests and the technical complications, some interesting comparison factors were defined.
Chapter 1
INTRODUCTION
The main role of the sealing materials is to limit fluxes of underground waters around the galleries, by their low permeability and high swelling capacity that help in closing all gaps. These two characteristics are then the most important and consequently the most investigated in the past. Very often, bentonite-based materials are considered as the most appropriate sealing materials. As the macroscopic behaviour of bentonite-based materials is closely related to their microstructure features, it is important to well characterise the microstructure of the studied material in its initial state.
The traditional microstructure observation techniques are the Mercury Intrusion Porosimetry (MIP) and the Scanning Electron Microscopy (SEM) and they have been successfully applied to bentonite-based materials (Agus and Schanz, 2005; Delage et al., 2006). However, these techniques require preliminary sample treatment and the volume of the sample is limited to about 1 cm3 in the case of MX80/sand mixture. In addition, both techniques are destructive and the tested sample cannot be reused. The MIP technique provides the pore size distribution and the porosity of the tested sample but it cannot tell about the pores distribution in the whole as-compacted sample unless several tests are performed at small samples taken at different locations. This technique also cannot tell about pores connectivity. The SEM method gives a 2D observation at microscopic scale and cannot provide an overall look at the macroscopic scale of the sample.
In this first chapter, microfocus X-ray computed tomography (µCT) observations were used in parallel to the MIP measurements to further investigate the microstructure of a compacted bentonite/sand sample. µCT is a non-destructive 3D imaging technique that does not impose a preliminary sample treatment. It has been recently successfully applied on bentonite-based materials. The overall grains and pores distribution in the “as-compacted sample”, their connectivity was further investigated by qualitative observation completed by image analysis. The results are presented in the form of a paper tentatively accepted for publication in “Engineering Geology”.
Further insight into the microstructure of compacted bentonite/sand
mixture
Simona Saba1,2, Pierre Delage1, Yu-Jun Cui1, Anh Minh Tang1, Nicolas Lenoir1 and Jean-Dominique Barnichon2
Abstract: Compacted bricks of bentonite/sand mixture are planned to be used as sealing plugs in deep radioactive waste disposal repositories because of their low permeability, high swelling capacity and favourable properties with respect to radionuclide retention. The isolating capacity of compacted bentonite/sand mixture is closely related to microstructure features that have been often investigated, in particular by using scanning electron microscope (SEM or ESEM) and mercury intrusion porosimetry (MIP). In this work, CT observations were used in parallel to MIP measurements to further investigate, at larger scale, the microstructure of a laboratory compacted bentonite/sand disk (65/35% in mass). Qualitative observation of CT images showed that sand grains were inter-connected with some large pores between them that were clearly identified in the bimodal pore distribution obtained from MIP measurements. Due to the gravitational and frictional effects along the specimen periphery, a higher density was observed at the centre of the specimen with bentonite grains closely aggregated together. This porosity heterogeneity was qualitatively estimated by means of image analysis that also allowed the definition of the representative elementary volume. Image analysis also provided an estimate of the large porosity, in good agreement with MIP measurements.
Keywords: compacted sand-bentonite mixture; sealing plug; radioactive waste disposal; microstructure; mercury intrusion porosimetry; X ray micro tomography.
1Introduction
In deep radioactive waste disposal concepts, sealing plugs made of compacted bentonite/sand blocks are planned to be used to close the galleries and to limit water transfers. Compacted bentonite/sand plugs are used for their low permeability, high radionuclides retention capability and sealing/swelling abilities when infiltrated by water (e.g. Pusch, 1979; Yong et al., 1986). Once the disposal galleries are closed, plugs will be progressively infiltrated by the pore water of the host rock. They will swell and seal the so-called technological voids of the system, i.e. the voids remaining between blocks and at the interfaces with the rock. These technological voids are estimated at 14% of the total volume of the plugs by IRSN (Institut de Radioprotection et de Sûreté Nucléaire, the French expert Institution in the field of nuclear safety).
Various investigations of the microstructure of compacted bentonites and sand bentonite mixture have been carried out by using mercury intrusion porosimetry (MIP) and scanning electron microscopy (SEM, ESEM, Komine and Ogata, 1999; Villar and Lloret, 2001;
1
Ecole des Ponts ParisTech, Laboratoire Navier, Marne La Vallée, France
2
Chapter 1. Microstructure of the material at its initial state
12
Montes-H, 2002; Cui et al., 2002; Lloret et al., 2003; Agus and Schanz, 2005; Delage et al., 2006). These techniques require a cautious preliminary dehydration of the samples, often by freeze-drying. They provide local observations on a small part of millimetric samples. They are hence interestingly completed at a larger scale by microfocus X-ray computed tomography (µCT), a high-resolution non destructive 3D observation technique that does not need any sample pre-treatment and that gives further 3D information on the whole sample (including grain size distribution as well as pores size distribution and pores inter-connectivity).
Previous applications of µCT have been devoted to the monitoring of hydro-chemo-mechanical processes (Comina et al., 2008), to the detection of desiccation cracks (Gerbrenegus et al., 2006; Mukunoki et al., 2006), to the visualisation of diffusion/hydration phenomena, to the study of fluid movements (Rolland et al., 2003; Rolland et al., 2005; Carminati et al., 2006; Koliji et al., 2006) and to the investigation of the microstructure of compacted bentonite based materials (Kozaki et al., 2001, Van Geet et al., 2005 and Kawaragi et al., 2009). In this work, µCT was coupled to MIP for further microscopic investigation of a compacted bentonite/sand sample.
2Material and methods
2.1 Material
The studied material is a compacted mixture of Wyoming MX-80 bentonite (65% in dry mass, commercial name Gelclay WH2) and sand (35%). The MX80 bentonite contains 92% of montmorillonite with several other minerals including quartz, alumina, and hematite (Tang et al., 2008). The sand is of pure quartz nature (commercial name TH1000).
The mixture was provided in boxes containing a powder with an initial water content of 10.2% and a suction of 73.3 MPa measured with a chilled mirror dew point tensiometer (Decagon WP4). The grain size distribution of the bentonite powder obtained by dry sieving is presented in Figure 1 together with that of the deflocculated bentonite obtained by sedimentation. The grain size distribution of the sand is also plotted in Figure 1. The grain size distribution curves show that the bentonite powder grains are larger than the sand grains with D50 values of 1.2 and 0.6 mm, respectively. Both curves are representative of well sorted materials. The unit mass of bentonite particles was measured using a pycnometer and found equal to 2.77 Mg/m3 in agreement with the published data (Madsen, 1998; Karnland et al., 2006). The density of bentonite grains was also measured using a pycnometer with a
desaromatised immiscible oil (commercial name Kerdane) having a density of 0.791 at 20°C. It was found equal to 2.00 Mg/m3. The value for sand grains was found equal to 2.65 Mg/m3. Compacted samples were prepared by uniaxial static compaction (strain rate of 0.1 mm/min) in a cylindrical mould in order to obtain a disk (diameter 50 mm, height 10 mm) at the target dry density (1.8 Mg/m3 obtained at a maximum compaction stress of 25.5 MPa).
! " #$
Figure 1. Grain size distribution curves.
The sample water content was 10%, resulting in a degree of saturation of 55 % and a suction of 76.3 MPa. Note that this value is close to that of the powder prior to compaction (73.3 MPa). The slightly higher value may be due to some effects of evaporation during the process of compaction. In any case, these small changes in suction after compaction are compatible with the observations of Li (1995), Gens et al. (1995) and Tarantino and De Col (2008) on soils compacted on the dry side of Proctor optimum. It confirms that suction is governed by aggregates that are not much affected by the compaction. As a consequence, there is little dependency of the water retention properties on the sample density in compacted bentonite based materials.
2.2 Mercury intrusion porosimetry
The pore size distribution of the compacted samples was measured on freeze dried samples using an Autopore IV 9500 mercury intrusion porosimeter (Micromeritics) that operates at a maximum pressure of 230 MPa. Instantaneous freezing was carried out by plunging small samples (volume 0.40 cm3) in slush nitrogen (-210°C) obtained by previously submitting it to vacuum (Delage et al., 2006). In such conditions, there is no nitrogen boiling around the samples when plunging them into nitrogen, resulting in an optimized quick freezing and good microstructure preservation. The intruded porosity was determined from the total volume of mercury intruded into the sample and the pore size distribution was obtained, in a standard
Chapter 1. Microstructure of the material at its initial state
14
fashion, assuming parallel, cylindrical nonintersecting pores of different radii, using the Autopore IV 9500 V1.09 standard software package. The intruded porosity was systematically compared to the total porosity obtained by standard methods so as to detect the smaller porosity (entrance equivalent diameter smaller than 5.5 nm) not intruded by mercury at the highest applied pressure (200 MPa).
2.3 Microfocus X-ray tomography and image analysis
Microfocus x-ray computed tomography ( -CT) was used to examine, in three dimensions, the internal microstructure of the compacted bentonite/sand mixtures. -CT is a non destructive observation technique that has proven to be useful in the investigation of various geological porous media including compacted bentonite (Kozaki et al., 2001), bentonite pellet/powder mixture (Van Geet et al., 2005) and compacted bentonite/quartz mixture (Kawaragi et al., 2009). -CT consists firstly in recording a set of two-dimensional X-ray radiographs of an object at several angles (typically at 180° or 360°) and secondly in reconstructing the 3D slices from the radiographs using a mathematical algorithm. The final 3D image of the internal structure is obtained by stacking the slices. The final measurement is the attenuation coefficient to x-ray which depends on the mass density and the atomic number of the object (Ketcham and Carlson, 2001; Van Geet et al., 2005).
The µCT scans presented here were carried out with the device of the Navier laboratory (Ecole des Ponts ParisTech), an “Ultratom” device specifically designed and manufactured by RXsolutions (France). Images were reconstructed using the software Xact-reconstruction developed by RXsolutions. The system is a dual-head and dual-imager scanner; two sources [a nano-focus xs-160hpnf/GE-Phoenix (160 kV, 15W, 0.9 µm min spot size) and a micro-focus xs-225d/GE-Phoenix (225 kV, 320W, 5 µm min spot size)], two interchangeable imagers: [HD camera PhotonicScience VHR (4008x2672 pixels, 9µm pixel size) and a flat-panel-CsI scintillator-Varian 2520V/Paxscan (14 bit, 1920x1526 pixels, 127µm pixel size)]. The couple micro-focus source/flat panel was used in this study. The X-ray source parameters were a voltage of 140 kV with an intensity of 210 µA, a source power resulting in a spot size below or equal to the spatial resolution, here a voxel size of 30 µm. The sample was scanned using 1440 projections on 360° with an exposure time of 0.2 s. Each projection was integrated on 4 s (average of 20 frames) in order to obtain a good signal-to-noise ratio. The total scanning time was about one hour and a half. The final 3D image is a 16 bit type with a size of 1840x1840x386 voxels. The image analysis and treatment was then carried out using ImageJ, a public domain Java image processing program (Rasband, 1997-2012). Note that the
image was first converted to 8 bit for size reasons.
3Results
3.1 Pore size distribution
The pore size distribution determined at a dry density of 1.8 Mg/m3, a water content of 10% and a suction of 76.6 MPa is presented in terms of cumulative and density functions curves in Figure 2. The bimodal curve obtained is comparable to that of samples compacted dry of optimum (Ahmed et al., 1974; Delage et al., 1996; Romero et al., 1999 among others) and also with the results of Cui et al. (2002), Lloret et al. (2003), Agus and Schanz, (2005) on compacted bentonite materials.
0.01 0.1 1 10 100 0.00 0.05 0.10 0.15 d V /d (l o g D )
a
0.01 0.1 1 10 100 0.0 0.1 0.2 0.3 0.4b
P o ro s it yEntrance pore diameter (µm)
Figure 2. (a) Pore size distribution curve and (b) Cumulative porosity curve.
The PSD curve indicates that the smaller pores population (micro-pores) has a mean entrance diameter of 0.019 µm and the larger pore population (macro-pores) has a mean entrance diameter of 22 µm. Note that the intrusion of mercury into the specimen starts at quite a low
Chapter 1. Microstructure of the material at its initial state
16
pressure, evidencing a largest diameter of 360 µm, the upper limit of the method. The total porosity (0.337) calculated in a standard fashion by macroscopic volume measurements are also plotted in Figure 2.
The smaller value of the porosity intruded by mercury (0.273) confirms that pores with an entrance diameter smaller than 5.5 nm (the lower limit of MIP) could not be intruded by mercury. This feature is typical of compacted bentonites and strongly depends on the water content (the higher the water content, the higher the smallest porosity, see Delage et al., 2006).
3.2 Microfocus X-ray computed tomography ( -CT)
The reconstructed 3D volume of a compacted sample of bentonite/sand mixture at a dry density of 1.8 Mg/m3 and a water content of 10% is presented in Figure 3.
10 mm 50 mm
4 mm
Figure 3. The 3D reconstructed image of the sample with the position of the cross section considered.
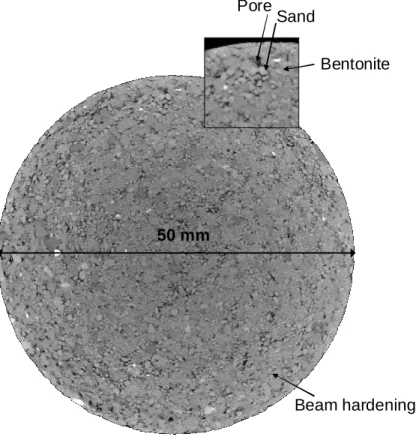
The position of the plane where the cross section has been done is indicated. The horizontal cross section at 4 mm from the top of the sample is provided in Figure 4. The µCT technique is able to distinguish the various components according to their density and atomic composition (the grey level range goes from white representing high attenuating material to black representing void). A clear distinction can be made between the clearer sand grains (density of 2.65 Mg/m3) and the less clear larger bentonite powder grains (hydrated at a gravimetric water content of 13% and with a density of 2.00 Mg/m3). This is due to their density and atomic composition difference. One can also observe in Figure 4 that the sample density is not strictly homogeneous with more voids observed around the sample and a larger density with less voids in the centre. This shows that, unsurprisingly, compaction was less effective around the sample along the ring against which friction effects resulted in less compaction. Detailed observation made on a zoom taken close to the sample perimeter also shows that the bentonite powder grains remain clearly apparent around the sample and that they are apparently more frequent than at the centre where powder grains appear to be more compacted one against another, resulting in a denser structure. Inspection of Figure 4 also
shows that the bentonite/sand mixture is not really homogeneous and that sand grains and powder grains appear to be somewhat segregated. As indicated in the figure, aggregations of powder grains are observed in some locations and sand grains packings with inter-grains pores in other locations. This segregation, probably resulting from the difference in density between the bentonite powder and the sand grains, is not compatible with the common statement that, in a 35-65% sand/bentonite mixture, sand grains should be homogeneously scattered among a (supposedly finer) clay matrix.
Sand grains Bentonite grains Aggregated bentonite grains
Inter sand grains pores
Inter sand grains pores Sand grains packings Sand grains Bentonite grains Aggregated bentonite grains
Inter sand grains pores
Inter sand grains pores
Sand grains packings
Figure 4. A typical horizontal µCT cross section of the compacted bentonite/sand mixture sample (dry density: 1.8 Mg/m3, water content: 10%. disk diameter is 50 mm).
Conversely, it seems that, due to segregation, some continuity between the sand grains is observed with the bentonite powder grains located inside a loose grain “skeleton”. As a consequence, there could be some continuity and interconnection of the pores located between sand grains.
Further examination of the voids configuration shows that many voids are located between sand grains. Around the sample, some voids are also located between powder grains but this is less true at the denser centre in which bentonite grains appear to be aggregated together. This suggests that the maximum compression stress, in spite of being as high as 25.5 MPa, is not high enough to allow the intrusion of clay particles (hydrated at a water content of 13 % with 73.3 MPa suction) into the pores located between the sand grains. This high compression stress only allows some aggregation of bentonite grains as observed at the centre (around 8
Chapter 1. Microstructure of the material at its initial state
18
grains of various diameters are aggregated in the circle indicated). This slight deformability of dry grains under high stresses is compatible with the observation made above about the small suction variations observed when compacting samples in dry conditions: compaction affects the assembly of bentonite grains but not significantly the bentonite grains themselves, the microstructure of which is governing suction.
Visual observation of two cross sections close to the bottom and to the top of the sample also showed that the pore distribution was not homogeneous along the axial direction, with more large pores and large particles observed in the bottom of the sample. This is related to segregation effects during sample preparation. When pouring the powder into the compaction mould, the largest grains first tumble resulting in more macro-pores at the bottom.
Observation of Figure 4 provides further information about the interpretation of the PSD curves of Figure 2, in which one observes that mercury intrusion started in macro-pores with an entrance diameter of 330 µm and an average diameter of 22 µm. This size is compatible with the inter-grain pores observed in µCT in Figure 3. Given that the sample tested in MIP was extracted from the centre in which bentonite grains are more closely aggregated together, this pore population is mainly related to the pores located between the sand grains. The clear presence of the pore inter-grains population in the PSD curve confirms the interconnection of inter-grains pores along the grain skeleton that was suspected from the µCT image and commented above. Hence, the bimodal porosity that is generally related to inter-aggregate and intra-aggregate pores in soils compacted dry of optimum (Ahmed et al 1974, Delage et al. 1996, Romero et al. 1999) is here due to the nature of the mutual arrangement of sand and bentonite powder grains. Indeed, the inter-aggregate average entrance pore diameter observed by Delage et al. (1996) in a compacted low plasticity Jossigny silt is 8 µm whereas Romero et al. (1999) detected inter-aggregates pores close to 2 µm in compacted Boom clay. The significantly larger average entrance pore diameter detected here is too large to be representative of inter-aggregate pores as in the case of standard compacted soils, it is linked to the connected inter-grains pores observed along the sand skeleton in µCT.
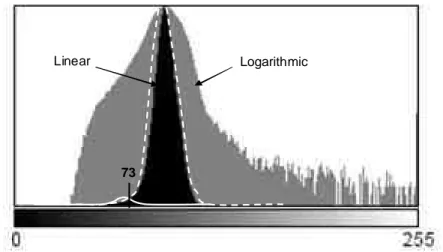
73 Logarithmic Linear 73 Logarithmic Linear
Figure 5. Histogram of the image (linear and logarithmic scale) with the fitted Gaussians and the obtained threshold value.
Further investigation of the microstructure was carried out using the ImageJ image analysis software. The first step was to reduce noise by applying a 3D median filter with a 1 pixel radius. Then, a segmentation of the image is needed in order to isolate pores from the other existing phases. The choice of the threshold value is made using the “mixture modelling” plugin. The mixture modelling technique is a histogram based technique that assumes that the histogram distribution is represented by two Gaussian curves. The histogram is then separated in two classes using a Gaussian model and a threshold value of 73 is then calculated as the intersection of the two Gaussians. Figure 5 shows the histogram of the image on a linear (black) and logarithmic (grey) scale. The linear graph does not exhibit two clearly distinct peaks because the number of pore voxels is too small compared to that of the grains. However the logarithmic graph evidences a non-symmetrical shape indicating the presence of the smaller pore population. The two Gaussians are then fitted using the “mixture modelling” plugin as seen in the Figure 5 represented by the white (continuous and dashed) curves.
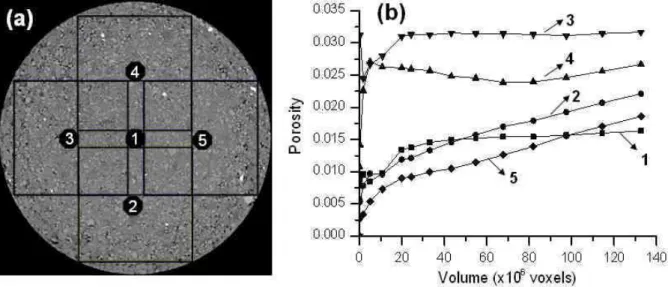
Figure 6 shows an image at different stages before segmentation: a) initial state; b) after applying a 3D median filter; c) after applying a 73 threshold value (Figure 5) and d) the segmented image. An investigation on the effect of the size of the studied volume on the calculated porosity was conducted. To this end, the porosity was calculated using the histogram of the segmented image and by dividing the number of black voxels by the total number of voxels. Starting from the middle horizontal cross section of the sample at different positions (see Figure 7a), cubic volumes were selected with sides starting from 21 to 271 pixels.
Chapter 1. Microstructure of the material at its initial state
20
a) b) c) d)
Figure 6. Images at different stages before segmentation: a) non-treated, b) after applying 3D median filter, c) during threshold and d) final segmented image.
The side on the z direction is limited by the height of the sample (10 mm) that corresponds to a maximum thickness of 271 pixels. x and y were afterwards increased until 700 resulting in a parallelepiped volume. The porosity values calculated with respect to the considered volumes are plotted in Figure 7. The curves start with some irregularities and then stabilise. Some curves continuously and slowly increase (bottom and right in Figure 7a). These increases suggest a spatial heterogeneity of the porosity. Indeed, when the studied volume increases, porosity increases because some zones located on the side of the specimen with higher porosity are more and more included into the volume. Stabilization is observed for volumes greater than 20 x 106 voxels. This volume corresponds to a cube with a side approximately equal to the height specimen i.e. 271 pixels. It can hence be considered as a Representative Elementary Volume (REV).
Figure 7. Calculated porosity for different volumes and at different locations in the sample.
This side size corresponds to 9 adjacent grains (D50 mixture = 0.9 mm = 30 voxels), which is compatible with previous studies (e.g. Razavi et al., 2007).
Figure 8. Sections of the volumes investigated in the sample (thickness 271 voxels).
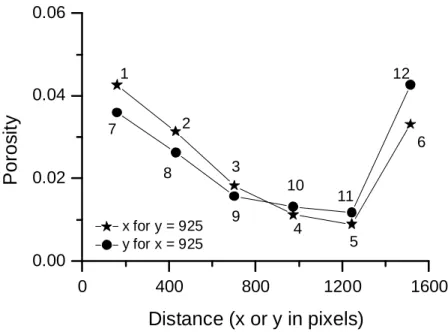
The spatial distribution of the porosity is now investigated at different locations along the x and y directions by using volumes with heights equal to 271 pixels. The locations of the volumes sections investigated are presented in Figure 8. Figure 9 shows the variation of porosity with respect to x and y (volumes 1 to 12 in Figure 8). A clear difference is observed in the porosity values between the border (x, y = 160 and 1515) and the centre. A significant difference in porosities is also noticed for x (or y) varying between 1244 and 1515 while y (or x) equals 925. It corresponds to cubes 5 and 6, 11 and 12 in Figure 8. The porosity variation at these points is not smooth like in the others but the slope is steep showing a sudden change in porosity. 0 400 800 1200 1600 0.00 0.02 0.04 0.06 P o ro s it y Distance (x or y in pixels) x for y = 925 y for x = 925 1 7 8 2 3 10 9 4 11 5 12 6
Chapter 1. Microstructure of the material at its initial state
22
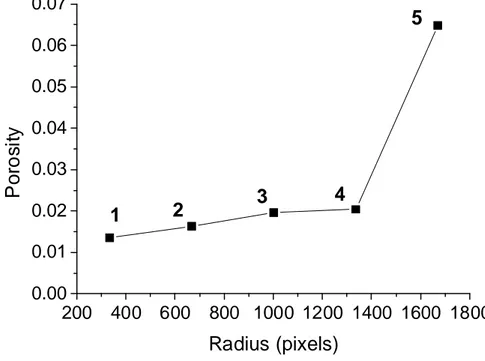
It confirms the slow increase observed in the REV study (Figure 7b), since it corresponds to the same positions (right for cubes 5 and 6 and bottom for cubes 11 and 12). The same study is now made on concentric rings having a height of 271 pixels and a width of 167 pixels starting from the centre (radius from 0 to 167) to the contour (radius from 501 to 835, see Figure 10).
Figure 10. Concentric rings studied.
The porosities obtained with respect to the radius are presented in Figure 11. The smallest detail that can be identified in the µ -CT images is defined by the size of the voxel (30 m). The porosity estimated by image analysis only involves pores with a diameter larger than 3 voxels (partial volume effect).
200 400 600 800 1000 1200 1400 1600 1800 0.00 0.01 0.02 0.03 0.04 0.05 0.06 0.07 P o ro s it y Radius (pixels) 1 3 4 5 2
The value of the cumulated porosity of pores larger than 90 µm from the PSD curves (Figure 2) is 0.0108. This value is in the same range as that obtained by image analysis in the central part of the sample where MIP was performed (0.0135 porosity for radius smaller or equal to 334 voxels). This confirms that, in spite of some limitation related to the voxel size, µCT is an interesting complementary method to MIP for estimating the macro-pores and giving additional information on the spatial distribution of the porosity.
4Discussion
Most of the investigations carried out up to now on compacted soils in laboratory have been obtained from the combined use of MIP and SEM on freeze dried samples. It is commonly admitted that the bimodal pore distribution observed in fine-grained soils compacted dry of optimum is due to the aggregate microstructure of compacted soils, with macro-pores being inter-aggregate pores and micro-pores being intra-aggregate pores. In such soils, it has also been demonstrated that compaction has little effect on the sample’s suction (Li et al., 1995, Gens et al., 1995, Tarantino and De Col, 2009), given that suction is governed by intra-aggregate phenomena (mainly the adsorption of water along the clay fraction, Romero et al., 1999) whereas the change in density are due to the compression of larger inter-aggregate pores with little effect on the aggregates (Delage, 2009).
Compacted bentonites and sand-bentonite mixtures are a special case of compacted soils. They are obtained by compacting powder grains that may have, as observed here, a size significantly larger than the aggregates in laboratory compacted soils. Compacted bentonites and sand-bentonite mixtures also have quite large values of suction (76.6 MPa here). In the mixture studied here, the powder grains of bentonite (1.2 mm average diameter) are larger than the sand grains (0.6 mm average diameter). As in standard compacted soils, suction appeared here not to change significantly before and after compaction (73.3 MPa in the powder before and 76.6 MPa after compaction), confirming a well known trend in compacted soils.
Compared to MIP and SEM, µCT provided further information on a larger scale going from the size of the grains (sand and bentonite, 1 mm order of magnitude) to the size of the sample (50 mm), i.e. on a scale much larger and representative than both MIP and SEM. Interestingly, µCT has been able to distinguish clearly enough the bentonite from the sand grains within the compacted mixture, in spite of small difference in density. Thus, µCT provided interesting complements to MIP and SEM observations, including grains
Chapter 1. Microstructure of the material at its initial state
24
connectivity and distribution through the sample.
An important point is that µCT observation confirmed that the bentonite grains seem to have not been crushed during compression. They still have an average size compatible with macroscopic grain size measurements and an angular shape with no clear appearance of local grain breakage. This finding is in agreement with the small variation of suction before and after compaction, as suspected from studies in laboratory compacted soils. Suction didn’t change because the grains have not been significantly affected by compression, even under 25.5 MPa. µCT also provides clear information about the mutual arrangement between sand and bentonite grains within the mixture, showing that it is not really homogeneous with some continuity observed between sand grains with the bentonite grains (65% in mass) located within the sand grains assembly (35% in mass). The common hypothesis of having sand grains isolated within a clay matrix is not confirmed and some continuity of the inter-grains porosity is suspected. In the looser zone around the sample, some large pores with a size comparable to that of the inter-grains pores have also been observed between the bentonite grains. These pores, that are likely to exist in less densely compacted sand-bentonite samples, are no longer observed in the denser central zone in which the compaction stress appear to be high enough to aggregate the bentonite grains together.
In spite of the precautions taken during sample preparation, µCT clearly evidenced that the compacted sand-bentonite mixture was heterogeneous with looser zones all around the sample close to the ring in which compaction was made. This difference could have been better estimated by running MIP tests at different distances from the centre to compare them with the data of Figure 2 obtained in the denser central area. Some segregation probably resulting from the difference in density between the bentonite and the sand grains was also detected by µCT. The hydro-mechanical response of the sample should be somewhat influenced by this heterogeneity, with mechanical parameters affected by the stronger central area and the hydraulic conductivity affected by the smaller permeability around the sample.
In this regard, it would be interesting to perform µCT observations on industrially processed compacted bricks to check their degree of heterogeneity, either due to change in density or to particle segregation during the process (that might be more severe than in the laboratory). Compared to the 2D friction effects observed here along the ring walls, 3D friction effects should be more pronounced close to the corners of the bricks. The question as to whether this heterogeneity affects the global response of the material arises, particularly with respect to water transfer during infiltration, arises. Indeed, the looser zones observed around the sample
could facilitate water transfer and reduce the infiltration time, a serious concern in mock-up tests (e.g. Dixon et al., 2002). In this regard, it appears that the direct determination of the hydro-mechanical parameters of the industrially compacted bricks becomes necessary to confirm the measurements carried out on samples of different shapes and sizes compacted in the laboratory. It would also be interesting to have an estimation of the global permeability of an assemblage of bricks, accounting for the effects of the technical voids.
5Conclusion
The µCT investigation of the microstructure of compacted bentonite/sand mixture samples (65/35%) provided interesting complementary features at larger scale that could not have been identified by using MIP. µCT allowed further observation of the mutual arrangement of bentonite and sand grains. The commonly admitted hypothesis of having isolated sand grains among a clay matrix has not been confirmed. Conversely, sand grains appeared to be scattered along a loose granular skeleton with interconnected inter-grains large pores that were also detected by MIP.
A study on the effect of the size of the REV demonstrated that it was necessary to consider a cubic volume with a size of 271 voxels (around 9 grains). The sample heterogeneity due to compaction with a larger porosity around the sample was quantified by carrying a 3D estimation of porosity by using image analysis.
The interconnection of inter-grains pores evidenced here could have some effects during the hydration of the bentonite/sand mixture, at least in the vapour phase, since it could facilitate the propagation of vapour within the mixture through connected inter-grains pores. The question as to whether this porosity remains interconnected and not clogged when bentonite grains start being hydrated remains. It could be examined by conducting a similar investigation at various degrees of hydration.
References
Agus S.S. and Schanz T. 2005. Effect of shrinking and swelling on microstructures and fabric of a compacted bentonite-sand mixture. Proceedings of the International Conference on Problematic Soils, Cyprus, 32, 543 – 550.
Ahmed S., Lovell C. W. and Diamond S. 1974. Pore sizes and strength of compacted clay. J. Geotech. Eng. Div. Am. Soc. Civ. Eng., GT4, 407– 425.
Carminati A., Kaestner A., Hassanein R. and Koliji A. 2006. Hydraulic properties of aggregate-aggregate contacts. In: Desrues J, Viggiani G, Bésuelle P (eds.) Advances in Xray tomography for geomaterials. ISTE Ltd, London, UK, 325–331
Chapter 1. Microstructure of the material at its initial state
26
monitor spatial and time variability in soil. Geotech Test J. ASTM 31, No. 5, 404–412. Cui Y.J., Loiseau C. and Delage P. 2002.. Microstructure changes of a confined swelling soil
due to suction controlled hydration. In Unsaturated soils: proceedings of the Third International Conference on Unsaturated Soils, UNSAT 2002, 10-13 March 2002, Recife, Brazil, volume 2, 593-598.
Delage P. 2009. Compaction behaviour of clay: discussion. Géotechnique 59 (1), 75-76. Delage P., Marcial D., Cui Y.J. and Ruiz X. 2006. Ageing effects in a compacted bentonite: a
microstructure approach, Géotechnique 56(5):291–304.
Delage P., Audiguier M., Cui Y.J., and Howat M. 1996. The microstructure of a compacted silt. Canadian Geotechnical Journal, 33: 150-158.
Dixon D., Chandler N., Graham J. and Gray M. 2002. Two large-scale sealing tests conducted at Atomic Energy of Canada's underground research laboratory: the buffer container experiment and the isothermal test. Canadian Geotechnical Journal 39 (3): 503-518.
Gens A., Alonso E.E., Suriol J. and Lloret A. 1995. Effect of structure on the volumetric behaviour of a compacted soil. Proc. 1st Int. Conf on Unsaturated Soils UNSAT’ 95 1, 83-88.
Gebrenegus T., Tuller M. and Muhuthan B. 2006. The application of X-ray computed tomography for characterisation of surface crack networks in bentonite-sand mixtures. In: Desrues J, Viggiani G, Bésuelle P (eds) Advances in X-ray tomography for geomaterials. ISTE Ltd, London, UK: 207–212
Karnland O., Olsson S. and Nilsson U. 2006. Mineralogy and sealing properties of various bentonites and smectite-rich clay material. SKB.
Kawaragi C., Yoneda T., Sato T. and Kaneko K. 2009. Microstructure of saturated bentonites characterized by X-ray CT observations. Engineering. Geology., 106, 51–57
Ketcham R. A. and Carlson W. D. 2001. Acquisition, optimization and interpretation of X-ray computed tomographic imagery : applications to the geosciences. Computers&Geosciences Vol. 27, 381-400.
Koliji A., Carminati A., Kaestner A., Vulliet L., Laloui L., Fluehler H., Vontobel P. and Hassanein R. 2006. Experimental study of flow and deformation in aggregated soils using neutron tomography. In: Desrues J, Viggiani G, Bésuelle P (eds). Advances in X-ray tomography for geomaterials. ISTE Ltd, London, UK: 341–348
Komine H. and Ogata N. 1999. Experimental study on swelling characteristics of sand-bentonite mixture for nuclear waste disposal. Soils and Foundations 39(2): 83-97.
Kozaki T., Suzuki S., Kozai N., Sato S. and Ohashi H. 2001. Observation of microstructures of compacted bentonite by microfocus X-ray computerized tomography (Micro-CT). J. Nucl. Sci. Technol., 38 (8), pp. 697–699
Li Z.M. 1995. Compressibility and collapsibility of compacted unsaturated loessial soils. Proc. 1st Int. Conf on Unsaturated Soils UNSAT’ 95 1, 139-144, Paris, Balkema, Rotterdam. Lloret, A., Villar, M. V., Sanchez, M., Gens, A., Pintado, X. & Alonso, E. E. 2003. Mechanical behaviour of heavily compacted bentonite under high suction changes. Géotechnique 53, No. 1, 27-40.
Madsen FT. 1998. Clay mineralogical investigations related to nuclear waste disposal. Clay Minerals, 33(1):109–129.
Montes-H G. 2002. Etude expérimentale de la sorption d’eau et du gonflement des argiles par microscopie électronique à balayage environnementale (ESEM) et analyse digitale d’images. PhD Thesis. Louis Pasteur University, Strasbourg I, France.
Mukunoki T., Otani J., Maekawa A., Camp S., Gourc J.P. 2006. Investigation of crack behaviour on cover soils at landfill using X-ray CT. In: Desrues J, Viggiani G, Bésuelle P(eds) Advances in X-ray tomography for geomaterials. ISTE Ltd, London, UK: 213–219. Pusch, R. 1979. Highly compacted sodium bentonite for isolating rock-deposited radioactive
waste products. Nucl. Technol, United States. 45(2):153-157.
Rasband W.S. 1997-2012. ImageJ, U. S. National Institutes of Health, Bethesda, Maryland, USA, http://imagej.nih.gov/ij/.
Razavi M.R., Muhunthan B. and Al Hattamleh O. 2007. Representative elementary volume analysis using X-ray computed tomography, Geotechnical Testing Journal 30 (3) doi:10.1520/GTJ100164.
Rolland S., Stemmelen D., Moyne C. and Masrouri F. 2003. Transfert hydrique dans un sol argileux gonflant non sature´: influence du confinement. Revue Française Géotech 104:21– 35
Rolland S., Stemmelen D., Moyne C. and Masrouri F. 2005. Experimental hydraulic measurements in an unsaturated swelling soil using the dual-energy gamma-ray technique. Proceedings of International Symposium on Advanced Experimental Unsaturated Soil Mechanics, Trento, Italy. In: Tarantino A, Romero E, Cui YJ (eds) Advanced experimental unsaturated soil mechanics. Taylor, Francis Group, London, 305–310.
Romero E., Gens A., and Lloret A. 1999. Water permeability, water retention and microstructure of unsaturated compacted Boom clay. Engineering Geology, 54: 117-127. Tang A.M., Cui Y.J. and Le T.T. 2008. A study on the thermal conductivity of compacted
bentonites. Appl Clay Sci; 41:181-189.
Tarantino A. and De Col E. 2008. Compaction behaviour of clay. Géotechnique 58(3): 199-213.
Van Geet M., Volckaert G. and Roels S. 2005. The use of microfocus x-ray computed tomography in characterising the hydration of a clay pellet/powder mixture. Applied Clay Science, 29(2):73–87, 2005.
Villar M.V. and Lloret A. 2001. Variation in the intrinsic permeability of expansive clays upon saturation. In: Adachi K., Fukue M. (eds) Clay Science for Engineering. A.A. Balkema, Rotterdam, 259-266.
Yong R.N., Boonsinsuk P. and Wong G. 1986. Formulation of backfill material for a nuclear fuel waste disposal vault. Canadian Geotechnical Journal, 23(2):216–228.