Share repurchase regulations: do firms
play by the rules?
Edith Ginglinger and Jacques Hamon a
December 2005
Key words: open market share repurchases, insider trading, regulations, liquidity
JEL classification: K22, G18, G35
Abstract
Open market share repurchases are strictly regulated to prevent companies from profiting from insider information. We examine compliance with these rules in France, where the mandatory disclosure of share repurchases provides detailed information on repurchases actually undertaken. Using a database containing 36,848 repurchases made by 352 French firms over the period 2000-2002, we show that very few firms fully comply with the regulations for all their buybacks. Non-compliance has an adverse effect on liquidity only for the smallest and least liquid firms.
a
Both authors are from Cereg, University Paris-Dauphine, place du Maréchal de Lattre, 75775 – Paris cedex 16 – [email protected] (corresponding author), [email protected]. We are grateful to Gérard Rameix for providing the data about daily repurchases. We would also like to thank Myron Slovin and Marie Sushka for their comments. We acknowledge partial financial support from Europlace Institut of Finance.
1. Introduction
Over the last decade, open market share repurchase has become a major corporate payout mechanism for public corporations all around the world (see for example Grullon and Michaely, 2004, for the U.S., Ikenberry, Lakonishok and Vermaelen, 2000 for Canada and Rau and Vermaelen, 2002, for the UK). To implement these buybacks, managers act directly in the market as investors on behalf of the company. This action puts them in the position of insiders, and thus, their intervention can be costly for investors. For the Hong Kong Stock Exchange, Brockman and Chung (2001) find that managers exhibit timing ability and that liquidity deteriorates during repurchase periods. To limit the risk of improper intervention, most countries have regulations for share repurchases to ensure that its shareholder interests are protected, and that the company will not profit from its private information. For instance, repurchases are not allowed when management holds information not disclosed to the market. There are also regulations to prevent manipulation of stock prices, which can arise when the company has contracts containing optional provisions that depend on share prices. This type of clause is common in mergers and acquisitions, LBOs and management remuneration packages. Restrictions on the quantity of shares repurchased during a given trading day reduce the impact of repurchases on the market price, but it is difficult to determine the level of compliance with these restrictions. The objective of this paper is to assess regulatory compliance in France, where repurchase disclosure is mandatory.
Regulation of share repurchases is an element of a more general trend to eliminate illegal insider trading, when managers, directors, or major shareholders buy or sell shares and are the sole beneficiaries of the transactions. In share repurchases, the decision is made by management, but on behalf of the company. Most developed countries have introduced insider trading regulations (Bhattacharya and Daouk, 2002 and Durnev and Nain, 2005) and there are studies that examine their effectiveness.1
While detailed regulations have also been established for share repurchases, there are few studies that have analyzed actual compliance with the rules.2 Companies’ disclosures of their total buybacks provide the only basis for verification of compliance, and disclosure requirements vary widely between countries and periods.3
Until 2004, the country with the most lenient regulations was the United States. Firms could repurchase shares without prior announcement and announce buyback programs without fulfilling them. The only disclosure requirement for repurchases was the reporting of the number of shares outstanding at quarter-end. The only guide for executing open market
repurchases was SEC safe harbor Rule 10b-18 under the Exchange Act of 1934. Rule 10b-18 provides issuers with a "safe harbor" from liability for manipulation when they repurchase their common stock in the market in accordance with the rule's manner, timing, price, and volume conditions. Prior to December 2003, when the SEC adopted amendments to Rule 10b-18, requiring companies to disclose all repurchases, the SEC had no means of investigating 10b-18 compliance for U.S. firms. Given the absence of regulatory based data, Cook, Krigman and Leach (2003) investigate 10b-18 compliance by using voluntarily disclosed data for 54 firms' repurchase programs during 1993 and 1994. They document that only 2 of the 54 firms were verifiably in compliance with the safe harbor guidelines for all reported repurchases. Since their sample contains only voluntarily supplied information, their results imply that few U.S. public firms complied totally with Rule 10b-18, prior to the enactment of the disclosure amendments.
In Europe, open market share repurchases are a recent practice that has been accompanied from the outset by regulations requiring actual repurchases to be reported at the time of the event. Under a European Union (EU) directive that took effect in 2004, national repurchase regulations are now tending to converge.
French regulations are similar to U.S. Rule 10b-18 in many respects, but firms listed on Paris Stock Exchange are required to disclose repurchases made during a given month at the beginning of the following month.4 The information disclosed to the regulators states only the number of repurchased shares for the whole month, but we also obtained a previously unused database of repurchases from the Autorité des Marchés Financiers (AMF), an organization that has the same role as the SEC in the U.S. This database includes the trading dates, the number of shares acquired and the price paid per share. Thus it is possible to analyze the level of compliance with current repurchase regulations for all repurchases, avoiding the self-selection bias inherent to voluntarily disclosed survey data. Given the similarities of French repurchase regulations to U.S. regulations and empirical results, our data have implications for projecting the effects of the 2004 amendments in the U.S. French regulators have also initiated several investigations and lawsuits against companies and their management. A well-known case concerned the massive stock repurchases by Vivendi just after September 11, 2001.5 These buybacks did not comply with the volume restriction specified in French repurchase regulations, and also took place during the 15 days prior to publication of the company’s half-yearly results, a prohibited period. These activities resulted in a legal inquiry that led to executives being placed under investigation, an indication that non-compliance with share repurchase regulations is a risky strategy for management.
In this paper, we analyze French businesses’ compliance with the main share repurchase rules. Using data from Euronext Paris (the Paris Stock Exchange), we study repurchase regulation compliance on the Paris Stock Exchange for 806 repurchase programs and 36,848 repurchase trading days over the period 2000-2002. First, we examine whether the companies comply with the maximum repurchase price and the maximum percentage of capital for repurchase, as established by shareholders at the annual meeting. We show that most firms comply with these constraints. We also observe that most firms set limits that are greater than the requirements for their share repurchase programs. The few violations we find relate to companies that set limits that are stricter than the average.
We then study two of the main features of French share repurchase regulations, a limit on volume (repurchases must not exceed 25% of the reference volume for each trading day), and a rule prohibiting repurchases during the 15 days preceding publication of earnings results. We find that 79% of firms violate the volume rule in at least one repurchase day over the period 2000-2002, and 69% break the rule for more than 5% of repurchase days. This finding primarily applies to the smallest and least liquid firms. Only 13.89% of CAC40 companies break the rule for more than 5% of repurchase days. 70% of repurchasing companies bought back stock at least once during a non-trading window, just before announcing their results, and this non-compliance covers a total of 5.64% of repurchase trading days. We conclude that French publicly traded companies do not always comply with share repurchase regulations, and that violations are particularly frequent for companies listed on the cash-only market.
We then address related issues including whether there are negative consequences of rule violations on equity market liquidity. We analyze the differing impact of repurchases on market liquidity, according to their compliance or non-compliance with regulations and show that firms listed on the cash-only market, which are responsible for most of the regulation violations, are also the companies whose liquidity is most adversely affected by these violations. For companies on the more liquid market segments of the exchange, non-compliance with regulations appears to have little impact on liquidity.
The paper is organized as follows. In Section 2, we describe the repurchase regulation environment of the Paris Stock Exchange. In Section 3, we describe the data and methodology. The Section 4 analyzes firms’ compliance with the terms of their programs as adopted at the general shareholders’ meeting, and external regulations. In the Section 5, we measure the consequences of non-compliance on stock liquidity. Section 6 summarizes and concludes the paper.
2. Paris repurchase regulation environment
2.1. Euronext Paris market structure
Euronext Paris is an electronic limit order market. There are two major mechanisms for trades: one, continuous trading, for the more actively traded stocks, and two, a double auction market for the less liquid stocks. A description can be found in Biais, Hillion, and Spatt (1999). A call auction determines the opening and closing price in the continuous market. Deferred settlement is possible for a subset of the more liquid shares, that is, the market segment called the “service à réglement différé” or SRD. For all other shares, only cash trading is possible.
Euronext Paris offers substantial transparency. The five best bid/ask limits (price and quantity) in the order book are publicly released and members have access to all orders outstanding in the book, although the identity of the broker is not shown.
Over the period of this study, transactions on a separate regulated block trades market were possible only for a small number of shares. Shares listed on the auction market were not eligible.6 An ordinary block could be traded within a price range extended to approximately
the weighted average price of the five best-price limits. Off-hours transactions are also possible for all shares. Transactions made outside the trading hours are executed at a price within a range of 1% around the last traded price.
2.2. Repurchase regulation environment
The law of July 2, 1998 authorizes open market stock repurchases up to the limit of 10% of capital and over a maximum time period of 18 months. The objectives and terms of the open market stock repurchase are defined at the annual general shareholders' meeting. For each 24-month period, subject to authorization by shareholders, shares representing up to 10% of existing capital can be cancelled. Within the 10% limit, firms can also use the acquired shares to grant shares or options to their employees, stabilize stock prices, exchange stocks as part of merger and acquisition transactions, reduce or eliminate dilution related to conversion of convertible bonds, or hold the shares as treasury stock. Once a French company’s repurchase program is approved by the shareholders, a registration statement is issued to obtain approval by the AMF. No subsequent announcement of the company’s intention to repurchase shares is required before it proceeds with the buybacks.
In the U.S., the only guide for executing open market repurchases is the SEC’s "safe harbor" Rule 10b-18, which describes a code of conduct that, if followed, protects the corporation against share price manipulation charges based on the timing or price of repurchases. It is commonly believed by traders, the SEC, and the stock exchanges that the safe harbor rule is followed by most repurchasing firms (Cook, Krigman and Leach, 2003). Rule 10b-18 was modified in December 2003. Although French regulations are broadly similar to those in the U.S., there are some differences. Table 1 compares French rules, U.S. rules until December 2003, and U.S. rules after the 2003 amendments.
Insert Table 1 here
3. Data
We use the Euronext intraday database. Our dataset contains a time-stamped record of every transaction and order submitted to the market from January 2000 to December 2002 for 918 French firms. These data include transaction prices, volumes, and the best limits of the order book (bid and ask prices, and bid and ask size), as well as market capitalization. All data are stamped to the nearest second.
We also use data from the AMF, which provides daily repurchases made by any firm listed on the Paris Stock Exchange from January 2000 to December 2002. The data include the name of the repurchasing company, the date, the number of shares repurchased, the share price, and the daily total repurchase value. To be retained in the final sample, we require an exact reported date for the repurchase, a reported repurchase price higher than the minimum and lower than the maximum trading price that day, and a quantity repurchased lower than the total quantity traded on the exchange. Our final sample consists of 352 firms and 36,848 repurchase trading days over the 36-month period of study.
When a French firm plans to repurchase shares, the shareholders’ meeting must approve the terms of the repurchase program, and a registration statement must be issued for the program’s approval by the AMF. Repurchases must subsequently respect the terms of the repurchase program and comply with repurchase regulations. To examine the compliance of repurchases with the program terms, we manually collected all repurchase programs approved by the AMF over the period 1998-2002 from data published on the AMF website. A total of 1,578 repurchase programs were identified. Since repurchase programs can last no longer than
18 months, all identified repurchases in the period 2000-2002 belong to one of these programs.
We then identified each repurchase with the relevant authorized program. Of the 36,848 repurchase days reported for the period 2000-2002, no association with a repurchase program could be identified in 1,420 cases, for 40 stocks, covering all repurchases for 13 of those 40. Table 2 shows the number of programs and their duration and terms, for the whole sample and for subsamples by market (CAC40 index shares, non-CAC40 SRD (deferred settlement facilities) shares, cash-only shares).
Insert Table 2 here
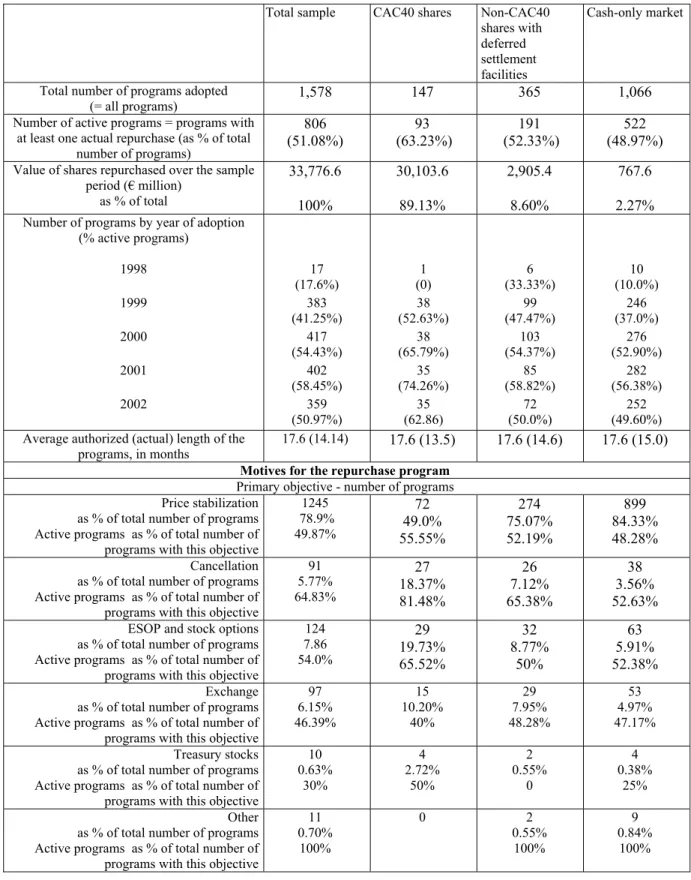
These data clearly indicate that authorization of a program does not entail a commitment to actually repurchase shares. Of the 1,578 programs, 806 (51.08%) are followed by one or more buyback transactions. We call these programs active programs. There are 147 programs (of which 63.23% are active programs) adopted by CAC40 companies, 365 (of which 52.33% are active programs) by non-CAC40 SRD companies, and 1,066 programs (of which 48.97% are active programs) by companies belonging to the cash-only market. CAC40 firms accounted for 89.13% of the total value repurchased.
The distribution of programs by year is stable over time, as is the number of active programs. The year 1998, when the law authorizing open market repurchases in France was enacted, is an exception.
When initially approved by the shareholders, most programs have durations close to the maximum, 18 months, since average duration is 17.6 months. However, the true duration of a program is shorter, as the adoption of a new program, which generally takes place at the annual shareholders’ meeting, cancels the previous program. Given this practice, actual duration of French share repurchase programs is 14.14 months on average.
The registration statements generally list a number of objectives. We analyze the first objective stated by companies, on the hypothesis that objectives are presented in order of priority. For 78.9% of the programs, price stabilization is stated as the first objective. The next most frequent objectives are to acquire shares for employee stock ownership or option plans (7.86%), exchanges of shares, mainly in response to the conversion of convertible bonds (6.15%), or for cancellation (5.77%). The largest firms have the most widely-varying objectives. For 49.0% of CAC40 companies, price stabilization is their first objective, while 19.73% name stock grants or options as the first objective and 18.37% list cancellation. On
average, 51% of programs are actually implemented, but this proportion rises to 64.83% for programs whose primary objective was stock cancellation (and reaches 81.48% for CAC40 companies’ programs adopted for cancellation).
In value terms, programs that listed stock price stabilization as the first objective account for 46.08% of the value repurchased. The other objectives correspond to lower amounts, with cancellation accounting for 16.93% of the total repurchased in terms of value, shares for employees 18.44%, and exchanges of shares 17.89%. For smaller non-CAC40 SRD companies (cash-only market companies), price stabilization corresponds to 60.19% (64.84%) of the value of repurchases.
Table 3 compares the characteristics of firms that have no repurchase program, firms that adopt a program but do not implement it over the period, and firms that adopt a program and proceed with repurchases at least once over the period studied.
Insert Table 3 here
Companies that make actual repurchases are the firms largest in market value, are involved in the most transactions, are more liquid, and are less volatile than those with no repurchase program, or those that adopt a program but do not use it. Their average market capitalization is €3,148 million, compared to €348.87 million (€974.52 million) for firms with no repurchase program (with an inactive program). The relative spread at opening is 2.31% for repurchasing firms, 5.52% for those with no repurchase program, and 3.46% for those with an inactive program. The breakdown of the sample shows that the vast majority of CAC40 companies (82.6%) repurchase shares at least once over the period. In contrast, companies listed on the cash-only market either have no repurchase program (35.5%), or an inactive program (29.4%); only 35.1% repurchase shares over the period. Non-CAC40 SRD companies fall between these two profiles with 59.5% that repurchase shares, and 31.6% that adopt a program but do not implement it.
Finally, we collect the dates of annual and quarterly results announcements for the 352 companies with at least one repurchase over the period 2000-2002. Our source is the Europresse database, which contains all dispatches by Agence France Presse and archives for all of France’s main daily newspapers, including the two major business dailies, La Tribune and Les Echos. We confirm 1,186 announcement dates. These data are used to verify whether
firms comply with the ban on share repurchases in the two weeks preceding earnings announcements.
4. An analysis of whether repurchases comply with their program terms and the regulations
A French company can only repurchase its own shares once a registration statement has been approved by the AMF, stating the terms authorized at the shareholders’ meeting. We verify that actual repurchases match the content of the registration statement, and examine compliance with regulations on volumes and non-trading periods related to possession of information not yet in the public domain.
4.1.Compliance with the content of the registration statement
The registration statement sets forth:
- the objectives of the repurchase program
- the date of the shareholders’ meeting that approved the program - the maximum purchase price7
- the maximum percentage of capital that can be repurchased - the duration of the authorization
- the practical conditions of the repurchase (whether or not block purchases are allowed)
- how the repurchase will be financed (debt or equity financing)
- whether or not the main shareholders intend to participate in the stock repurchase or not
We examine whether the repurchases comply with the authorized programs on two points: the maximum percentage capital allowed for repurchases, and the maximum repurchase price. The other points in the registration statement either correspond mechanically (for example the date of the shareholders’ meeting or the duration of the authorization), or are difficult to verify against public data (for example the fact that a major shareholder participates in share repurchase, or the financing method).
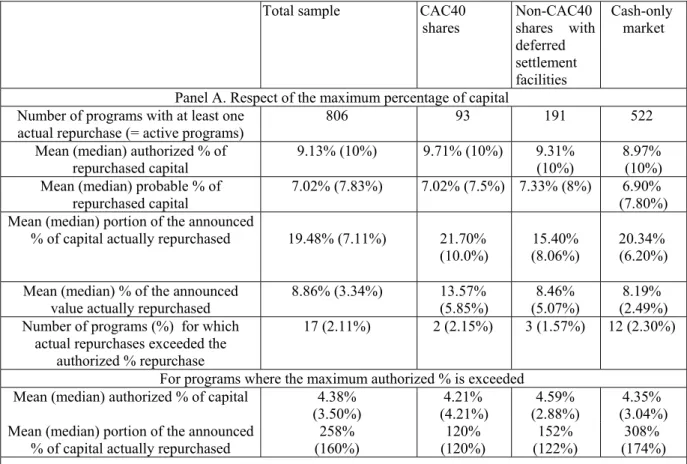
Table 4, panel A, shows the percentage of capital the firm is authorized to repurchase under the approved program, and the percentage of actual repurchases associated with that program. The authorized limit is typically 10% of the capital, which is the maximum allowed by law. On average, the programs set the repurchase limit at 9.13% of capital. This percentage is similar for both markets, amounting to 9.71% for CAC40 companies and 8.97% for cash-only market companies. The program also stipulates the probable percentage repurchased, excluding treasury stock (French firms are prohibited from holding more than 10% of their own shares). The average (median) percent repurchased is 7.02% (7.83%). These authorized repurchase percentages represent a ceiling which firms rarely reach. Average (median) repurchases are 19.48% (7.11%) of the authorized percentage capital. Turning to the authorized repurchase value, i.e. the number of shares the firm is authorized to repurchase multiplied by the maximum purchase price, actual repurchases represent an average (median) 8.86% (3.34%) of the authorized amount. This smaller proportion in value terms is due to the maximum purchase price being generally fixed well above the market price, and the fact that the market was generally declining over the period of our study.
In 17 cases the authorized repurchase percentages were exceeded. Most of these programs (12) involved the smallest cash-only market companies, and only 2 were CAC40 companies. All “excess” purchases were by companies whose program authorized repurchase of only 4.38% of total shares, on average, which is well below the legal 10% limit and the overall average across all programs, 9.13%. The average percentage repurchased under these 17 programs is 258% of the authorized percentage. Again, excess purchases are mainly concentrated in the programs of firms listed on the cash-only market (307%), whereas for CAC40 companies, the excess is more limited (120% of the authorized percentage).
Based on this first criterion, we conclude that the vast majority of companies comply with the terms of their repurchase program.
In Table 4, panel B, we analyze the maximum price at which shares can be repurchased over the duration of the program. The maximum price stated in the registration document is adjusted to correct for the effects of stock splits and rights offerings subsequent to the document’s issuance date. The maximum repurchase price is set fairly broadly, corresponding to an average of 2.36 times the share price at the date the program is approved, which leaves considerable room for share price rises. On average, the lowest (highest) actual repurchase price is 0.45 (0.62) times the maximum authorized price.
For the full sample, 34 programs (4.22% of the total) have at least one repurchase above the maximum authorized price, mostly concentrated on the cash-only market (30 cases). In
these 34 programs, an “excess price” purchase took place on average within 13.44 days (43.37% of repurchase days), again mainly on the cash-only market (15 days involving excess price repurchases on average, compared to only one for the two CAC40 companies that exceeded their authorized price). This price limit non-compliance occurs in programs where the ratio of the maximum authorized price to the share price at the program adoption date is significantly lower than the same ratio for companies that comply with the limit (1.59 compared to 2.39). The frequency of price limit violations rises as companies are more restrictive in their program terms.
Our results indicate that most companies comply with the maximum purchase price constraint. However, since the stock market was in decline during the period studied, the price constraint was less restrictive than it would have been in a bullish market.
We conclude that for the above two points the majority of companies respect the criteria set forth in the registration statement approved by the AMF when their share repurchase program is adopted. The few exceptions mainly involve companies that were more restrictive than average in their repurchase authorizations.
Insert table 4 here
4.2. Compliance with volume regulations
AMF regulations require that the purpose of companies’ trading in their own shares must not be to obstruct normal market operation and mislead third parties. Transactions representing up to 25% of the average daily trades through the central order book over a reference period prior to the transaction are presumed to be legitimate. Up to December 22, 2000, this reference period was 5 trading days for SRD shares and 30 trading days for other shares. Since December 22, 2000, the period has been shortened to three days for SRD shares and 15 days for other shares. The 25% limit does not apply to block trades or transactions undertaken on the issuer’s behalf by an investment service provider under a liquidity contract in conformity with a code of professional ethics, which companies have been able to employ since April 10, 2001. This code requires that the contract must guarantee the intermediary is independent of the issuer, identify the operations carried out in execution of the contract, have a defined scope and objective, govern exchanges of information between the issuer and the intermediary, stipulate how the market is informed of the presence of a liquidity contract, the resources allocated, and the names of the contracting parties. Moreover, in France the basis
for calculation of the maximum 25% of average daily trades over a reference period includes the company’s trades in its own shares. In the U.S., repurchases are not included in the reference volume.
To measure repurchases in excess of the volume limit over the period 2000-2002, we identified two non-overlapping periods. The first period is January 1, 2000 to April 10, 2001, a period when liquidity contracts did not exist. The second period is April 11, 2001 to December 31, 2002, a time span during which companies could enter into a liquidity contract which exempted them from the volume limit. Repurchases made under a liquidity contract are declared in the same way as other repurchases, and are therefore included in our database. We distinguish between companies with, and without, a liquidity contract.
For each trading day, we calculate the reference volume, including only capital traded through the central order book, as prescribed in the regulations. Transactions through the block trade facility are excluded in calculating both the reference volume and the 25% limit for repurchases. However, the declared repurchases include block trades, which are not identified as such in the database. Firms’ repurchase declarations draw no distinction between repurchases through the central order book and repurchases through the block trade facility. Trades of more than the normal block amount (NBA)8 defined by Euronext can either be executed through the central order book or the block trade facility. Most transactions, even very large trades, are executed through the central order book rather than block trading facilities. Trades on the specific block trade facility (ACT system) represent on average only 11.77% of the trades through the central order book (NSC system) over the period 2000-2002.
To avoid overestimating non-compliance with the 25% rule, we calculate several ratios, to infer the portion of repurchases executed through the central order book.
- First, we assume that all repurchases are carried out through the central order book, overestimating the portion of repurchases that are central order book transactions. This repurchase/reference volume ratio provides an approximation by excess of the repurchase/reference volume ratio.
- Second, we assume maximum execution through the block trade facility. Repurchases through the central order book correspond to the total repurchases for shares not eligible for block trades, or when the repurchase volume in one trading day is lower than the NBA. When block trades are observed in a day, we consider that they are repurchase transactions and that only repurchases in excess of block trades are executed through the central order book. This calculation underestimates the portion of repurchases made through the central order book and any non-compliance with the 25% rule.
These two ratios frame the true repurchase/reference volume ratio for trades through the central order book.
Table 5 provides information about the values of repurchases, trade volumes through the central order book and the block trade facility, reference volumes and ratios regarding volume rule non-compliance for the whole sample and various subsamples, with distinctions by period and according to the presence of a liquidity contract.
Insert Table 5 here
The repurchase/reference volume ratio based on the assumption that all repurchases are executed through the central order book (maximum volume ratio) is on average 63.52%. The repurchase/reference volume ratio based on the assumption that a maximum of repurchases are carried out through the block trade facility (minimum volume ratio) is on average 8.75% for the whole sample. We base our assessment of compliance with the 25% rule using the minimum volume ratio, which is an approximate minimum estimate of the true ratio. Using this low estimate, the 25% volume rule was violated on 8,147 trading days (23% of the total). The distribution by market shows that the firms with the most non-compliance with the volume rule are the smallest and least liquid firms. For firms listed on the cash-only market, 27.11% of repurchase days violate the volume rule, while for CAC40 (other SRD) companies, only 1.82% (13.81%) of days violate the rule. Non-compliance with the volume rule does not appear to be concentrated in a small number of firms, given that 78.81% of firms do not comply with this rule on at least one repurchase day (52.77% for CAC40 companies, 74.50% for other SRD companies and 90.03% of firms listed on the cash-only market). But whereas cash-only and non-CAC40 SRD firms are broadly represented (84.19% and 62.74% respectively), only 13.89% of CAC40 firms represent more than 5% of volume rule violations. Thus, non-compliance rate for this rule is high, with only few companies showing full compliance, all the more so as the actual non-compliance rate is higher than the minimum ratio used for our calculations.
Companies that have a liquidity contract with an investment service provider are exempt from the 25% volume rule and trading by the service provider is presumed to be legitimate. To verify that the excess trades observed do not result from the existence of a liquidity contract, we divide our sample into two periods (before and after liquidity contracts were authorized), and in the second period, into firms with and without a liquidity contract. In the period covered by our study, no CAC40 company had entered into a liquidity contract. We
observe that firms with a liquidity contract break the volume rule less frequently. The non-compliant firms represent 18.15% of firms listed on the cash-only market with a liquidity contract (compared to 30.38% over the same period for firms with no liquidity contract). For non-CAC40 SRD firms, the ratio is 8.69% with a liquidity contract against 13.20% without. On average, repurchases executed under liquidity contracts are smaller in scale, as their objective is not to accumulate shares. For cash-only market companies, the average total value of shares repurchased on one repurchase day is €7,187 with a liquidity contract compared to €23,336 over the same period without a contract; for SRD companies, €18,393 and €180,778 respectively. However, the volumes traded by companies with a liquidity contract are also small, particularly for SRD firms, measures that the least liquid companies are the most likely to enter into a liquidity contract. Thus, although companies with a liquidity contract are exempt from the volume constraint, they comply with it in proportionately greater numbers.
Our results are robust and provide an approximate minimum estimate of non-compliance rates. These results can be compared to the findings of Cook, Krigman and Leach (2003), who report that 40.74% of the firms in their sample exceed the legal volume on at least one occasion. The frequency of violation is higher on the Nasdaq than on the NYSE. On the NYSE, violations represent 14% of allowed volume whereas on the Nasdaq, firms repurchase 57% more than the allowed non-block volume for a day. Although the Cook, Krigman and Leach’s (2003) results are based on a questionnaire that was answered on a voluntary basis, they find that the non-compliance rate is high. Using data from the French market, we show that the non-compliance rate is considerably higher than their estimate.
4.3. Repurchases around annual earnings results announcements
U.S. regulations on share repurchases stipulate that once private information exists, including the annual results, the company has a choice between disclosing or abstaining from repurchasing. French regulations are stricter regarding earnings results announcements, since an issuer must, without exception, abstain from trading its own shares during the 15 calendar days prior to publication of its consolidated financial statements, or annual accounts, and more generally, as in the U.S., as soon as it is in possession of insider information. We are particularly interested in this 15-day period prior to results announcements, which we call the “non-trading window”. The E.U. regulations of 2004 extend the ban on trading before results announcements to interim accounts, which were already concerned by the extension concerning possession of insider information. The AMF relaxed the rule, making it
inapplicable to trading activity on behalf of the issuer under a liquidity contract. Over the period of our study, we examine all the publication dates for annual, half-yearly and quarterly results. As in the analysis of compliance with the volume rule, the existence of a liquidity contract must be taken into account, as it generates a presumption of legitimacy for trades by intermediaries during the non-trading windows.
Over our sample period, 1,186 result announcement dates are available for companies that made at least one repurchase. Only dates falling between the first and last date (plus 15 days) of the repurchase program are selected in establishing this total. As our database on actual repurchases includes repurchases up to the end of 2002, announcements of 2002 annual results made in 2003 are not taken into account. This explains why the number of annual results announcements in our sample is lower than the number of half-yearly results announcements.
Table 6, panel A, shows the results for all years over the full sample, then by market type (CAC40 shares, non-CAC40 SRD shares, and cash-only shares). The first category, “no announcement date available”, covers firms for which there is no public report of the publication date. The second category, “no repurchase during non-trading windows”, covers firms whose publication dates are available, but with no repurchase detected during the 15-day periods prior to those dates. The third category covers firms for which at least one repurchase took place during a non-trading window.
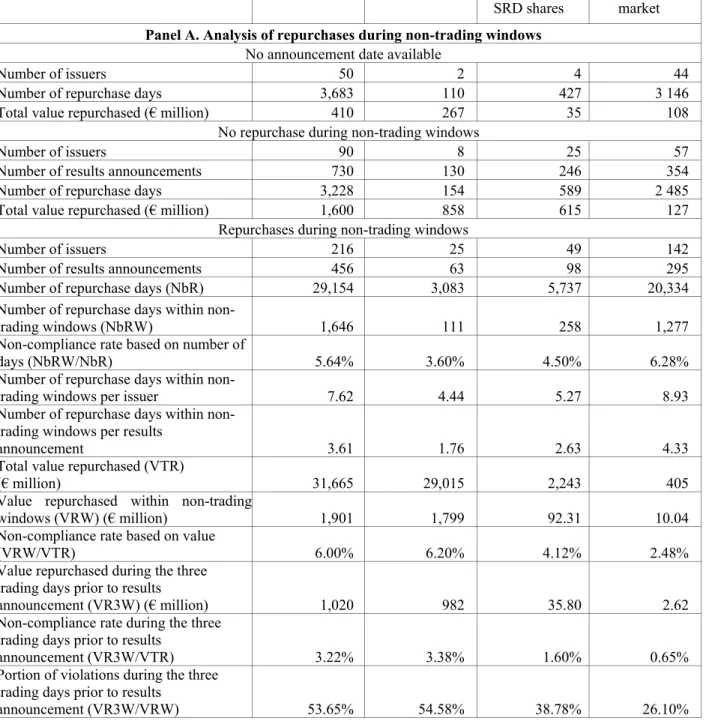
There are 352 firms which were subject to at least one repurchase between 2000 and the end of 2002. The number of observations would be higher than 352 when some companies transfer to a different market. For 50 companies, no announcement date is available. For 306 companies (86%) with at least one repurchase during the period, an announcement date is available. Of the firms with at least one announcement date available, 90 never repurchased shares during a non-trading window. Finally, 216 companies carried out at least one repurchase during a non-trading window. For each case, we calculate the number of repurchase days and the value of repurchases made during non-trading windows.
Insert Table 6 here
The percentage of repurchase days that violate the non-trading window is 5.64% for the total sample, and 3.60%, 4.50% and 6.28% for CAC40 companies, non-CAC40 SRD companies, and cash-only market companies, respectively. Firms repurchase shares, on average, in 7.62 days within a trading window (4.44 for CAC40 companies, 5.27 for
non-CAC40 SRD and 8.93 for cash-only market companies). The average number of repurchase days during non-trading windows per results announcement is 3.61 for the full sample, 1.76 for CAC40 companies and 2.63 (4.33) for non-CAC40 SRD (cash-only market) companies.
Although in terms of the number of repurchase days, the least liquid firms are the most frequent non-trading window violators, their violations involve smaller amounts. The scale of repurchases during non-trading windows as a proportion of total repurchases is higher when the firm is listed on a more liquid market. For the full sample, the value repurchased during a non-trading window is 6% of the total value repurchased, but 6.20% for CAC40 shares, 4.12% for non-CAC40 SRD shares and 2.48% for cash-only market shares. Repurchases during non-trading windows are mainly concentrated close to the announcement date, particularly for companies listed on the most liquid markets. Taking repurchases carried out during the three trading days preceding the result publication date, non-compliant purchases represent 3.22% of total repurchases, and 53.65% of all non-compliant repurchases. For CAC40 companies they total 3.38% (54.58% of non-compliant repurchases), while for cash-only market companies the figure is 0.65% (26.10% of non-compliant repurchases).
While the SEC authorized U.S. firms to repurchase their own shares after September 11, 2001, granting a presumption of legitimacy, there was no equivalent measure for French companies. Nevertheless, when we examine the repurchases in the period from September 11 to October 15, 2001 (Table 6, panel B), the violations observed are larger in scale during this period, particularly for CAC40 companies. There were 15.69% of repurchase days in that period that were within a non-trading window (11.28% for CAC40 companies, 18.77% for non-CAC40 SRD companies and 5.51% for cash-only market companies). The impact in value terms is amplified, given that 21.31% of the total amount repurchased during the post-September 11 period was repurchased during a non-trading window (21.31% for CAC40 companies, 21.99% for non-CAC40 SRD companies and 10.47% for cash-only market companies). During the post-September 11, 2001 period, 42.40% of the total amount repurchased in violation of the non-trading window rule for 2000-2002 occurred. This result occurs primarily for CAC40 companies (43.97%), whereas the September 2001 effect concerns only 13.54% (21.21%) of amounts repurchased by non-CAC40 SRD companies (cash-only market companies).
In Table 6, panel C, we take into account the impact of the existence of a liquidity contract. A company that engages an investment services provider to manage its repurchases under a liquidity contract is exempt from the ban on trading in the period before annual results announcements. We verify that the previous results do not primarily stem from the existence
of liquidity contracts, by identifying a first period unaffected by liquidity contracts, from January 1, 2000 to April 10, 2001, and a second period running from April 11, 2001 to December 31, 2002. We split the sample between firms that entered into a liquidity contract during the period and firms that did not. We show that our previous results are robust. Across the full sample, 5.41% of repurchase days were during the non-trading windows prior to the introduction of liquidity contracts. After their introduction, this proportion rises to 7.37% for firms without a liquidity contract and 10.45% for firms with a liquidity contract. These results are largely attributable to firms listed on the cash-only market, where the existence of a liquidity contract results in 10.93% of repurchases taking place during non-trading windows (7.70% of the total value of repurchases) compared to 8.63% of repurchase days (3.64% of the value) over the same period when there was no liquidity contract. Although liquidity contracts bring about an increase in repurchases during non-trading windows for cash-only market companies, this factor alone cannot explain all of our results regarding violation of the non-trading windows. We conclude that a certain number of firms that are required to abstain from trading prior to results announcement in fact violate the non-trading window.
Finally, we divide the sample according to the type of results announced: quarterly, half-yearly, or annual (Table 6, panel D). French companies are only required to publish annual results, but an increasing number are choosing to publish half-yearly results, and some, particularly the largest companies, also publish quarterly results. We analyze announcements for all quarters from 2000 to 2002. Of the 1,186 announcements, there are 129 announcements of quarterly results (34 for CAC40 companies, 61 for non-CAC40 SRD companies and 34 for cash-only market companies), 595 announcements of half-yearly results (93 for CAC40 companies, 157 for non-CAC40 SRD companies and 345 for cash-only market companies) and 462 announcements of annual results (66 for CAC40 companies, 126 for non-CAC40 SRD companies and 270 for cash-only market companies). For the full sample, the average number of repurchase days during a non-trading window is 3.61, with 1.76 for CAC40 companies, but 4.3 for cash-only companies. There are also variations in the non-compliance rate according to the type of results announced, particularly for CAC40 companies, for which the number of days of non-compliance per announcement is 2.16 (1.44) for half-yearly (quarterly) results announcements and 1.31 for annual results announcements. The fact that French regulations explicitly prohibit share repurchases during the 15 days prior to the annual results announcements, while the regulations on interim results announcements are encompassed in insider trading rules, may explain this difference. Whatever the explanation,
the number of violations observed over the period is far from negligible and we can affirm non compliance with the non-trading window rule.
5. Non-compliance with regulations and market liquidity
We examine the issue of whether non-compliance with repurchase regulations leads to a deterioration in liquidity for the relevant firm, and higher costs for investors, or whether the impact is neutral. We compare several liquidity measures for compliant repurchase days and non-compliant repurchase days, separating violations of the volume rule from violations of the non-trading window rule.
Table 7 reports summary statistics for a range of liquidity measures, divided into trade-based measures and order-trade-based measures for trading days with and without repurchases. Trade-based measures include the number of trades and the turnover ratio, i.e. the ratio between the capital exchanged during the session and the market capitalization at opening. Order-based measures include effective relative bid-ask spreads and depths. Depth at opening is measured by the natural logarithm of the sum of the value in Euros of shares posted at the best limits first observed in the order book that trading day. The bid-ask spread at opening is calculated based on the first price and the first spread available for the session immediately after the first price which is an auction price. We also report the average relative effective spread, estimated using full day data records. In this case, the number of spreads over a trading day varies according to the number of transactions. The effective spread takes into account the possibility of a transaction within the spread, although in practice this is rare on the Paris stock exchange.9 The relative effective spread relates the spread to the midpoint of the spread10: Midpoint Midpoint -Price Trade 2 Spread Relative Effective = × , where 2 Price Bid Price Ask Midpoint= + . Insert Table 7 here
The results differ according to the share’s market and the type of non-compliance. For CAC40 companies, whose non-compliance rate is low, neither the turnover ratio nor the
number of transactions, nor volatility are affected by repurchases in excess of the authorized volume. Depth and spread at opening (calculated based on the day’s first prices after the opening auction) are not significantly different between volume compliance and volume non-compliance. The only indicator of any deterioration in liquidity is the relative spread calculated based on the full day’s data record, which rises on average from 0.00172 to 0.00204. Days of non-compliance with the non-trading window by CAC40 companies display a higher turnover ratio and number of transactions. But neither depth nor the bid-ask spread are adversely affected by violations of the non-trading window rule.
For non-CAC40 SRD companies, whose violation rate, particularly on volume rules, is higher than CAC40 firm rates, no deterioration can be detected in the liquidity indicators, whether depth or spread.
However, the results are different for cash-only market firms. The depth is lower, and the spread by any measure increases when the volume rule is broken. The average spread (based on the full day’s data record) increases from 0.02589 to 0.0309. Non-compliance with non-trading windows leads to a deterioration in the spread (by any measure), but not in depth.
To verify the robustness of our results, we studied liquidity with reference to the existence or non-existence of a liquidity contract and find that results are the same. A liquidity contract does not affect the impact on liquidity of non-compliance with regulations. We also used a multiple regression to verify that our results were not related to volatility fluctuations or other characteristics of the trading day. The multiple regressions confirm that liquidity deterioration essentially concerns firms listed on the cash-only market and is more sensitive for the volume rule, independent of the other characteristics of the trading day.11
Thus, we conclude that the liquidity on days when firms do not comply with the share repurchase regulations is clearly reduced for cash-only market companies, whose liquidity is low, but liquidity is not greatly affected for more liquid companies.
6. Conclusion
Although the regulations governing stock repurchases in France are similar to those applicable in the U.S., detected verification of compliance with French regulations is made possible through access to detailed data on the repurchases actually made. We study a large sample of actual share repurchases in France by obtaining access to a private database. We are
thus able to carry out detailed verifications of compliance with the repurchase regulations using actual data rather than only survey data.
We verify that the repurchases complied with the program terms as defined by the shareholders’ meeting that authorized the repurchases, comparing the percentage of capital repurchased with the authorized percentage, and the repurchase price with the maximum authorized price. We show that most firms comply with the specifications of their programs, in large part because they generally set very broad limits. For instance, the authorized buyback percentage is often set at the legal maximum, even when the firm’s objective is well below that level. Similarly, the maximum repurchase price is often fixed at a high level that is easy to meet.
We also study compliance with the daily repurchase volume regulations (repurchases must remain below 25% of the reference volume for a given day) and the ban on repurchasing stock just before results announcements (no repurchases may take place during the 15 days preceding publication of results). While most repurchases follow these rules, few firms are in total compliance. We find that 79% of firms violate the volume rule in at least one repurchase day, and the violations concern 23% of repurchase days. Moreover, 70% of firms have repurchased shares during a non-trading window at least once, and this concerns 5.5% of trading days. We conclude that firms are not in compliance with regulations governing share repurchases, particularly the smallest and least liquid firms.
Finally, we study the impact on market liquidity of non-compliance with the regulations. Non-compliance systematically leads to a perceptible deterioration in liquidity for firms listed on the cash-only market, which are the least liquid. But the impact is less clear, and is likely to be neutral for repurchases during non-trading windows, for firms listed on the most liquid market segments.
Overall, firms are not in compliance with French regulations on open market repurchases. The least liquid firms, which show the highest non-compliance rates, are also the firms that see the liquidity of their share’s market deteriorate following a violation of the rules. Firms listed on more liquid markets display a greater degree of compliance, and their non-compliance has a smaller impact on their market’s liquidity.
References
Bainbridge, S., 2000, Insider trading, in Encyclopedia of Law and Economics III (Edward Elgar Publishing, Cheltenham, U.K.).
Bhattacharya, U., Daouk H., 2002, The world price of insider trading, Journal of Finance, 57, 75-108.
Bhattacharya, U., and Daouk H., 2005, When no law is better than a good law, Working paper, University of Cornell.
Biais, B., Hillion P., Spatt, C., 1999, Price discovery and learning during the preopening period of the Paris Bourse, Journal of Political Economy 107, 1218-1248.
Brockman, P., Chung, D.Y., 2001, Managerial timing and corporate liquidity: evidence from actual share repurchases, Journal of Financial Economics, 61 (3), 417-448
Cook, Douglas O., Laurie Krigman and J. Chris Leach, 2003, An analysis of SEC guidelines for executing open market repurchases, Journal of Business, 76 (2), 289-316
Durnev Art A. and Amrita S. Nain, 2005, The Effectiveness of Insider Trading Regulation Around the Globe, Working paper, University of Michigan
Grullon, G., Michaely R., 2004, The information content of share repurchase programs, Journal of Finance 59, 651-680.
Ikenberry, David, Josef Lakonishok and Theo Vermaelen, 2000, Stock repurchases in Canada: performance and strategic trading, Journal of Finance, 55 (5), 2373-2397.
Jeng Leslie A., Andrew Metrick and Richard Zeckhauser, 2003, Estimating the Returns to Insider Trading: A Performance-Evaluation Perspective, The Review of Economics and Statistics, 85, 2, 453-471
Kim Jaemin, Nikhil Varaiya and Ralf Schremper, 2004, Survey on Open Market Repurchase Regulations: Cross-country Examination of the Ten Largest Stock Markets, Working paper, University of San Diego
Lakonishok, J., Lee, I., 2001, Are Insider Trades Informative? Review of Financial Studies, 14, 79-111.
Meulbroek, Lisa, 1992, An empirical analysis of illegal insider trading, Journal of Finance 47, 1661-1699.
Rau, P. R., Vermaelen T., 2002, Regulation, taxes, and share repurchases in the U.K., Journal of Business, 75, 245-282.
Seyhun, H. N., 1986, Insiders’ Profits, Costs of Trading, and Market Efficiency, Journal of Financial Economics, 16, 189-213
Table 1. Main characteristics of repurchase regulations in France and the U.S.
France U.S. until end of 2003 U.S. from 2004
Broker or dealer One broker or dealer on any given day
One broker or dealer on any given day
One broker or dealer on any given day - issuers can make repurchases through an ECN Time of purchases No purchase may constitute the
opening or closing transaction of the current trading day.
No purchase may constitute the opening transaction. No purchase may occur in the 30 minutes before the end of the trading day.
No purchase may constitute the opening transaction. Issuers of more liquid securities may not purchase their securities during the last ten minutes. Issuers of all other eligible securities may not purchase their securities during the last 30 minutes. Price of purchases The purchase price must fall
within the lowest-highest price interval for the elapsed portion of the trading day.
Price limitations vary depending on whether the security is a "reported," "exchange-traded," "Nasdaq," or "other” security, and whether the bid or purchase is effected on an exchange.
The purchase price must not exceed the highest
independent bid or the last independent transaction price, whichever is higher, quoted or reported in the consolidated system.
Volume 25% of the security's trading
volume (block transactions are excluded)
25% of the security's trading volume (block transactions are excluded).
25% of the security's trading volume (block transactions are included). An amended block exception allows issuers to make one block purchase per week, provided that the issuer does not make any other Rule 10b-18 purchases on that day.
Trading volume reference
period Depending on the market and the period (from 3 days to 30 days before the repurchase day).
Four calendar weeks
preceding the repurchase day. Four calendar weeks preceding the repurchase day. Abstention period 15 days before results
announcements or if in possession of non-public information.
If in possession of non-public information, choice of
disclosing or abstaining from repurchasing.
If in possession of non-public information, choice of
disclosing or abstaining from repurchasing.
Disclosure For a given month, at the beginning of the following month.
No disclosure required. For a given quarter, at the beginning of the following quarter, disclosing figures for each month.
Table 2. Characteristics of open market share repurchase programs
This table comprises descriptive statistics for 1,578 open market share repurchase programs adopted between July 1998 and December 2002 in France. The sample is broken down into three subgroups according to settlement method (cash-only or deferred settlement) and inclusion/non-inclusion in the CAC40 index for deferred settlement companies.
Total sample CAC40 shares Non-CAC40 shares with deferred settlement facilities
Cash-only market
Total number of programs adopted
(= all programs) 1,578 147 365 1,066
Number of active programs = programs with at least one actual repurchase (as % of total
number of programs)
806
(51.08%) (63.23%) 93 (52.33%) 191 (48.97%) 522 Value of shares repurchased over the sample
period (€ million) as % of total 33,776.6 100% 30,103.6 89.13% 2,905.4 8.60% 767.6 2.27% Number of programs by year of adoption
(% active programs) 1998 17 (17.6%) (0) 1 (33.33%) 6 (10.0%) 10 1999 383 (41.25%) (52.63%) 38 (47.47%) 99 (37.0%) 246 2000 417 (54.43%) 38 (65.79%) 103 (54.37%) 276 (52.90%) 2001 402 (58.45%) 35 (74.26%) 85 (58.82%) 282 (56.38%) 2002 359 (50.97%) (62.86) 35 (50.0%) 72 (49.60%) 252 Average authorized (actual) length of the
programs, in months
17.6 (14.14) 17.6 (13.5) 17.6 (14.6) 17.6 (15.0)
Motives for the repurchase program
Primary objective - number of programs Price stabilization
as % of total number of programs Active programs as % of total number of programs with this objective
1245 78.9% 49.87% 72 49.0% 55.55% 274 75.07% 52.19% 899 84.33% 48.28% Cancellation
as % of total number of programs Active programs as % of total number of programs with this objective
91 5.77% 64.83% 27 18.37% 81.48% 26 7.12% 65.38% 38 3.56% 52.63% ESOP and stock options
as % of total number of programs Active programs as % of total number of programs with this objective
124 7.86 54.0% 29 19.73% 65.52% 32 8.77% 50% 63 5.91% 52.38% Exchange
as % of total number of programs Active programs as % of total number of programs with this objective
97 6.15% 46.39% 15 10.20% 40% 29 7.95% 48.28% 53 4.97% 47.17% Treasury stocks
as % of total number of programs Active programs as % of total number of programs with this objective
10 0.63% 30% 4 2.72% 50% 2 0.55% 0 4 0.38% 25% Other
as % of total number of programs Active programs as % of total number of programs with this objective
11 0.70% 100% 0 2 0.55% 100% 9 0.84% 100%
Primary objective - Value of shares repurchased per objective,in € million and as % of the total value of shares repurchased Price stabilization 15,565 46.08% 13,317 44.24% 1,748 60.19% 498 64.84% Cancellation 5,718 16.93% 5,318 17.67% 317 10.92% 83 10.81% ESOP and stock options 6,230 18.44% 5,639 18.73% 509 17.53% 82 10.68% Exchange 6,042 17.89% 5,692 18.91% 266 9.16% 84 10.94% Treasury stocks 138 0.41% 137 0.46% 0 0.00% 1 0.13% Other 84 0.25% 0 0.00% 64 2.20% 20 2.60%
Table 3. Characteristics of repurchasing firms
This table contains all the shares and similar securities listed in Paris on the regulated Euronext markets between January 2000 and December 2002, including those newly listed or delisted during the period. Shares for which no repurchase program was adopted are classified under "No repurchase program". Those for which a repurchase program was adopted, but no repurchase occurred over the period are classified under “inactive repurchase program”, while those for which there was at least one repurchase transaction are classified under "Repurchase". The averages of all daily observations are shown in the table. The total number of shares is 924. The number of observations (column N) corresponds to the number of firm-trading days available. The sample is broken down by settlement method (cash-only or deferred settlement) and inclusion/non-inclusion in the CAC40 index for deferred settlement companies. The last columns provide parametric and non parametric tests to compare firms which have repurchased at least once and, respectively, those with no repurchase program and those which adopted a program, but made no repurchases.
No repurchase program Inactive repurchase program Repurchase Repurchase vs no repurchase
Repurchase vs inactive program
Mean Median N Mean Median N Mean Median N p-values from Student test (median test) p-values from Student test (median test) Market capitalization (€ million) 348.87 31.10 116,337 974.52 65.86 151,863 3,148.0 183.7 253,531 <0.0001
(<0.0001) (<0.0001) <0.0001 Value Weighted Average Price (central order book),
(in €) 72.78 15.64 116,337 45.03 20.86 151,880 76.75 41.46 252,317 (<0.0001)0.0004 (<0.0001) <0.0001 Relative spread (average at opening) 5.52% 3.14% 101,383 3.46% 1.95% 143,056 2.31% 1.28% 243,735 <0.0001
(<0.0001) (<0.0001) <0.0001 Turnover (central order book daily average in €) 521,739 5,106 116,354 3,429,425 22,824 151,880 9,543,192 57,268 253,538 <0.0001
(<0.0001)
<0.0001 (<0.0001) Depth (central order book daily average at opening
in €) 83,061 4,837 106,838 176,705 6,215 147,281 171,178 9,230 249,042 (<0.0001)<0.0001 (<0.0001) 0.7924 Volatility (average annualized daily estimation) 63.58% 51.10% 111,603 67.46% 53.81% 150,839 48.80% 40.22% 252,870 <0.0001
(<0.0001) (<0.0001) <0.0001 Volatility (average annualized hourly estimation) 117.10% 87.93% 46,434 103.47
% 76.20% 102,433 72.61% 54.00% 203,066 (<0.0001)<0.0001 (<0.0001) <0.0001 Volatility (average annualized quarter hourly
estimation) 164.14% 111.42 % 33,138 134.21 % 91.13% 79,963 96.27% 62.45% 161,797 <0.0001 (<0.0001) <0.0001 (<0.0001) Number of transactions (daily average) 63 5 116,354 175.4 14 151,880 337 21 253,538 <0.0001
Breakdown of the number of shares by market model
A share may change categories during 2000-2002, and in such cases it is counted more than once, which explains the higher number of shares in the breakdown by market model.
Total number of shares
Total number of shares 308 305 436 1,049
Number of CAC40 index shares in each category (in
% of total number of CAC40 index shares) 2 (4.3%) 6 (13%) 38 (82.6%) 46 Number of deferred settlement facilities (SRD)
shares in each category (in % of total number of SRD shares)
17 (8.9%) 60 (31.6%) 113 (59.5%) 190
Number of cash-only market shares in each category
Table 4. Compliance with the terms of the program registration statement
This table contains a detailed analysis of the compliance with the rules stipulated in the registration statement authorizing the repurchase program, for the 806 programs which saw at least one actual repurchase over the period 2000-2002 (active programs). Two constraints are taken into account: the maximum percentage of capital the firm is authorized to repurchase, and the maximum repurchase price allowed.
Total sample CAC40
shares Non-CAC40 shares with deferred settlement facilities
Cash-only market
Panel A. Respect of the maximum percentage of capital Number of programs with at least one
actual repurchase (= active programs) 806 93 191 522
Mean (median) authorized % of
repurchased capital 9.13% (10%) 9.71% (10%) 9.31% (10%) 8.97% (10%) Mean (median) probable % of
repurchased capital 7.02% (7.83%) 7.02% (7.5%) 7.33% (8%) (7.80%) 6.90% Mean (median) portion of the announced
% of capital actually repurchased 19.48% (7.11%) 21.70%
(10.0%) (8.06%) 15.40% 20.34% (6.20%) Mean (median) % of the announced
value actually repurchased 8.86% (3.34%) 13.57% (5.85%) (5.07%) 8.46% (2.49%) 8.19% Number of programs (%) for which
actual repurchases exceeded the authorized % repurchase
17 (2.11%) 2 (2.15%) 3 (1.57%) 12 (2.30%) For programs where the maximum authorized % is exceeded
Mean (median) authorized % of capital 4.38%
(3.50%) (4.21%) 4.21% (2.88%) 4.59% (3.04%) 4.35% Mean (median) portion of the announced
% of capital actually repurchased
258% (160%) 120% (120%) 152% (122%) 308% (174%) Panel B. Respect of the maximum repurchase price
Mean (median) maximum repurchase price fixed in the registration statement / price at the program adoption date
2.36 (1.77) 1.55 (1.49) 1.97 (1.67) 2.61 (1.93) Mean (median) actual minimum
repurchase price / price fixed in the registration statement
0.45 (0.45) 0.54 (0.57) 0.47 (0.49) 0.43 (0.40) Mean (median) actual maximum
repurchase price / price fixed in the registration statement
0.62 (0.62) 0.72 (0.73) 0.67 (0.66) 0.61 (0.58) Number of programs where the
maximum authorized price was exceeded 34 (4.22%) 2 (2.15%) 2 (1.05%) 30 (5.75%) For programs where the maximum authorized price is exceeded at least once
Average number of repurchase days (as % of the number of repurchase days for a program) when the maximum authorized price was exceeded
13.44
(43.37%) (7.60%) 1 (7.85%) 1.50 (48.12%) 15.0 Mean (median) maximum repurchase
price fixed in the registration statement / price at the program adoption date
Table 5. Volume rule compliance
The sample consists of 352 firms listed on the Paris market which repurchased their own shares during at least one trading day between January 2000 and December 2002. The sample is broken down by settlement method (cash-only or deferred settlement (SRD)) and inclusion/non-inclusion in the CAC40 indexfordeferred settlement shares. For each subsample, we distinguish between the periods before and after April 10, 2001 (when the use of liquidity contracts was authorized). For the second period, we split our subsample further to separate firms with and without a liquidity contract.
Total sample,
over 2000-2002
CAC40 shares Non-CAC SRD shares Cash-only market
Before April 10, 2001 After April 10, 2001 Without liquidity contract After April 10, 2001 With liquidity contract Before April 10, 2001 After April 10, 2001 Without liquidity contract After April 10, 2001 With liquidity contract Before April 10, 2001 After April 10h, 2001 Without liquidity contract After April 10, 2001 With liquidity contract Volume statistics Value of shares repurchased over the sample period (€ million)
33,776 10,880 19,263 1,444 1,521 39 309 291 39
Total number of repurchase days
35,420 1,394 1,954 3,356 3,394 725 8,068 12,464 5,490
Average (median) daily turnover - central order book, in € 10,122,287 (57,966) 79,112,029 (45,577,422 ) 94,365,615 (51,749,599 ) 5,053,418 (1,206,358) 4,243,158 (1,262,902) 692,304 (291,989) 206,486 (22,681) 90,866 (13,970) 86,118 (19,800)
Average (median) daily turnover - block market, in €
1, 355,541
(0) 7,853,421 (874,556) (2,985,257) 14,737,327 397,713 (0.0) 771,522 (0.0) 64,065 (0.0) 15,431 (0.0) 40,076 (0.0) 19,323 (0.0)
Average (median) euro value of shares repurchased by a firm on one repurchase day
916,984 (7,047) 7,804,926 (3,060,305) 9,858,036 (3,786,240) 430,270 (71,300) 448,116 (73,218) 53,806 (12,238) 38,346 (5,932) 23,336 (2,749) 7,187 (1,774)
Average (median) reference volume in € 169,836 (3,320) (476,101) 791,173 (1,025,890) 1,666,122 No firm 127,888 (19,400) (30,520) 180,778 (10,020) 18,393 (1,210) 5,088 5,128 (956) (1,708) 5,026
Volume condition compliance Average (median) maximum
repurchase/reference volume ratio 0.6352 (0.1059) 0.0948 (0.0627) 0.1033 (0.0560) 0.3295 (0.1208) 0.2929 (0.082) 0.1196 (0.034) 0.7195 (0.1577) 1.1174 (0.1535) 0.2098 (0.0548)
Average (median) minimum repurchase/reference volume ratio 0.0875 (0) 0.0104 (0) 0.0067 (0) 0.0410 (0) 0.0360 (0) 0.0747 (0.007) 0.0865 (0.0) 0.1483 (0..0) 0.0804 (0.0)
31 (2.22%) 30 (1.54%) 521 (15.52%) 448 (13.20%) 63 (8.69%) 2,277 (28.22%) 3,786 (30.38) 991 (18.15%)
Number (%) of trading days not in compliance according to minimum ratio
8,147 (23%)
61 (1.82%) 1032 (13.81%) 7054 (27.11%)
Percentage of firms with at least one volume rule violation based on minimum ratio
78.81% 52.77% 74.50% 90.03%
Percentage of firms with more than 5% of non-compliant repurchase days based on minimum ratio
Table 6: Repurchases during non-trading windows
The sample consists of 352 firms listed on the Paris market which repurchased their own shares during at least one trading day between January 2000 and December 2002. The sample is broken down by settlement method (cash-only or deferred settlement) and inclusion/non-inclusion in the CAC40 indexfor deferred settlement shares. The sum of the number of shares in the three subpanels is higher than 352 because some shares changed market type during the period. The non-trading window is the 15 calendar days prior to the result publication date. 1,186 dates of results
announcements have been analyzed. Panel A shows the results for the total sample. The first category, “no
announcement date available” covers firms for which no result publication date could be found in the press. The second category, “no repurchase during non-trading windows”, covers firms whose result announcement dates are available, but for which no repurchase was detected during the 15-day periods prior to those dates. The third category covers firms for which at least one repurchase took place during a non-trading window.
Panel B shows the results for the period between September 11 and October 15, 2001. Panel C shows the results according to the existence of a liquidity contract. Panel D shows the results by type of financial results announced (annual, half-yearly, quarterly).
Total sample CAC40 shares Non-CAC40
SRD shares Cash-only market
Panel A. Analysis of repurchases during non-trading windows
No announcement date available
Number of issuers 50 2 4 44
Number of repurchase days 3,683 110 427 3 146
Total value repurchased (€ million) 410 267 35 108
No repurchase during non-trading windows
Number of issuers 90 8 25 57
Number of results announcements 730 130 246 354
Number of repurchase days 3,228 154 589 2 485
Total value repurchased (€ million) 1,600 858 615 127
Repurchases during non-trading windows
Number of issuers 216 25 49 142
Number of results announcements 456 63 98 295
Number of repurchase days (NbR) 29,154 3,083 5,737 20,334 Number of repurchase days within
non-trading windows (NbRW) 1,646 111 258 1,277
Non-compliance rate based on number of
days (NbRW/NbR) 5.64% 3.60% 4.50% 6.28%
Number of repurchase days within
non-trading windows per issuer 7.62 4.44 5.27 8.93
Number of repurchase days within non-trading windows per results
announcement 3.61 1.76 2.63 4.33
Total value repurchased (VTR)
(€ million) 31,665 29,015 2,243 405
Value repurchased within non-trading
windows (VRW) (€ million) 1,901 1,799 92.31 10.04
Non-compliance rate based on value
(VRW/VTR) 6.00% 6.20% 4.12% 2.48%
Value repurchased during the three trading days prior to results
announcement (VR3W) (€ million) 1,020 982 35.80 2.62
Non-compliance rate during the three trading days prior to results
announcement (VR3W/VTR) 3.22% 3.38% 1.60% 0.65%
Portion of violations during the three trading days prior to results
Panel B. Repurchases during non-trading windows between September 11 and October 15, 2001
Number of repurchase days (NbR) 1600 195 389 1016
Number of repurchase days within
non-trading windows (NbRW) 251 22 73 156
Non-compliance rate based on number of
days (NbRW/NbR) 15.69% 11.28% 18.77% 5.51%
Total value repurchased (VTR)
(€ million) 3,782 3,597 165 20.35
Value repurchased within non-trading
windows (VRW) (€ million) 806 791 12.5 2.13
Non-compliance rate based on value
(VRW/VTR) 21.31% 21.99% 7.57% 10.47%
VRW (non-trading windows of September
2001)/VRW (total non-trading windows) 42.40% 43.97% 13.54% 21.21%
Panel C. Repurchases during non-trading windows, by period and existence of a liquidity contract
Before April 10, 2001 Non-compliance rate based on number of
days (NbRW/NbR) 5.41% 4.83% 4.56% 6.02%
Non-compliance rate based on value
(VRW/VTR) 8.47% 8.71% 5.76% 4.17%
After April 10, 2001 Without liquidity contract Non-compliance rate based on number of
days (NbRW/NbR) 7.37% 4.22% 5.44% 8.63%
Non-compliance rate based on value
(VRW/VTR) 6.73% 6.81% 5.86% 3.64%
After April 10, 2001 With a liquidity contract Non-compliance rate based on number of
days (NbRW/NbR) 10.45% No firm 6.93% 10.93%
Non-compliance rate based on value
(VRW/VTR) 6.47% No firm 4.72% 7.70%
Panel D. Repurchases during non-trading windows, by type of results announcement
Total number of results announcements Quarterly (Q1 and Q3) Half-yearly Annual 1,186 129 595 462 193 34 93 66 344 61 157 126 649 34 345 270 Total number of results announcements
with non-trading window repurchase 456 63 98 295
Quarterly (Q1 and Q3) 40 16 15 9
Half-yearly 260 31 57 172
Annual 156 16 26 114
Number of repurchase days within the non-trading window Quarterly (Q1 and Q3) Half-yearly Annual 1,646 89 1020 537 111 23 67 21 258 33 153 72 1,277 33 800 444 Number of repurchase days within the
non-trading window per results announcement Quarterly (Q1 and Q3) Half-yearly Annual 3.61 2.23 3.92 3.44 1.76 1.44 2.16 1.31 2.63 2.20 2.68 2.77 4.33 3.67 4.65 3.89