INNOvaTION IN The hOusehOLD
BusINess aND INfOrmaL secTOrs
La hai anh
Vietnam is at a crossroads. Over the past 30 years political and economic reforms have fulfilled their tasks: significant economic growth, a transition from low to lower-middle income status and remarkable poverty reduction. However, signs of a growth slowdown have recently emerged in Vietnam as the drivers of growth and poverty reduction have run out of steam and Vietnam is facing new challenges. Along with population ageing and premature deindustrialization challenges1 expected to take place in Vietnam (Rodrik, 2014), boosting productivity is the only way for Vietnam to return to a high-growth trajectory.
In the new global context of the fourth industrial revolution,2 the single most important driver of productivity in Vietnam is innovation. The economic exploration of innovation started at the beginning of the 20th century, and the dynamics of economic growth back then cannot be explained by the production function models of Solow (1956) and Swan (1956). Innovation and technical change are considered a potential way that nations can enhance their competitive positions in global value chains (Gereffi et al., 2005).
Innovation is a complex activity which is difficult to precisely define. There are va-rious definitions of the word innovation, which derives from the Latin innovatio, i.e. the creation of something new. The diversity of definitions lies in the different purposes of examining this phenomenon (Johannessen et al., 2001). Schumpeter (1934) defined innovation as the introduction of new or improved products/production processes, the development of new sales/supply markets, and the restructuring of a company. Creating new products, improving existing products and production processes, and 1. Premature deindustrialization was shown to impede growth and delay convergence with the advanced
economies.
2. The fourth industrial revolution is characterised by the increasing digitization and interconnection of products, value chains and business models.
utilising new tools are not only a reaction to fierce competition among producers. They also characterise a quick response to market demand and supply (Bryceson, 2002; Kraemer-Mbula and Wamae, 2010) to overcome shortcomings of the economy and to adapt foreign products to local conditions. These kinds of innovations can be fostered across all sectors of an economy by using the internet. Firms can use the internet for marketing or advertising to attract new customers and services as well as to support existing ones (Kalakota and Whinston, 1997).
Although innovation is the single most important driver of productivity after economic growth, this system in developing countries is poorly constructed and very fragmen-ted (Aubert, 2005). In Vietnam, a weak national innovation system,3 a loose relationship between science and enterprises, a lack of international linkages (Nguyen et al., 2013; OECD, 2013), and an inherent internal incapability hinders firms from developing new-to-the-world innovations. A report by CIEM, the DOE and the GSO (Tarp and Rand, 2012) has shown that in 2011, only 800 out of the nearly 8,000 surveyed Viet-namese SMEs conducted R&D, and these firms preferred to adapt outside technology brought in from external sources.
Studies on innovation in Vietnam are rare, and the characteristics of innovation at the company level in the country are still unclear, especially for the household business sector. In spite of accounting for around one third of the total employment in Vietnam (see Chapter 2), very little is known about the extent to which new processes, products and other types of innovations have been applied in this sector, what role the internet plays in fostering these types of innovation among HBs, and how large innovation contributes to business productivity. This chapter represents one of the first attempts to answer these questions.
The chapter gives an overall picture of the utilisation of innovation among household businesses in Vietnam and compares informal and formal HBs in rural and urban areas as well as in the three main industrial sectors: manufacturing and construction, trade and service. Innovation is measured by various indicators, including those defined by Schumpeter (1934): (1) the introduction of a new product or the improvement of an existing one; (2) the introduction of a new production process/technology and the improvement of an existing one, (3) the prospect of new customers, and (4) the utilisation of new suppliers for cost reduction purposes. These indicators are conside-red in association with internet usage and future plans for strengthening manpower 3. This system is characterised by limited business funding for research and development activities.
or business activities. All the innovation indicators are observed in relationship with labour productivity, which is measured as value added per worker. The chapter also investigates the nexus between the utilisation of innovation, characteristics of house-hold businesses and their owners, and productivity.
1.
THE applICaTION Of INNOVaTION amONg HBS
This section looks at the extent to which different types of innovation have been applied among HBs and compares the utilisation of innovation among informal and formal HBs in rural and urban areas as well as across the three main industries. It also tests the association between innovation and business productivity.
1.1. product and process innovation
In practice, product innovation deals with the introduction of a new product or the improvement of an existing one in order to create new markets or satisfy current customers, while process innovation allows businesses to improve their product quality or production efficiency. Product innovation is therefore more focused on the market and is mainly driven by customers, whereas process innovation is primarily driven by efficiency (Utterback and Abernathy, 1975). Furthermore, product innovation is associated with the early stages of industry development, while process innovation comes at later stages (Abernathy and Utterback, 1978).
The proportions of product and process innovators among HBs during the past year are illustrated in Table 8.1. They include businesses that introduced new products or improved existing ones and those that applied new production techniques or new technology in their service supply within the past 12 months.
Overall, approximately 10 per cent of the Vietnamese HBs innovated their products and/or applied new technology during the past year. Less than 2 per cent of these HBs innovated both their products and their technology, 4 per cent carried out product innovation only and another 4 per cent only improved their production technique. These proportions are, however, much lower than those observed among manufac-turing SMEs (40 and 13 per cent respectively) (Vu and Doan, 2015).
The proportions of product and process innovators are pretty similar in rural and urban areas and slightly higher among formal HBs than informal ones (10 and 9 per cent respectively). In particular, there is a significant difference in these proportions across the three main industries. Only 1 per cent of the traders introduced a new product or technology or improved an existing one during the past 12 months, whereas one fifth of the manufacturing HBs introduced innovation in their products or their pro-duction process during the same period. This difference is due to the characteristics of each industry. While an innovation in product/technology certainly results in profit for businesses that produce food, textiles or clothing, it may be unnecessary in the whole-sale and retail trade sectors. This kind of innovation seems to be homogenous among informal and formal HBs in the manufacturing and trade sectors, possibly implying a negligible impact of formalization on product/process innovation.
TaBle 8.1.
proporTIon of hBs ThaT InnovaTed TheIr producT/TechnoloGY wIThIn The pasT 12 monThs (PERCENTAGE)
manufacturing
& construction Trade service Total
rural areas Informal HBs 21.0 0.9 7.8 9.7 Formal HBs 23.1 1.3 19.2 9.7 Total rural hBs 21.3 1.0 9.2 9.7 urban areas Informal HBs 18.3 2.1 6.9 8.3 Formal HBs 20.1 2.3 17.8 11.0 Total urban hBs 18.8 2.2 9.9 9.2 all Informal hBs 20.1 1.3 7.4 9.2 formal hBs 21.6 1.8 18.2 10.4 Total hBs 20.4 1.5 9.6 9.5
Similar to HBs in the manufacturing sector, the proportion of service businesses that formally run a small restaurant or supply repair and transport services and that inno-vate their product/process is approximately 20 per cent. However, this share is much lower among informal HBs (7 per cent), implying a high segmentation of the service market among formal and informal businesses. Approximately half of the formal HBs and only 4 per cent of the informal HBs in the service sector offer telecommunication, financial or professional services.
It is obvious that product/process innovation results in higher labour productivity, which is measured as value added per worker. Table 8.2 compares the average values of labour productivity among HBs that innovated their product or process during the past 12 months and those that did not. A ratio between them is calculated. On ave-rage, the productivity of innovators (in product or process) is nearly double that of the non-innovators. This fact is robust whatever the geographic area, formality status or industry, except for businesses in the trade sector because a change in the products or technology applied by traders may be driven by low profit or low competitiveness. This again confirms the reason why a negligible share of the trade HBs apply this type of innovation (see Table 8.1).
Looking further inside each industry, the extent that labour productivity is improved with product/process innovation seems to drive the likelihood that a business will apply this kind of innovation. Both formal service businesses and all types of manu-facturing HBs significantly improved their labour productivity (by 100-150 per cent), explaining their relatively higher shares of product or process innovators in each category. In contrast, labour productivity improved by only 20 per cent in the informal service market, which has a much smaller proportion of innovators.
TaBle 8.2.
raTIo of laBour producTIvITY BeTween producT/TechnoloGY
InnovaTors and non-InnovaTors*
Informal formal rural urban Total
hBs hBs hBs hBs Manufacturing & construction 2.1 2.2 2.4 1.9 2.2 Trade 1.0 0.6 0.7 0.8 0.8 Service 1.2 2.5 1.2 2.6 2.0 Total 1.7 2.1 1.8 1.9 1.9
Note: * Innovators are defined as HB owners who have innovated their products or processes.
1.2. output and input market innovation
Another kind of innovation is related to output and input markets. HB owners were asked if they had prospected for new customers or changed their suppliers during the past year to reduce their costs or increase their profit. This is known as output and input market innovation. This type of innovation is more common than product/ process innovation (approximately 30 vs. 10 per cent respectively) (see Table 8.3). This may be because the former type of innovation may require less expense and result in higher profit than the latter. The higher prevalence of input/output market innovation is shown consistently regardless of geographical area, formality status, industry or any combination of these classifications.
Similar to product/process innovation, the share of HBs involved in output/input mar-ket innovation is fairly similar in rural and urban areas, but it is higher in the formal sector (37 per cent) than the informal sector (26 per cent). During the past 12 months, formal HBs in all industries and geographical areas were more likely to change their suppliers or customers than informal HBs in the same industry or area. In particular, nearly 30 per cent of the HBs in the trade sector innovated their input or output market during the past year. Thus, traders rarely improved their product or process, and their activities were much more driven by the discovery of new markets or a reaction to fierce competition among producers.
TaBle 8.3.
proporTIon of hBs ThaT InnovaTed TheIr InpuT/ouTpuT markeT durInG The pasT 12 monThs (PERCENTAGE)
manufacturing
& construction Trade service Total
rural Informal HBs 29.2 22.4 23.9 25.1 Formal HBs 43.2 27.8 54.7 36.3 Total rural hBs 31.4 24.1 27.6 27.4 urban Informal HBs 37.3 26.5 23.4 27.6 Formal HBs 41.9 42.6 29.0 37.4 Total urban hBs 38.5 33.9 24.9 30.9 Total Informal hBs 31.9 23.8 23.7 26.1 formal hBs 42.6 35.3 36.0 36.9 Total hBs 34.0 28.1 26.2 28.9
Similar to product/process innovation, HBs that prospect for new customers or change suppliers consistently have higher labour productivity than their counterparts who do not carry out output/input market innovation regardless of geographical area, for-mality status or industry (see Table 8.4). On average, the productivity of the former group is higher than that of the latter by more than 50 per cent. In particular, traders in both the formal and informal sectors as well as in both rural and urban areas tend to improve their labour productivity most significantly (by around 100 per cent) when they change their customers or suppliers, which explains why a much larger share of them apply these kinds of innovations instead of product or process improvement.
1.3. combined innovation
Businesses carried out different types of innovation over the past 12 months. An inno-vative HB is therefore defined as one that applied at least one type of innovation during the past year, including: (1) the introduction of a new product or the improvement of an existing one; (2) the introduction of a new production process/technology and the improvement of an existing one, (3) the prospect of new customers and (4) the utilisa-tion of new suppliers for cost reducutilisa-tion purposes.
TaBle 8.4.
raTIo of laBour producTIvITY BeTween InpuT/ouTpuT markeT
InnovaTors and non-InnovaTors
Informal formal rural urban Total
hBs hBs hBs hBs Manufacturing & construction 1.1 1.6 1.3 1.5 1.3 Trade 2.0 2.0 2.2 1.9 2.1 Service 1.6 1.5 2.0 1.5 1.7 Total 1.5 1.7 1.8 1.6 1.7
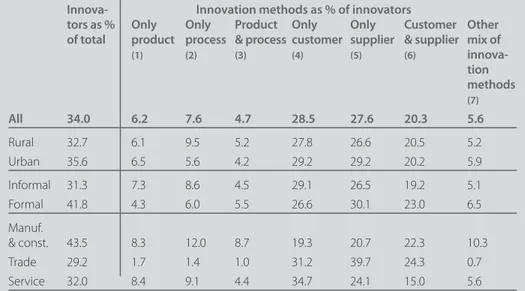
Table 8.5 shows the prevalence of the different combinations of innovative methods. Overall, a third of the HBs innovated their activities during the past year. This share is similar in rural and urban areas but larger in the formal sector (42 per cent) than in the informal one (31 per cent). As expected, HBs in the manufacturing sector very actively carried out some kind of innovation (44 per cent of them), at least 10 percentage points higher than the share of innovators among businesses in the service and trade sectors.
Approximately 30 per cent of the innovators only change their suppliers to reduce their costs. HBs that only prospect for new customers account for approximately 30 per cent of the innovators, whereas only 6 per cent of the innovators only improve their products and 8 per cent of them only conduct process innovation. Thus, nearly 70 per cent of the innovators only carried out one type of innovation during the past 12 months. The share of HBs that innovate at least both their products and technology is also small (only 5 per cent of the innovators), while other innovators are more likely to combine at least both prospecting for new customers and changing their suppliers
TaBle 8.5.
amonG The InnovaTors: a comBInaTIon of InnovaTIon meThods
(PERCENTAGE)
Innova- Innovation methods as % of innovators
tors as % only only product only only customer other
of total product process & process customer supplier & supplier mix of
(1) (2) (3) (4) (5) (6) innova- tion methods (7) all 34.0 6.2 7.6 4.7 28.5 27.6 20.3 5.6 Rural 32.7 6.1 9.5 5.2 27.8 26.6 20.5 5.2 Urban 35.6 6.5 5.6 4.2 29.2 29.2 20.2 5.9 Informal 31.3 7.3 8.6 4.5 29.1 26.5 19.2 5.1 Formal 41.8 4.3 6.0 5.5 26.6 30.1 23.0 6.5 Manuf. & const. 43.5 8.3 12.0 8.7 19.3 20.7 22.3 10.3 Trade 29.2 1.7 1.4 1.0 31.2 39.7 24.3 0.7 Service 32.0 8.4 9.1 4.4 34.7 24.1 15.0 5.6
Notes: (1) Only product innovation; (2) only process innovation; (3) at least product and process innovation; (4) only output market innovation; (5) only input market innovation; (6) at least output and input market innovation; (7) one type of product/process innovation and one type of output/ input market innovation.
to reduce their costs or increase profit (20 per cent of them). Meanwhile, a mix of one type of product/process innovation and one type of output/input market innovation is applied by nearly 6 per cent of the innovators.
Labour productivity between innovators who conduct different kinds of improve-ment and non-innovators is compared in Table 8.6. On average, a HB that conducts at least one type of innovation has a 90 per cent higher productivity rate than a HB that does not conduct any type of innovation. The gain of productivity associated with innovation is similar in urban and rural areas and across industries, and it is on average higher among formal HBs than in the formal sector.
TaBle 8.6.
raTIo of laBour producTIvITY BeTween InnovaTors and non-InnovaTors
all only only product only only customer other
innova- product process & process customer supplier & supplier mix of
tors (1) (2) (3) (4) (5) (6) innova- tion methods (7) all 1.9 2.9 1.4 2 1.9 1.2 2.4 2.9 Rural 1.9 4.3 0.9 2 2 0.9 2.5 2.1 Urban 1.9 1.4 2.4 2 1.8 1.5 2.3 3.8 Informal 1.6 3.3 1 1.2 2 1 1.4 1.3 Formal 2.6 1.5 2.6 3.5 1.7 1.6 4.1 5.7 Manuf. & const. 1.9 4.6 1.3 1.9 1.5 1 2.2 2.3 Trade 2.1 1.1 0.4 1.7 2.4 1.4 3.2 0.9 Service 1.7 1.6 1.7 2.2 1.7 1.2 1.5 4.3
Notes: (1) Only product innovation; (2) only process innovation; (3) at least product and process innovation; (4) only output market innovation; (5) only input market innovation; (6) at least output and input market innovation; (7) one type of product/process innovation and one type of output/ input market innovation.
2.
INNOVaTION THROUgH USINg THE INTERNET aND INNOVaTION
aS a mEaNS TO ExpaND fUTURE aCTIVITy
This section looks at the role of the internet in fostering innovation as well as the association between current innovation and future activity expansion. In the 2014/15 HB&IS survey, household businesses were asked whether they used the internet to find a way to produce their products, provide their services, find clients or conduct advertising. Table 8.7 illustrates the answers to these questions, and it is obvious that the internet is more likely to be used by innovators than non-innovators, although the use of the internet remains low on average (7 per cent of all the HBs).
14 per cent of the innovators stated that they use the internet for their activities, which is four times the percentage among non-innovators. The share of internet users among innovators is greater than the share of internet users among non-innovators in every category. Thus, as expected, the internet seems to foster innovation. Among both innovators and non-innovators, urban, formal and service businesses are most likely to take advantage of the internet. Labour productivity has improved among innovators who use the internet. This improvement is consistently found in both rural and urban areas, across industries, among formal HBs and in the informal sector.
TaBle 8.7.
InTerneT usaGe amonG InnovaTors and non-InnovaTors (PERCENTAGE)
% of non-innovators % of innovators labour productivity
who use the internet who use the internet ratio between internet
and non-internet users among innovators all 3.5 13.9 1.5 Rural 1.2 10.9 1.1 Urban 6.4 17.4 1.8 Informal 2.0 9.7 1.7 Formal 8.3 22.8 1.1 Manufacturing & construction 2.0 15.7 1.0 Trade 2.2 8.5 3.1 Service 5.7 17.0 1.2
Current innovation is not only fostered by internet usage but also by future activity plan-ning (see Table 8.8). HBs were asked whether they plan to strengthen their manpower or increase their activity level. Generally, innovators are more likely to be involved in strengthening their activities in the future. 13 per cent of the innovators plan to increase their manpower and 42 per cent plan to increase their activity level, and only 4 per cent and 21 per cent (respectively) of the non-innovators plan to do so. The pattern of lower shares among non-innovators appears consistently in both urban and rural areas, in both the formal and the informal sector and across industries. This is because planning helps small business owners to innovate (Beaver and Prince, 2004). Through the plan-ning process, small business owners are more likely to identify issues related to the need for new technology and training in order to help their business grow.
Table 8.8 also compares the average labour productivity of innovators who plan to increase their activities with those who do not. As a result, HBs with a plan to strengthen activity and manpower consistently have higher labour productivity. In sum, planning and usage of the internet not only foster innovation but also improve business productivity.
TaBle 8.8.
fuTure InnovaTIon amonG InnovaTors and non-InnovaTors (PERCENTAGE)
share of hBs among non-innovators share of hBs among innovators lp ratio between innovators planning to increase manpower and those not planning to do so lp ratio between innovators planning to increase activity and those not planning to do so plans to increase manpower plans to increase activity plans to increase manpower plans to increase activity all 3.9 21.3 12.7 42.0 1.7 1.6 Rural 3.8 23.8 14.2 42.7 1.9 1.5 Urban 4.0 18.1 11.1 41.2 1.4 1.8 Informal 3.8 19.3 12.2 40.9 1.0 1.3 Formal 4.3 28.1 13.9 44.3 2.5 2.0 Manuf.& construc. 6.8 21.6 20.8 46.9 1.2 1.5 Trade 1.9 24.3 5.6 46.6 4.2 1.9 Service 4.2 18.1 11.3 33.2 1.3 1.5
Note: LP is labour productivity
3.
INNOVaTION aND THE CHaRaCTERISTICS Of HBS
This section explores the characteristics of the HB owners who are most likely to inno-vate, as shown in Table 8.9.
Firstly, business size is a critical factor often discussed in the literature to explain why a small business is not innovative (Hussin et al., 2002; Hadaya, 2006). It is obvious in Table 8.9 that an innovative HB tends to be larger than one that does not innovate. 65 per cent of the HBs with more than 5 workers innovated their activities within the past 12 months, and only 36 per cent of the HBs with 3 to 5 workers and 30 per cent of the HBs with 1 or 2 workers have done so. These patterns are robust across industries and formality status. Hadjimanolis (2000) suggests that small companies tend to lack resources and bargaining power, and this hinders their ability to be innovative. In contrast, the age of a business seems not to affect the application of innovation among HBs (see Table 8.9).
TaBle 8.9.
InnovaTIon across owner and hB characTerIsTIcs BY reGIsTraTIon
sTaTus and IndusTrY (PERCENTAGE)
all Informal formal manuf. Trade service
& const. Business size 1-2 workers 29.8 29.6 30.9 35.5 25.2 30.4 3-5 workers 36.4 32.2 45.1 46.2 31.5 33.3 6-18 workers 65.2 57.2 75.3 73.5 47.9 62.6 age of business 0-1 year 29.1 27.4 34.5 45.4 22.3 26.8 2-4 years 36.5 32.0 57.7 44.2 30.3 35.5 5-9 years 35.1 34.4 36.6 48.8 26.5 37.3 10 years or more 33.5 30.2 41.7 41.1 31.7 29.0
owner’s level of education
Primary or less 28.1 26.3 35.9 37.2 25.1 24.7
Lower secondary 34.6 31.3 43.7 45.2 28.3 32.1
Upper secondary or higher 44.9 44.5 45.6 55.7 37.8 45.3
owner’s age
Under 36 40.5 35.0 58.8 50.3 35.7 38.7
From 36 to 55 33.5 31.6 38.5 43.9 28.9 30.1
Over 55 26.1 24.8 30.4 30.5 21.5 27.8
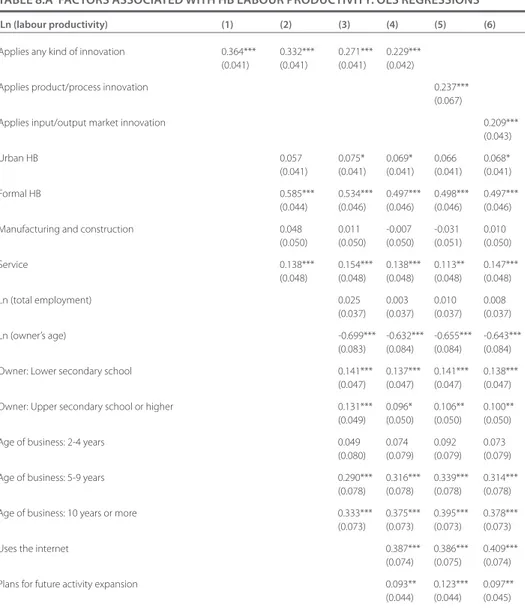
Secondly, the characteristics of business owners (i.e. their level of education and age) also impacts innovation among HBs. As shown in Table 8.9, innovative HBs tend to be managed by better educated and younger owners. 45 per cent of the HB owners who have a high school diploma or higher and 28 per cent of the HB owners who only finished primary school or have an even lower level of education attainment innovate their activities. Similarly, more than 40 per cent of the HB owners below the age of 36 conducted at least one type of innovation during the past year, followed by 34 per cent of the owners in the 36 to 55 age group. The oldest group (over 55 years old) is least likely to innovate (only 26 per cent). All the above patterns are shown to be consistent in both the formal and informal sectors and in the three main sectors. This is because well-educated and younger owners are more likely to be able to handle new technology, which might be related to the introduction of new products, and they can easily use the internet to find clients or conduct advertising activities. While labour productivity has been proven to be positively correlated with innovation (see section 2 of this chapter), household characteristics associated with innovation (larger businesses and younger and better-educated owners, as shown above) may be the main drivers of productivity instead of innovation itself. To remove these charac-teristics and test again the relationship between innovation and labour productivity, an OLS model was applied with labour productivity in logarithm form treated as the dependent variable and a main independent variable equal to 1 if a HB innovates their process/product and input/output market within the past 12 months and 0 otherwise. The results are presented in the appendix (see Table 8.A). The statistically significant coefficients on dummies of innovation shown in Table 8.A consistently imply that in-novation is always one of the main drivers of labour productivity, even after controlling for other characteristics.
CONClUSION
This chapter gives an overall picture of the utilisation of innovation among household businesses in Vietnam. Innovation is measured by the introduction of a new product/ process and the improvement of an existing one, prospecting for new customers or the utilisation of new suppliers, i.e. input/output market innovation. A third of the HBs have conducted innovation in their activities within the past year, 70 per cent of which only carried out one type of innovation. Input/output market innovation is more prevalent than product/process innovation, which is rarely conducted by HBs in the trade sector but is conducted by one fifth of the HBs in the manufacturing sector. Formal HBs are more likely than informal HBs to innovate.
The intensity of applying innovation was shown to be positively correlated with labour productivity regardless of geographical area, industry or formality status. Innovators are more likely than non-innovators to utilise the internet and have a plan to strengthen their activities in the coming year. Innovative HBs also tend to be lar-ger in size than non-innovative HBs and to be run by higher-educated and younlar-ger owners. The age of a business does not seem to affect the application of innovation among HBs.
This chapter demonstrates the existence of a dynamic segment of the HB sector. Encouraging this segment through sound policy could be an efficient way to improve productivity in the sector, in particular if spillover effects are at play. As HBs interact mostly with each other (as shown in Chapter 5), innovation can spread to the whole sector through a cascading effect.
appENDIx
Table 8.A shows changes in the association between innovation and labour pro-ductivity before controlling for other variables (Column 1) and after controlling for geographical area, informality status and industry (Column 2). Household and owner characteristics are then added as other control variables (Column 3). Because the in-ternet and planning foster both innovation and labour productivity, these variables are further added in Column 4 to examine to the extent that innovation is associated with labour productivity. In the last two columns, associations with different kinds of innovation are considered.
TaBle 8.a facTors assocIaTed wITh hB laBour producTIvITY: ols reGressIons
ln (labour productivity) (1) (2) (3) (4) (5) (6)
Applies any kind of innovation 0.364*** 0.332*** 0.271*** 0.229*** (0.041) (0.041) (0.041) (0.042)
Applies product/process innovation 0.237*** (0.067)
Applies input/output market innovation 0.209*** (0.043) Urban HB 0.057 0.075* 0.069* 0.066 0.068* (0.041) (0.041) (0.041) (0.041) (0.041) Formal HB 0.585*** 0.534*** 0.497*** 0.498*** 0.497***
(0.044) (0.046) (0.046) (0.046) (0.046) Manufacturing and construction 0.048 0.011 -0.007 -0.031 0.010
(0.050) (0.050) (0.050) (0.051) (0.050) Service 0.138*** 0.154*** 0.138*** 0.113** 0.147*** (0.048) (0.048) (0.048) (0.048) (0.048) Ln (total employment) 0.025 0.003 0.010 0.008 (0.037) (0.037) (0.037) (0.037) Ln (owner’s age) -0.699*** -0.632*** -0.655*** -0.643*** (0.083) (0.084) (0.084) (0.084) Owner: Lower secondary school 0.141*** 0.137*** 0.141*** 0.138***
(0.047) (0.047) (0.047) (0.047) Owner: Upper secondary school or higher 0.131*** 0.096* 0.106** 0.100**
(0.049) (0.050) (0.050) (0.050) Age of business: 2-4 years 0.049 0.074 0.092 0.073
(0.080) (0.079) (0.079) (0.079) Age of business: 5-9 years 0.290*** 0.316*** 0.339*** 0.314***
(0.078) (0.078) (0.078) (0.078) Age of business: 10 years or more 0.333*** 0.375*** 0.395*** 0.378***
(0.073) (0.073) (0.073) (0.073) Uses the internet 0.387*** 0.386*** 0.409***
(0.074) (0.075) (0.074) Plans for future activity expansion 0.093** 0.123*** 0.097**
Constant 14.418*** 14.158*** 16.498*** 16.215*** 16.351*** 16.263*** (0.026) (0.046) (0.317) (0.322) (0.321) (0.321) Observations 3,407 3,407 3,407 3,407 3,407 3,407 F-Statistics 77.0 55.0 32.0 30.0 29.0 30.0 P-value 0.000 0.000 0.000 0.000 0.000 0.000 Adjusted R2 0.022 0.074 0.099 0.107 0.103 0.106
Notes: Standard errors in parentheses; * p ≤ 10%, ** p ≤ 5%, *** p ≤ 1%. Source: 2014/15 HB&IS survey, VASS-CAF & IRD-DIAL; Authors’ calculations