DIAL • 4, rue d’Enghien • 75010 Paris • Téléphone (33) 01 53 24 14 50 • Fax (33) 01 53 24 14 51 E-mail : [email protected] • Site : www.dial.prd.fr
D
OCUMENT DE
T
RAVAIL
DT/2006-17
Are international databases on
corruption reliable? A comparison
of expert opinion surveys and
household surveys in sub-Saharan
Africa
Mireille RAZAFINDRAKOTO
François ROUBAUD
ARE INTERNATIONAL DATABASES ON CORRUPTION RELIABLE?
A COMPARISON OF EXPERT OPINION SURVEYS AND HOUSEHOLD SURVEYS IN SUB-SAHARAN AFRICA
Mireille Razafindrakoto François Roubaud
IRD, DIAL, Paris IRD, DIAL, Paris
[email protected] [email protected]
Document de travail DIAL
December 2006
ABSTRACT
The emergence of institutions, governance and especially corruption as major development considerations has generated a whole host of international databases intended to measure these concepts. These databases are now widely used in both the academic world and for public policies, especially for aid allocation. This study looks at the pertinence and limits of global corruption indicators based on experts’ perceptions. The study draws on a wave of original surveys coordinated by the authors and conducted simultaneously in eight African countries. This wave combines two types of surveys on the same subject. The first type of survey covering a sample of over 35,000 people takes an objective measure of the frequency of petty bureaucratic corruption and its characteristics. The second type (mirror survey) reports on 350 experts’ opinions on the matter. A comparison of these two sources paints a clear-cut picture of the experts’ error of assessment. We show that the experts do not provide a good gauge of the real level of corruption. They systematically overestimate the frequency of corruption. Moreover, the ranking of countries derived from their perceptions does not tie in with reality. The experts’ measurement error is all the greater in that the countries are not well graded in the international bases, which penalises the poorest of them. The econometric analyses also find ideological biases, with experts tending to rank countries based on their own political preferences, and the existence of a coherent, but erroneous implicit cultural model of how “Africa works”. The experts tend to massively overestimate the population’s level of tolerance of corrupt practices and underestimate the importance it attaches to matters of “good governance”. These findings make a case for a more cautious and rational use of global governance indicators. Our study also confirms the need to supplement global indicators with surveys of the players concerned.
Key Words: Corruption, Governance, Perception, Subsaharan Africa, Experts surveys, Household
surveys
RESUME
L’émergence des institutions, de la gouvernance et tout particulièrement de la corruption, comme enjeu majeur du développement a engendré la multiplication de bases de données internationales censées mesurer ces concepts. Cette étude s’interroge sur la pertinence et les limites des indicateurs globaux de corruption basés sur la perception des experts. Elle mobilise un dispositif d’enquêtes originales réalisées simultanément dans huit pays africains, couplant deux types d’enquêtes sur la même thématique. Les premières, menées auprès de la population (avec un échantillon de 35 000 personnes au total), permettent d’obtenir une mesure objective de l’incidence et des caractéristiques de la petite corruption bureaucratique. La seconde, menée auprès de 350 experts (enquête-miroir), mesure la perception que s’en font les experts. En confrontant ces deux sources, nous montrons que ces derniers surestiment systématiquement l’incidence de la corruption et que le classement des pays induits par leurs perceptions n’est pas corrélé avec la réalité. L’erreur d’appréciation des experts est d’autant plus forte que les pays sont mal notés dans les bases internationales, pénalisant les plus pauvres d’entre eux. Les analyses économétriques mettent également en évidence la présence de biais idéologiques, ainsi que l’existence d’un modèle culturel implicite, cohérent mais erroné, sur la façon dont « l’Afrique fonctionne ». Les experts ont tendance à surestimer massivement le niveau de tolérance aux pratiques corruptives de la part de la population et à sous-estimer l’importance qu’elle accorde aux questions de « bonne gouvernance ». Ces résultats plaident en faveur d’un usage plus précautionneux et raisonné des indicateurs globaux de gouvernance et confirment la nécessité de les compléter par des enquêtes auprès des acteurs concernés.
Mots-clefs : Corruption, Gouvernance, Perception, Afrique sub-saharienne, Enquêtes-experts,
Enquêtes-ménages
Contents
1. INTRODUCTION ... 5
2. PERTINENCE AND LIMITS OF THE AGGREGATE CORRUPTION INDICATORS: REVIEW AND DISCUSSIONS ... 6
2.1. The global governance indicators ... 6
2.2. Corruption perceptions indicators... 7
2.3. Bias introduced by the method used to aggregate the different primary sources ... 9
2.4. An indirect measure of corruption based on perceptions ... 10
2.5. The link between global corruption indicators and variables in the real sectors of the economy: proof of the pertinence of the indicators? ... 11
2.6. Use of governance indicators in aid allocation: a ‘triple whammy’ for poor countries ... 12
3. THE SURVEY PROTOCOL AND THE DATA ... 15
3.1. The population surveys ... 16
3.2. The Mirror Survey ... 19
4. FINDINGS... 21
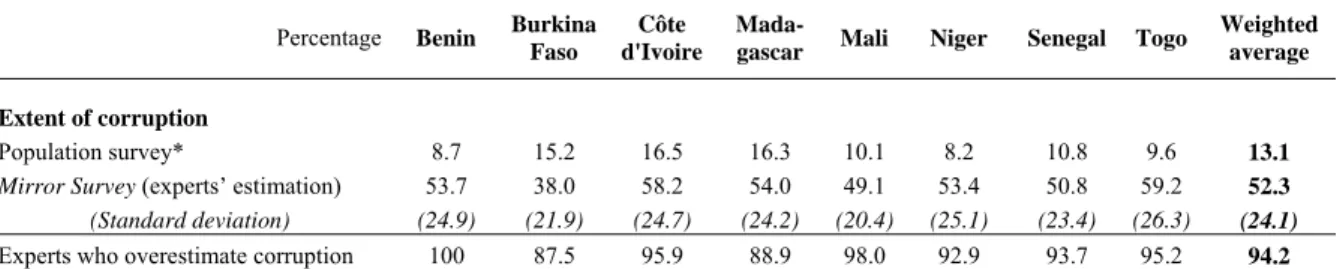
4.1. The experts overestimate the level of corruption... 21
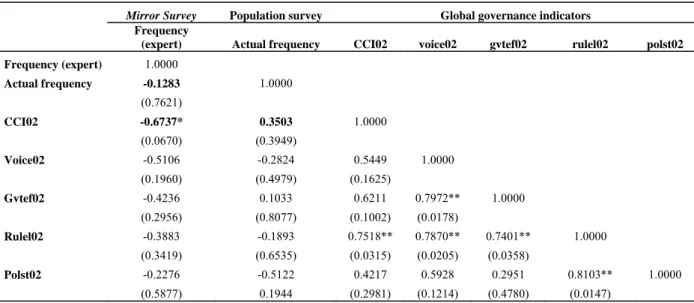
4.2. No correlation between the experts’ perceptions and the population’s experience... 22
4.3. Explanatory factors for the experts’ points of view ... 23
4.3.1.Ideological bias... 26
4.3.2.Accommodating preferences: an erroneous cultural model ... 27
4.4. A broader approach to the way of structuring the experts’ opinions on governance ... 31
5. CONCLUSION ... 36
REFERENCES ... 38
List of tables
Table 1: Examples of international databases on governance ... 6
Table 2: Main characteristics of the Governance and Democracy modules in Africa ... 17
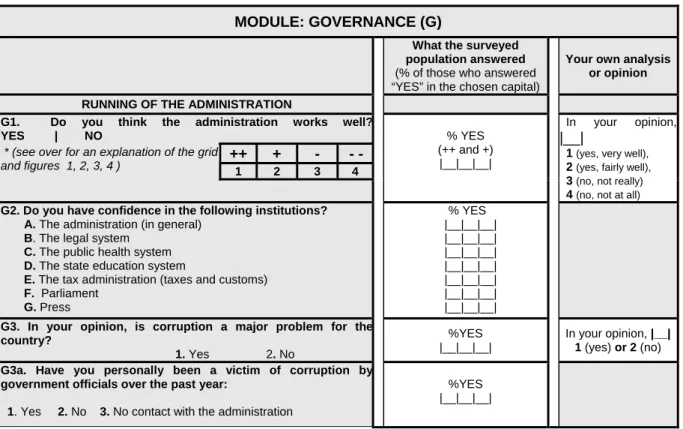
Table 3: Excerpt from the Mirror Survey questionnaire... 20
Table 4: Mirror Survey samples by country ... 21
Table 5: Extent of corruption reported by the population survey and the Mirror Survey ... 22
Table 6: Correlation matrix for the different measurements of corruption ... 23
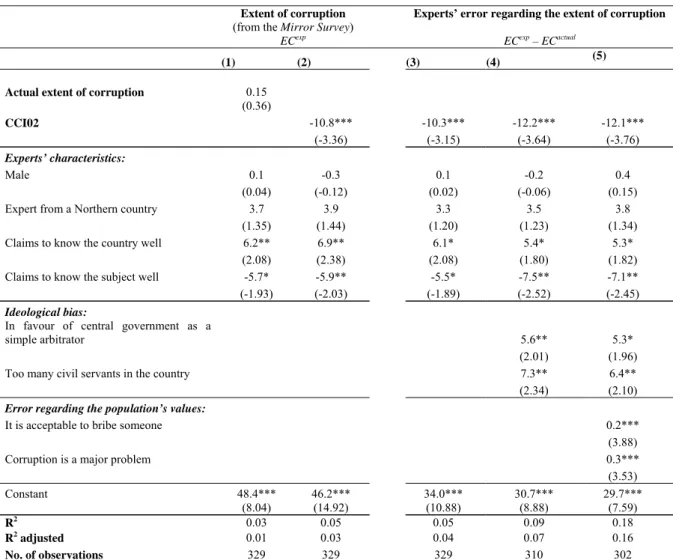
Table 7: Explanatory factors for the experts’ evaluations of the extent of corruption ... 25
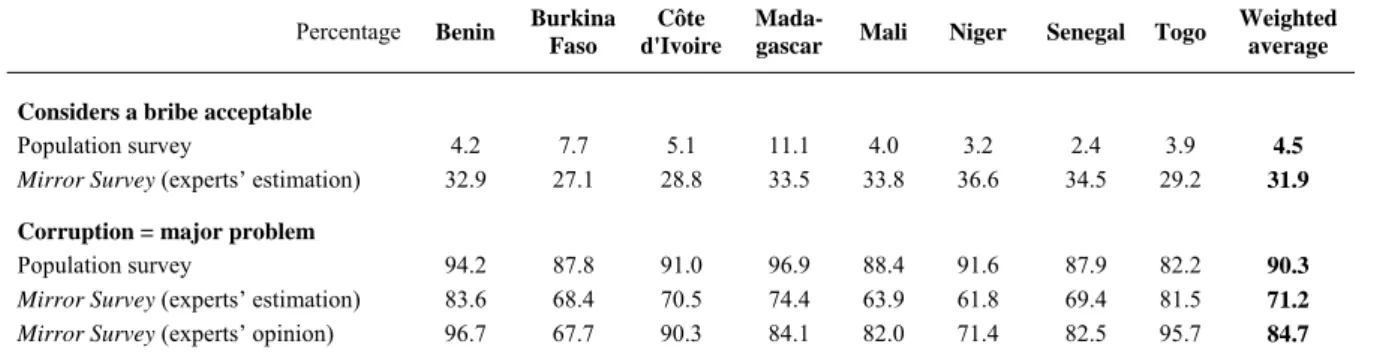
Table 8: Tolerance of corruption according to the population and the experts ... 29
List of charts
Chart 1: Appraisal by the population and experts of the running of the institutions ... 33Chart 2: Appraisal by the population and experts of the running of the institutions ... 34
Chart 3: Errors in the experts’ appraisals of governance and the systems of values ... 35
List of boxes
Box 1 : Methodology for two global corruption indicators ... 8Box 2: Examples of the explicit use of governance indicators to allocate ODA... 14
Box 3: Complementary options to the global corruption indicators... 16
Box 4: The population is not afraid of criticising the regime in power ... 18
Box 5: Are the ideological bias tests on the KKZ indicators conclusive?... 26
Box 6: The population’s view of the importance of governance in the causes of underdevelopment ... 30
List of appendices
Table A 1: Respect for democratic principles by country ... 421.
INTRODUCTIONThe issue of corruption, and governance more broadly, has become a major development issue in recent years. This growing interest has emerged at the crossroads of two movements. In the academic field, an entire array of economic research has turned to the role and quality of institutions in the development process. A growing body of empirical studies based on large country samples has been seeking to introduce a series of factors hitherto deemed extra-economic (property rights, type of political system, colonial origin, social capital, ethnic diversity, etc.) into the classic growth equations (labour, capital and technological progress). In the area of development policies, the failure of the structural adjustment policies, the rehabilitation of the role of the State and the adoption of new poverty reduction strategies have placed the issues of governance and political economy at the heart of the reforms. The studies on corruption are part of this general context.
These trends have swept in a move to measure these new aspects of development and monitor the policies. In all these areas, we are seeing an increase in the number of global indicators and international databases on governance and institutions. Although geographic and time coverage varies from one source to the next, the principle is the same: to score each country in order to rank them based on their performance with regard to the variable in question. The case of corruption is no exception to this trend. These indicators, initially produced by private agencies for their clients (investors, banks, etc.) and by researchers for more or less ad-hoc study requirements, have gradually become institutionalised.
The purpose of this study is to consider the pertinence and limits of global indicators based on experts’ perceptions. The analysis looks, in particular, at what can be learnt from an empirical procedure that makes a word-for-word comparison of objective and subjective measures of petty bureaucratic corruption experienced by the population in their interactions with government officials. Note that this study does not address large-scale corruption (awarding of public procurement contracts, embezzlement of public funds, etc.) or political corruption (funding parties, buying votes, etc.). The decision to restrict the paper to this one aspect is that it is one of the few forms of corruption that can be studied directly by representative surveys. Such an approach is, by its very nature, harder to envisage let alone implement in the case of large-scale corruption. The procedure is based on a wave of original surveys commissioned by the authors and conducted simultaneously in eight African countries. This mechanism combines two types of surveys on the same subject: one of the population and the other of experts (Mirror Survey). The first type of survey covering a sample of over 35,000 people takes an objective measure of the extent of petty bureaucratic corruption and its characteristics. The second type reports on the experts’ opinions on the matter. A total of 350 experts responded to the Mirror Survey. A comparison of these two sources paints a clear-cut picture of the experts’ error of assessment.
This paper is made up of five sections. Following this introduction with its brief exposé of the subject matter, the second section develops the issues further with a review of the strong points and methodological limits of the main global indicators on corruption. The data used are detailed in the third section, while section four sets out to explain how experts form their perceptions. The different models tested find that the opinions of the experts who responded to the Mirror Survey do not tie in with reality, but are correlated with the global corruption indicators. We show that these opinions also depend on certain individual characteristics found among the experts and that the errors are by and large intercorrelated. The hypothesis of the existence of ideological and cultural biases is explored. Lastly, section five draws a conclusion and suggests some areas for further research.
2.
PERTINENCE AND LIMITS OF THE AGGREGATE CORRUPTION INDICATORS: REVIEW AND DISCUSSIONS2.1.
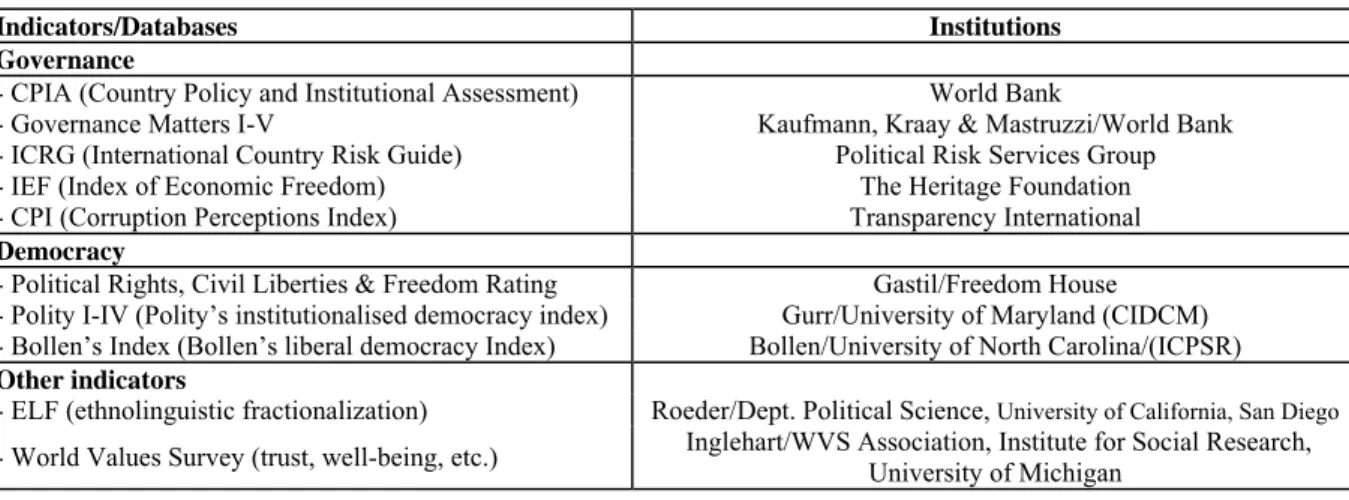
The global governance indicatorsThe rise of governance issues and, more generally, the role of institutions on the political and academic development agenda has been accompanied by an increase in the number of international databases claiming to provide quantitative measures of these complex concepts (Sudders and Nahem, 2004; UNDP, 2006). Table 1 (below) presents a sample of these global indicators. In addition to corruption, they cover a whole host of fields ranging from civil liberties through government efficiency and confidence in the institutions to the rule of law.
Table 1 : Examples of international databases on governance
Indicators/Databases Institutions Governance
- CPIA (Country Policy and Institutional Assessment) World Bank
- Governance Matters I-V Kaufmann, Kraay & Mastruzzi/World Bank
- ICRG (International Country Risk Guide) Political Risk Services Group
- IEF (Index of Economic Freedom) The Heritage Foundation
- CPI (Corruption Perceptions Index) Transparency International
Democracy
- Political Rights, Civil Liberties & Freedom Rating Gastil/Freedom House - Polity I-IV (Polity’s institutionalised democracy index) Gurr/University of Maryland (CIDCM) - Bollen’s Index (Bollen’s liberal democracy Index) Bollen/University of North Carolina/(ICPSR)
Other indicators
- ELF (ethnolinguistic fractionalization) Roeder/Dept. Political Science, University of California, San Diego
- World Values Survey (trust, well-being, etc.) Inglehart/WVS Association, Institute for Social Research, University of Michigan
Source : based on Sudders and Nahem (2004).
Although these global indicators represent a definite advance in the measurement and knowledge of the running of the institutions (including from the point of view of corruption) and governance at international level, they nonetheless have a certain number of shortcomings worth mentioning. Some of these drawbacks are associated with the misuse of the indicators by uninformed and unscrupulous users (researchers, donors, etc.) and therefore cannot be put down to either the indicators themselves or their promoters. However, more serious is that other weaknesses are due to intrinsic limits in the indicators, the implications of which are not always fully appreciated. Generally speaking, it is important to note the intellectual integrity of the indicators’ designers who have always carefully defined the coverage of their indicators and warned against erroneous interpretations.
Regardless of the methods used, the main characteristic of all these indicators is that they are mainly (but not exclusively) based on experts’ perceptions. Although the global indicators have long been viewed with caution because of their subjective nature, this criticism has dwindled to the extent that they are now seen as a norm in this field. This change of heart is due mainly to three mutually reinforcing reasons: validation by correlation, validation through impact and legitimacy through use. Firstly, the strong correlation between most of the ‘independent’ sources used to put together corruption perceptions indicators shows that these indicators do indeed reflect a common phenomenon. Secondly, the many econometric studies using this type of indicator on the causes and consequences of corruption generally find a significant link between corruption and an entire array of phenomena in the real economic and social sectors (growth, investment, export, education, poverty, etc.). Thirdly, the widespread use of these indicators by different communities with international influence (academic world, investors, donors, etc.) forms a powerful argument in favour of their validity. Yet strictly speaking, none of the three abovementioned types of indirect validation guarantees that there is really any link between the subjective indicators and the real level of corruption. This leaves the question of the match between perceptions and fact unanswered, based more on belief than scientific proof.
2.2.
Corruption perceptions indicatorsThe two main producers of benchmark corruption indicators are currently the NGO Transparency International (Corruption Perceptions Index) and the World Bank (Control of Corruption Index). In both cases, metadata or ‘indicators of indicators’ are used to compile and aggregate the different primary sources into a composite indicator (see the appendix for a more detailed presentation of the methodology used to construct these indicators).
The Corruption Perceptions Index (CPI) developed by the NGO Transparency International in 1995 is probably the oldest and most well known of the measurements of large-scale corruption. It is also the index that has been used the most in macroeconomic studies of corruption, even though it now has strong competition from the governance database developed by the World Bank (see below). As its name suggests, the CPI is based on perceptions of corruption by experts (business people and country risk analysts), both residents and non-residents, nationals and expatriates. Corruption is defined conventionally as “the abuse of public office for private gain”. This decision to use opinions is justified by the inherent problems involved in obtaining objective and reliable measurements of corruption. It has steadily extended its coverage of sources and countries. For example, the 2005 CPI drew on 16 different sources from ten independent international institutions (Economic Intelligence Unit, World Economic Forum, etc.) and regional institutions (Economic Commission for Africa). It covered 159 countries (as opposed to 146 in 2004 and 133 in 2003).
The World Bank database developed by D. Kaufmann’s team is by far the most comprehensive (Kaufmann, Kraay and Zoido-Lobatón; Kaufmann, Kraay and Mastruzzi, 2004, 2005, 2006). The latest available version of this database (known by the initials of its three original authors as the ‘KKZ database’) covers 209 countries with an indicator published every two years from 1996 to 2004 (as opposed to every year for the CPI). It is also more extensive in terms of database sources and indicators. It presents six indicators (Voice and Accountability, Political Instability, Government Effectiveness, Regulatory Burden, Rule of Law and Control of Corruption), each corresponding to different aspects of governance. It draws on 37 individual sources from 31 different institutions. Of all the indicators produced by this database, the Control of Corruption Indicator (CCI) is the most directly comparable with the CPI. It bears many similarities to the CPI, but differs on a few points (for a detailed comparison, see Kaufmann, Kraay and Zoido-Lobatón, 2003). The CCI is designed to measure “the exercise of public power for private gain, including both petty and grand corruption and state capture.” It is also a composite indicator of perceptions of corruption, combining different sources predominated by the opinions of experts and business people. Yet other types of perceptions, such as those formulated by households, are also taken into consideration. From this point of view, it is not as ‘pure’ as the CPI in that it includes primary sources with a greater extent of heterogeneity (nature of respondents and questions put). Unlike the CPI, it does not require a minimum of three sources to include a country. For example, 10% of the countries reported on in 2002 drew on just one source.
Despite differences in their coverage and construction, the two indicators are strongly correlated (R2 of
0.9 in 2002). This is due partly to their common denominator: all of the CPI’s primary sources are found in the CCI. Moreover, they present similar confidence intervals. The correlation between both composite indicators and primary sources (see, for example, for the CPI, Lambsdorff, 2005) is seen as a form of indirect validation of their pertinence.
Box 1 : Methodology for two global corruption indicators
The Corruption Perceptions Index (CPI) developed by the NGO Transparency International:
Although the CPI’s methodology has been revised a number of times, its basic principles remain the same. The sources measure corruption and rank countries using a common approach. At least three different database sources have to exist for a country to be included in the index. For a given year, the information on the three previous years is taken into consideration and treated as if it came from independent sources. This procedure introduces a smoothing effect that prevents any contemporary reading of the changes observed from one year to the next. The CPI is standardised to run on an ordered scale of 0 (maximum corruption) to 10 (minimum corruption). The average CPI score for each country is accompanied by its standard deviation, minimum and maximum scores obtained for each primary source, and a ‘confidence range’ calculated by the bootstrap method to provide a gauge of the reliability of the composite indicator.
The Control of Corruption Indicator (CCI) developed by the World Bank
The CCI has a lot of points in common with the CPI. Aside from a broader coverage (in terms of countries and primary sources used), it differs on two main points. Firstly, it uses only the indicators for the year in question, hence better reflecting changes from one year to the next. Secondly, the two indicators differ in terms of the standardisation procedures used to aggregate the primary sources and the accuracy of the composite indicators. The CCI is presented as a continuous standardised quantitative measure (standard normal variable) giving rise to a scale generally ranging from –2.5 (high level of corruption) to +2.5 (minimum level). It is also accompanied by measurements of reliability (‘confidence interval’ and minimum and maximum scores). As, by definition, the CCI is centred at 0, a change in a country’s score from one year to the next is to be interpreted as the variation in the country’s relative position compared with the average of the countries included in the sample in a given year, and not as an improvement or downturn per se. The CPI should also theoretically allow for this, but in practice does not lend itself to this use, either in terms of scores or rankings, due to the potential differences in the basic components from one year to the next (change in the number of countries, primary sources and scoring methods).
A number of studies have examined the pertinence and validity of the indicators on corruption (and, more broadly speaking, governance). The authors themselves have identified certain shortcomings while others have been singled out by a certain number of critiques (Galtung, 2005; Soreide, 2005, Arndt and Oman, 2006). The most in-depth exercise of all looks to be the paper by Arndt and Oman focusing mainly on the KKZ indicators.
Three types of weaknesses can be defined with regard to these global indicators:
- The indicators are tarnished by relatively large margins of error, which make the intercountry and time-based rankings highly inaccurate. The indicators provide no way of assessing governance trends at worldwide level, only allowing for relative positions. They provide no indication of the policies that might reduce corruption;
- The aggregation procedure and the choice of the different primary sources used to put together the indicators are questionable;
- The global indicators’ estimators and their accuracy only concern the perception of corruption (generally by experts) and not corruption itself.
We do not intend to go into any detail on the first point, about which there is by and large a relative consensus. Indeed, as we have already mentioned, the indicators’ promoters themselves generally point up the potential limits of the time and intercountry comparisons. Nevertheless, by way of an example, the last part of this section will look at the extent of the potential impact of the governance indicators’ inaccuracy on the allocation of aid. Yet before doing so, we will explain the two other weak points regarding the source aggregation procedure and the subjectiveness of the experts.
2.3.
Bias introduced by the method used to aggregate the different primary sourcesThe procedure used to aggregate the different primary sources to obtain the composite indicator poses a problem. It is based on the strong assumption that there is no correlation between the errors in the basic indicators. In the case of the KKZ indicators which, unlike the CPI, apply a variable weighting system to the different sources, the methodology has two particularly detrimental repercussions:
- A source is accorded a greater weight when it is correlated with the others; - The aggregate indicator’s accuracy is greater when the sources are intercorrelated.
Yet, as noted by Arndt and Oman (2006) in their examples, there is every reason to believe that this hypothesis is not generally borne out in practice. Firstly, the experts influence one another. There are many channels for this ‘contamination’. Experts in one source may explicitly or implicitly, through a mutual acquaintance, refer to other sources. Such is the case, for example, with the Economic Intelligence Unit experts, who fine tune their own judgment based on the CPI, which itself uses the same primary sources as the CCI. Different primary sources may speak to the same experts. One institution may be used as a basis for a number of primary sources deemed independent by KKZ. In a move to solve this problem, the World Bank has adopted a precautionary procedure in which it eliminates the sources that explicitly draw on other existing sources from the aggregate indicators. However, this strategy is clearly unable to flush out all the abovementioned hysteresis effects.
Secondly, experts are sensitive to common exogenous factors whose link with governance is far from soundly established. This means that experts will tend to give a higher score, other things being equal, to the countries with the best economic performances (in terms of growth, investment and exports) and will hence underestimate corruption in these countries. In addition, the survey respondents present a selection bias. Take the case of a survey of business people. If ‘honest’ investors liable to speak out against corruption had to shelve their projects precisely because they did not accept corrupt practices, with some of them disappearing from the market (bankruptcy), then the level of corruption would be minimised. This systematic error would then lead to the underestimation of the real negative effects of corruption on business performance and all other associated variables.
Ultimately, whatever the procedures used to obtain the best possible indicator from existing primary sources and to reduce the measurement errors that could result from some of these sources, nothing guarantees that the indicators will not be biased. The probable breach of the error independence condition has two negative effects. The CCI’s weighting system, whereby the weight accorded to a primary source is higher when this source is correlated with the others, unduly raises the accuracy of the estimators and strengthens the abovementioned bias1. The simulations by Kaufman, Kraay and
Mastruzzi (2004), which relax the assumption of non-independence, show that the accuracy of the estimators is substantially reduced. Moreover, the optimal use of the available information is not always guaranteed. Imagine that, alongside the sources intercorrelated for the wrong reasons, a new series were added that provided a good estimate of corruption. In this configuration, the above-described principle of conformity would tend to have a lesser effect on the composite index.
The choice of primary sources, which is largely based on the point of view of the experts and business people (exclusively in the case of the CPI), reduces the weight accorded to ‘discordant opinions’ that other interest groups could voice. For example, the citizens’ assessment of governance issues has little correlation with the experts’ appraisal, as shown by the relative weights of the two types of primary sources. Not only are there few household surveys (five of the 37 primary sources in 2004), but their weight is marginal because they have little correlation with the other sources. On average, their relative weight was 8% for the CCI in 2002 (data are not available for 2004). And this average conceals strong disparities since not all the sources are available for all the countries. For the eight African countries analysed here, all the primary sources used for the CCI in 2002 correspond to expert
1 In fact, the margins of error accompanying the global indicators are quite far removed from the standard definition of confidence intervals,
calculated for statistical surveys, since these latter surveys are supposed to provide a measure of sampling errors due to the chosen sampling procedure. If this were the case, we would find it hard to explain how these “pseudo confidence intervals” for a few primary sources (the CCI used a median number of seven sources in 2002) could give rise to more or less the same brackets and sometimes lower brackets than those resulting from the application of the law of large numbers to samples containing thousands of observations.
appraisals (CPIA from the World Bank and the African Development Bank, State Capacity Project from Columbia University, World Market Online from World Markets Research Center, etc.) with the exception of Mali, where the Afrobarometer survey is used alongside seven other expert opinion surveys.
This means that the global indicators do not fully gauge (and not at all in the case of the CPI) the specific governance problems encountered by the population. Although it is the CPI’s principle to exclude household sources, the World Bank’s indicators overrepresent expert opinions not because of a selection choice, but because of their greater availability on the market. This aspect unfortunately introduces a sample bias in their favour, which is hard to control. If, for example, the number of household sources were to increase or even form the majority, the aggregation procedure could marginalise the experts’ point of view and ultimately give rise to an extremely different diagnosis of governance. It would be interesting, to test this hypothesis, to conduct simulations varying the combination of primary sources in the global indicators based on their origin (population, business people, experts).
2.4.
An indirect measure of corruption based on perceptionsIn addition to the critique of the statistical procedures used to transform the primary sources into composite indicators, we should take an upstream look at the choice of perception data. This choice is based on two suppositions:
- The first is that corruption is not a measurable phenomenon (“For many of the key dimensions of governance … objective data are almost by definition impossible to obtain … Consider corruption. As an illegal activity, there are no direct measures of its prevalence,” (Kaufmann, Kraay and Mastruzzi, 2004, p. 271));
- The second is that perceptions are good proxies for the real phenomenon of corruption (Kaufmann, Kraay and Mastruzzi, 2004; Lambsdorff, 2005).
Obviously, if the first premise is true, then the second assertion is irrefutable. Consequently, its validity has more to do with belief or faith than a scientific approach.
On the first point, it is now widely acknowledged that certain elements of corruption (especially petty corruption) can be measured by surveys (Reinika and Svenson, 2006). We illustrate the validity of this approach using our own surveys.
On the second point, we could express a few reservations about the validity of this assumption. We could reasonably question the extent of knowledge of the phenomenon and the way in which the experts handle the information at their disposal. Firstly, media reports on cases of corruption, maybe precisely because an active anticorruption policy has been put in place, could prompt the experts to consider that corruption is high or rising when quite the opposite is the case. The same types of adverse effects have been observed and acknowledged for an entire range of phenomena such as tax evasion, illegal immigration and domestic violence. Secondly, corruption is a complex and multifaceted phenomenon. In any given country, bureaucratic corruption may well be low while political corruption is high. The same divide could be found between petty and large-scale corruption, and between central government and local government corruption. How do the experts weight these different components? Lastly, doubt could be cast on the accuracy of the experts’ knowledge of petty corruption, which affects individuals, especially the poorest, on an everyday basis (we will come back to this). This shortcoming is also largely acknowledged: the aggregate perception indicators are biased since they focus mainly on corruption affecting large companies, especially in international trade and foreign direct investment.
More generally, is it acceptable to make do with perceptions to measure real phenomena? Who would be satisfied with estimates of unemployment, inflation or growth based on experts’ opinions? Even in cases where the measure is not immediate, such an approach could not be deemed satisfactory. The analogy with attempts to quantify the underground economy, normally hard to observe, is enlightening here: a direct measure by surveys for the accessible part (informal sector) and indirect measures for the
components that cannot be measured by surveys (tax audits, estimation based on the consumption of inputs or the demand for currency, etc.).
Given these intrinsic limits, should measurements based on perceptions be dropped? We do not think so. For example, it is obvious that the perception of corruption can have a direct causal effect on investment. Yet rather than claiming that perceptions provide an acceptable measure of reality, it would appear preferable to switch scientific position. This means positing that the perception and reality of a phenomenon are two distinct components, interlinked in a complex manner, and that the interactions between them should be studied wherever this is possible. From this point of view, we feel it perfectly justifiable to exclude sources based on objective measurements from the construction of global perception indicators, since the two aspects are not reducible to one another. However, objective indicators based on real experiences of the phenomenon, and not just on the idea formed of it, should be developed in parallel (Box 1). The procedure presented in the following sections sets out to establish the direct link between the experts’ perceptions and the actual extent of petty corruption.
2.5.
The link between global corruption indicators and variables in the real sectors of the economy: proof of the pertinence of the indicators?One of the arguments put forward to defend the pertinence of the global indicators is that the estimated effect of these indicators on the economy (finding, as expected, that corruption is detrimental) constitutes indirect proof of their pertinence. If the proposed measurements only captured noise, they should not be significantly associated with real phenomena.
Since the founding papers by Mauro (1995 and 1997), empirical studies on the causes and consequences of corruption have grown exponentially. The increase in the number of international databases on corruption is largely behind the emergence of a real ‘industry’ in growth econometrics (broadly speaking, since growth is not the only output studied), to use the term employed by Srinivasan (2001). In a survey of recent papers, Lambsdorff (2006) finds no less than a hundred papers on these issues published in leading academic journals alone! And this is far from a comprehensive survey of the field.
As regards the repercussions, the main variables of interest are economic growth or the level of per capita GDP, total investment, private or public, public expenditure and its breakdown, international trade, foreign direct investment and capital flows, official development assistance, inequalities and a whole series of social outputs (education and health) associated in particular with the MDGs. Less conventionally, the potential impact of corruption is tested on an entire range of other variables such as inflation, pollution and the environment, the crime level, etc. As regards the causes, the studies look at the size of central government and how it takes public action, especially at its decentralisation level (Treisman, 1999; Kunicova and Rose-Ackerman, 2005; Bardhan, 2006), wage levels and how civil servants are recruited (Van Rijckeghem and Weder, 2001; Di Tella and Schardgrdsky, 2003), public regulations, the quality of the institutions, competition conditions and the organisation of the markets, freedom of the press, the type of political system and democracy, election procedures and the organisation of the political parties, and the cultural determinants of corruption (interpersonal trust, religion and racial fractionalisation: La Porter et al., 1999; Lipset and Lenz, 2000). Here too, the list is not exhaustive and could be extended to other aspects such as the impact of gender (Swammy et al., 2001), colonial origin and the abundance of natural resources.
We obviously have no intention of reporting on the findings of this research in this paper. As in any scientific field, a certain number of debates and controversies are touched upon. These generally concern the robustness of the findings obtained: selection of the country samples, choice of control variables and econometric methods used. In fact, most of the discussions concern this area with the focus on questions of causality (with their technical implications: problems of endogeneity, choice and validity of instruments) (Aron, 2000).
It is of note, however, that the question of the reliability of the corruption indicators is virtually never addressed. On this score, authors at best merely test the sensitivity of the findings to alternative
measurements of corruption based on different sources. Given the abovementioned strong correlation between the indicators, the analyses generally corroborate the findings. The primacy of estimation technique considerations often brings authors down in favour of ‘first generation’ indicators, for which long-run series are available (e.g. the PRSG’s ICRG – see Table 1) for panel analyses, to the detriment of indicators of better quality (such as the CPI or CCI) covering a shorter period of time (maximum of ten years). Virtually half of the nearly one hundred recent studies on the consequences of corruption surveyed by Dreher and Hertzfeld (2005) are based on the ICRG and BI (Business International) indicators as opposed to one-quarter on the CPI and barely over 10% on the CCI.
All in all, although a minority of published studies find no significant links between corruption and the variables concerned, the vast majority put forward conclusive findings that tie in with the expected deduction (corruption undermines development). The imbalance is moreover heightened by journal publication policy, which tends to favour papers that find positive proof.
This scientific body of work underpins the idea that the global corruption indicators measure a real phenomenon, which itself influences a certain number of economic and social variables. Yet, strictly speaking, what these studies prove is that a certain number of economic and social variables are associated with the perception of corruption and not with corruption itself, a nuance that is generally glossed over.
In fact, these two aspects, the perception of corruption and the reality, can both have an effect (not necessarily identical and needing to be taken into account) on the real sectors of the economy and on social and political dynamics. So this notion does not necessarily lend itself to favouring objective measurements over subjective evaluations. It could even be argued that, in certain cases, perceptions have more of an effect on the real sectors of the economy than on the phenomenon itself2. Nevertheless, the concept an indicator is designed to measure should be clearly defined and, in particular, ‘subjective’ perceptions should be differentiated from the ‘objective’ realities experienced by the agents (population and business).
2.6.
Use of governance indicators in aid allocation: a ‘triple whammy’ for poor countriesThe boom in research programmes and academic publications has not been the only consequence of the development and dissemination of international databases on corruption, and governance in general. These indicators are also being increasingly extensively and explicitly used as a criterion to steer official development assistance allocation decisions. Many donors (bilateral and multilateral) use the rankings provided by these aggregate indicators to choose the countries to which they will provide aid and how much they will allocate to them.
In addition to the fact that governance as such, with its catchwords (ownership, participation, empowerment and accountability), has become a fully-fledged aspect of development, it is also advocated for its instrumental effectiveness. For example, a certain number of studies have taken up the pioneering work by Burnside and Dollar (1997 and 2000) and endeavoured to show that aid is all the more effective when recipient countries are well governed. Although this remains a subject of intense debate among researchers due to the fact that it is hard to establish a robust causal relation, the idea, better known under the name of aid selectivity, has caught on (see Amprou and Chauvet, 2004, for a review of studies on the issue). The World Bank advocated applying this principle in its Assessing Aid report back in 1998. The concept now guides many donors more or less directly, as shown by an entire series of empirical studies on aid allocation criteria (Berthélémy and Tichit, 2004; Burnside and Dollar, 2004; Dollar and Levine, 2004).
The latter authors, for example, estimate aid allocation equations by donor and destination over different time periods, based on two selectivity criteria: poverty (approximated by per capita GDP)
2 The Madagascan crisis is a good example of this case in point. It was, among other things, because the population believed that corruption
was rising even though the objective indicators showed that it was falling (see below) that the population rose up and brought down the regime in place, with the short-run negative repercussions on growth, inflation, and so on that resulted from this political upheaval.
and the quality of policies and institutions (CPIA3), controlling for population in each recipient country. Their findings show not only that the elasticity of the institutional/policy variable is significant for the current period (1999-2002), but that it has tended to rise and spread. For example, whereas it had no effect on aggregate aid flows (total, bilateral and multilateral aid) during the 1984-1989 period, it had a strong influence on the three aggregates in 1995-1999. At a more detailed level, eleven out of forty-odd donors were found to take account of good governance when attributing their financial assistance in the late 1980s. This number had doubled ten years later.
The role of governance looks set to take on even more importance in the future, given that this type of analysis is used to establish donor rankings based on their extent of institutional/policy selectivity. For example, France and the United States, criticised for their poor performance in this area, have decided to take more resolute steps in this direction (see CICID, 2004 for France and the creation of the MCA for the United States).
Consideration of the institutional/policy criterion may be more or less explicit and formalised. For example, the appendix presents concrete examples of the use of governance indicators to allocate ODA. In most cases, the aid allocation criteria include a corruption component. The formulas used (often in an esoteric form that could be called a ‘Voodoo’ formula) draw on more or less arbitrary weighting systems. For example, the formula used by IDA (World Bank) is based largely on the CPIA and accords greater weight to the governance criteria, as defined by the World Bank’s in-house departments, based on subjective ratings (Kanbur, 2005).
The Millennium Challenge Account (MCA) is a textbook example of the application of the new aid allocation principles. The MCA’s method of identifying recipient countries draws directly on recent work on selectivity to maximise aid effectiveness. Only a small number of countries will ultimately receive funding from the MCA (Radelet, 2003 and 2004). The counterpart of this selection process set up to be totally transparent is that it gives recipients more leeway in the use of funds (ownership and accountability).
Although all the countries are potentially eligible4, a country has to score well on a series of 16
indicators grouped into three categories – “ruling justly”, “investing in people” and “economic freedom” – before it can actually apply to the MCA. Basically, it has to score above the median on at least half of the 16 indicators and this condition must absolutely be met when it comes to the corruption indicator. Corruption is therefore at the core of the recipient country selection process. The list of the 16 indicators and their source is perfectly identified and is supposed to be updated annually.
3 The sensitivity tests conducted using alternative measurements of governance (ICRG’s Rule of Law and Freedom House’s Democracy) do
not change the nature of the findings. This result merely reflects the abovementioned correlation between the different governance indicators.
4 In the first year, all countries with a per capita income of less than US $1,435 and eligible for concessional finance will be eligible (74
countries). In the second year, the second condition will be dropped, expanding the pool to 87 countries. In the third year, eligibility will include the 28 countries with per capita incomes between US $1,435 and US $2,975, for a grand total of 115 countries
Box 2: Examples of the explicit use of governance indicators to allocate ODA
The World Bank
For many years, IDA (World Bank) has been trying to make the allocation of its aid to the poorest countries objective by using a formula that takes into account the dual criterion of institutional/policy selectivity and the poverty reduction goal. Briefly, and to cite Kanbur (2005) who criticises it, the formula is as follows (for 2003): Allocation per capita = f(PR2.0, GNIPC -0.125)
where PR is an institutional/policy performance rating supposed to foster growth. This criterion is itself defined as follows:
PR=(GF/3.5) 1.5 * [0.8CPIA+0.2ARPP]
CPIA: Country Policy and Institutional Assessment ARPP: Annual Review of Portfolio Performance GF: Governance Factor
GF=[ΣgCPIAg+ARPPg]/7; where g represents the seven basic governance-related components in the two
composite indicators: the CPIA (six: Property Rights and Rules-Based Governance, Quality of Budgetary and Financial Management, Quality of Public Administration, Transparency, Accountability and Corruption in the Public Sector, etc.) and the ARPP (one: procurement practices).
Note that this formula is not applied as it stands, but sets a benchmark with substantial leeway for variations based on discretionary corrective elements (to take account of post-conflict situations, etc.).
The British DFID
The World Bank is not the only one in search of the magic formula for aid allocation. DFID, for example, has also been working on the question and has formulated the following proposal (Dyer et al., 2003): to distribute the entire British aid envelope in proportion to a per capita allocation score, also a combination of the same two selectivity factors (institutional/policy and poverty), adjusted by population size: (CPIA1.0 * GNIPC-1.0) *POP0.6.
Although poverty reduction is accorded a greater weight, the CPIA remains a decisive criterion in the distribution of the aid flows.
The United States
The United States set up the Millennium Challenge Account (MCA) following commitments made at the Monterrey Conference (2002) to substantially increase the amount of ODA at international level. The envelope for this new programme launched by the United States in 2003 should reach five billion dollars per year at cruising speed, representing a 50% increase in American aid and nearly 10% of the total volume of ODA. A total of 23 countries are eligible for the 2007 financial year.
Of the 16 indictors chosen to define country eligibility, five of the six KKZ base indicators have been included (with the exception of Political Instability) and two come from Freedom House (Civil Liberties and Political
Rights). The MCA is therefore the funding source that makes the most extensive use of the global governance
indicators. The reasons given to justify this choice, aside from their subject coverage, are their objective nature and their quality (“utilization of objective and high quality data” www.mcc.gov). Moreover, one of the indicators designed to reflect ‘economic freedom’ (Trade Policy) is produced by the Heritage Foundation, identified by Kaufmann et al. (2004) as being the only institution whose indicators show a significant preference for countries with right-of-centre governments (see below).
Given these circumstances, the quality of the indicators, if not in level, at least in their capacity to rank the countries, becomes crucial. Kaufmann and Kraay (2002 and 2003) draw attention to the inherent inaccuracy of governance indicators: confidence interval, measurement errors, volatility of perceptions, etc. They have even more reservations about the MCA’s allocation mechanism since the corruption indicator used by the MCA is precisely the CCI, based on the database that they themselves developed. Of the 74 countries eligible for the MCA in the first year and for which a corruption indicator is available for 2002, 28 have a probability of over 0.75 of being above the median while 22 have a probability of less than 0.25 and 24 countries have a probability of 0.25 to 0.75. Although the probability of a ranking error either side of the median is low for the first and second group of countries, it is high for the last group of countries. Fifteen of the 24 countries have an observed control of corruption level below the median and should therefore be excluded from the MCA under the adopted rules. More formally, 17 of the 74 eligible countries have an index significantly above the median (at the 10% level) while 11 have an index below the median (at the same level). However, no conclusive findings can be presented as regards 46 of the countries (62%) at the level of precision used.
To conclude, the use of the global governance indicators in the aid allocation strategy plays a role as much upstream as downstream of the process: both to show that the aid is only effective in well-governed countries5 and, on this basis, to determine the sums allocated by introducing an
institutional/policy selectivity criterion.
Criticisms of the inclusion of governance have hitherto concerned mainly the robustness of the econometric estimates. Very few studies have looked at the indicators themselves, except to mention their subjectiveness and, in some cases, their inaccessibility to researchers (e.g. the CPIA). From this point of view, mention should be made of the work by Kaufmann and his team on the need to consider their level of accuracy. Our study takes up this line. The reliability of the indicators is absolutely crucial in this area. Imagine that these indicators underestimated the real level of governance in the countries with the lowest incomes or those with the lowest growth and, more generally, the lowest economic performances. The populations of the poorly governed poor countries would be hit with a ‘triple whammy’: the whammy triggered by the shortcomings of their leaders, the whammy of the application of the principle of selectivity (less aid to poorly governed countries) and the whammy of the underestimation of governance indicators in the application of aid selectivity.
Not only would the poor countries be unduly penalised by receiving less aid than the donors should grant them based on their own criteria, but the very foundations of the selectivity could only be based on a statistical artefact: the real effect of governance on growth would be artificially overestimated. Here too, the sensitivity tests conducted by Kaufmann, Kraay and Mastruzzi (2005) to quantify the ‘halo effect’ appear to reject this hypothesis at the aggregate level. We will show that this finding, although it could well be true on average, does not necessarily hold for certain countries and certain governance components.
3.
THE SURVEY PROTOCOL AND THE DATAThe data used in this paper come from two complementary sources commissioned by the authors: - A set of household surveys on governance and democracy conducted in eight African countries; - An expert opinion survey on the same subjects in the same countries.
The mechanism is original and is worth outlining (for a detailed presentation, see Razafindrakoto and Roubaud, 2005a).
5 Note that Burnside and Dollar’s initial study was not based on a governance indicator, but on a measurement of the economic policies
conducted (inflation, fiscal surplus and trade openness). However, the gradual shift in thinking as regards “best practices” and “good institutions” has led most subsequent studies to use global governance indicators as the number of corresponding databases has risen.
3.1.
The population surveysAt the request of the WAEMU (West African Economic and Monetary Union) Commission, a series of 1-2-3 Surveys on household living conditions was conducted in the main conurbation (generally the capital) of seven WAEMU countries (Benin, Burkina Faso, Côte d’Ivoire, Mali, Niger, Senegal and Togo) from 2001 to 2003. These surveys were conducted by these countries’ national statistics institutes (NSIs) with the technical assistance of AFRISTAT and DIAL. At the same time, the same system of surveys was conducted in Madagascar (Antananarivo) by the local NSI. Basically, this mechanism is a system of three nested surveys designed to track trends in employment, the informal sector and poverty in the developing countries. The first phase is a survey on household employment, unemployment and working conditions (phase 1: employment survey). The second phase concerns the heads of informal production units (IPUs) and seeks to measure the production of the informal sector. The third phase is a household consumption survey designed to estimate the households’ standard of living and analyse the determinants of poverty; it also quantifies demand for the informal sector (phase 3: survey on consumption, points of purchase and poverty).
To this basic structure are added the subject-specific modules appended to one of the phases, depending on the statistical unit studied (household or individual). Three modules were developed in response to the specific concerns regarding the poverty reduction policies conducted by all the countries under the PRSP initiative. These modules draw on the experience gained by the Madagascar NSI in this area (Box 3). Following a first pilot test in Madagascar in 1995, variable subject-specific modules on governance have been conducted in the country every year. To our knowledge, the 1995 survey is the first attempt to measure households’ actual experiences of corruption in an official survey (Razafindrakoto and Roubaud, 1996). The first module concerns the Different Aspects of Poverty. It sets out to present original poverty indicators that do more than just measure monetary poverty (social exclusion, subjective poverty, vulnerability, etc.). Since the statistical observation unit for this module is the household, it was put to all the households polled in phase 1, making up samples of 2,500 to 3,000 households in each town.
Box 3: Complementary options to the global corruption indicators
The global indicators’ limits in terms of governance and, more specifically, corruption – lack of reliability of perceptions; impossibility of disaggregating the findings by sectors and players to steer policies – have prompted other measurement avenues to be explored. Microsurveys appear to be one of the most promising of the different options possible. In addition to its investment in the global governance indicators, the World Bank launched a vast programme in this regard in the late 1990s (Reinika and Svenson, 2006). Three main types of instrument were developed to track and explain corruption. The Public Expenditure Tracking Surveys (PETS) are designed to track and quantify the financial chain from the budgeting decided on at central level (budget act) through to the public services at the end of the line that are supposed to receive the funds. The first application of this method in Uganda showed that the state schools received less than 20% of the allocation (excluding wages) that should have come to them, since the monies were diverted en route for pork barrel projects. The public service surveys (Quantitative Service Delivery Surveys – QSDS) form a second approach. They collect detailed information on budgets, prices, inputs, products, service quality and operating modes to assess the economic efficiency of the institutions. For example, they can be used to quantify and qualify the phenomenon of absenteeism or ‘ghost’ jobs in the services studied. A third instrument directly measures corruption by means of surveys of businesses. The experiments conducted in different developing countries have shown that, by using suitable data collection strategies, in particular to establish a relationship of trust with the business people interviewed, it is possible to obtain relatively reliable information on the occurrences and sums concerned. The household surveys represent another important field of application to obtain microdata on corruption (Herrera, Razafindrakoto and Roubaud, 2007; Seligson, 2006). Based on the principle of ‘victimisation’ surveys, these studies identify acts of corruption with which individuals have been directly confronted and specify their characteristics. Given that there is less potential collusion between players (corrupter and corrupt agent), the information is easier to obtain and probably more reliable than in the case of corruption data collected at business level. However, the sensitive nature of the subject also calls for specific, tailored survey strategies to minimise understatement biases. These positive properties have prompted an international increase in this type of survey in recent years (Afrobarometer, Global Corruption Barometer, etc.). It is this last option that is used in this paper.
Box 3: Complementary options to the global corruption indicators (Contd.)
The example of Madagascar
The experiment conducted in Madagascar over the last ten years is a good example of the analytic potential of such an approach. In 1995, when Transparency International was setting up its Corruption Perceptions Index, a first pilot survey was conducted in the Madagascan capital, Antananarivo, to measure the extent of petty corruption. The Corruption module, inserted into an official household survey conducted by the national statistics institute, was put to a representative sample of 850 adults. To our knowledge, the 1995 survey was the first attempt by an official survey to measure actual experiences of corruption by households (Razafindrakoto and Roubaud, 1996). The module was conducted a second time in 1998, and was then systematically included in the standard survey on living conditions every year as of 2000. In 1998, the representative sample was extended to cover a total of 3,000 individuals every year.
This series of surveys, repeated over nearly a decade (to our knowledge, the longest run to date in a developing country), tracks corruption trends over time and provides a certain number of elements for the analysis of the phenomenon’s characteristics and a preliminary evaluation of the impact of public policies on corruption. Firstly, the findings show a significant and steady drop in the extent of petty corruption from 1995 to 2001. This dynamic could be tied in with the clearly positive trend in civil servant remuneration, also captured by the survey (Razafindrakoto and Roubaud, 2003). Secondly, the findings establish a direct relation between the quality of the institutions and corruption. The serious politico-institutional crisis in Madagascar following the disputed presidential election of December 2001 immediately gave rise to a spectacular increase in corruption, which doubled in the space of one year (Roubaud, 2002). The active anticorruption and pro-transparency policies subsequently put in place by the new leadership a priori played a not-inconsiderable role in the improvement in the situation.
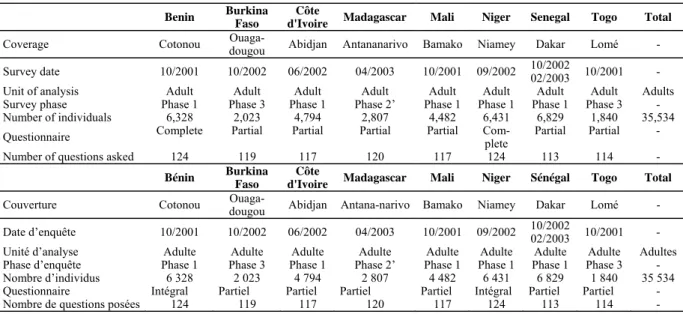
The other two modules on Governance and Democracy look at the population’s experiences and opinions in these areas. The Governance module focuses mainly on the running and efficiency of the public institutions, objectively and subjectively, and the role of central government. The Democracy model addresses three classic subjects in the field of political surveys: support for democratic principles, the actual running of democracy and the nature of the link between citizens and policy. Over 35,500 adults (individuals aged 18 and over) responded to the survey, with representative samples ranging from some 2,000 people (Burkina Faso and Togo) to over 6,000 (Benin, Niger and Senegal). The size of the samples polled makes this the largest survey conducted in Africa to date on these subjects6. Table 2 presents the main characteristics of the Governance and Democracy modules
used in this study.
Table 2: Main characteristics of the Governance and Democracy modules in Africa
Benin Burkina Faso
Côte
d'Ivoire Madagascar Mali Niger Senegal Togo Total
Coverage Cotonou Ouaga-dougou Abidjan Antananarivo Bamako Niamey Dakar Lomé -
Survey date 10/2001 10/2002 06/2002 04/2003 10/2001 09/2002 10/2002 02/2003 10/2001 -
Unit of analysis Adult Adult Adult Adult Adult Adult Adult Adult Adults
Survey phase Phase 1 Phase 3 Phase 1 Phase 2’ Phase 1 Phase 1 Phase 1 Phase 3 -
Number of individuals 6,328 2,023 4,794 2,807 4,482 6,431 6,829 1,840 35,534
Questionnaire Complete Partial Partial Partial Partial Com-plete Partial Partial -
Number of questions asked 124 119 117 120 117 124 113 114 -
Bénin Burkina Faso d'Ivoire Côte Madagascar Mali Niger Sénégal Togo Total
Couverture Cotonou Ouaga-dougou Abidjan Antana-narivo Bamako Niamey Dakar Lomé - Date d’enquête 10/2001 10/2002 06/2002 04/2003 10/2001 09/2002 10/2002 02/2003 10/2001 -
Unité d’analyse Adulte Adulte Adulte Adulte Adulte Adulte Adulte Adulte Adultes
Phase d’enquête Phase 1 Phase 3 Phase 1 Phase 2’ Phase 1 Phase 1 Phase 1 Phase 3 -
Nombre d’individus 6 328 2 023 4 794 2 807 4 482 6 431 6 829 1 840 35 534
Questionnaire Intégral Partiel Partiel Partiel Partiel Intégral Partiel Partiel -
Nombre de questions posées 124 119 117 120 117 124 113 114 -
Sources: 1-2-3 Surveys, Phase 1, Phase 3, Different Aspects of Poverty, Governance and Democracy modules, 2001/2003, National Statistics Institutes, AFRISTAT, DIAL, authors’ calculations
6 Two other similar regional projects have also been conducted on the continent (the Afrobarometer project and the ECA’s African
Governance project). Although they cover a larger number of countries and have national coverage, the samples are smaller (around 1,000
The collection of objective data (behaviour and actual experiences) and subjective information (perception and satisfaction) on poverty, governance and democracy provides the means to monitor and compare two key and equally important aspects of these issues. For example, the perception of corruption can have just as decisive an impact on a country’s political or economic stability as the real extent of corruption. Moreover, these two aspects can be combined with classic variables concerning the individuals and households’ socio-economic characteristics (income, occupation, gender, age, etc.). The findings can hence be disaggregated and specific population group characteristics and disparities highlighted, focusing in particular on the poorest and those who suffer the most discrimination. The great advantage of these surveys is that they are conducted simultaneously using strictly identical protocols for all the countries, which lays the foundations for real regional data comparability.
The corruption questions of interest to us here concern as much the perception of the phenomenon (perceived level of corruption in the country, growth over time and tolerance of corrupt behaviour) as the objective data. Each survey respondent was asked if he or she had personally been affected by corruption in the year preceding the survey and, if so, on what occasion (type of transaction and service concerned) and the total sum paid out on corruption over the year. Corruption was defined in the standard way as the illicit payment (in money or in kind) to a government official in the course of his duties. Particular care was taken to guarantee the quality of the information collected (training the interviewers, building a relation of trust with the interviewee, guarantee of confidentiality, translation of the questionnaires into the local languages, harmonised definition of the term ‘corruption’, etc.). Despite all the precautions taken with data collection, the possibility of a response bias cannot be totally ruled out. Individuals’ reluctance or ‘fear’ of expressing their real opinion is often raised as a possible source of bias, which would bring into question data reliability. However, this hypothesis is rejected by the presence of highly negative views of the leadership, especially in an authoritarian country such as Togo (Box 4). These arguments, the respondents’ considerable interest in governance issues, the interviewers’ impressions concerning data collection, the low non-response rates and the internal consistency of the data all suggest that we can place a great deal of trust in the population’s statements.
Box 4: The population is not afraid of criticising the regime in power
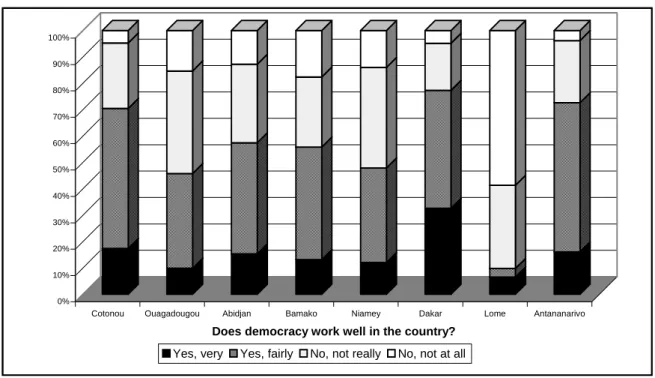
The sensitive nature of some of the questions could lead the population to give favourable opinions of the regime or answers to avoid any comeback. Answers can be tested for the existence of a bias by observing whether the ‘fear’ of answering sensitive questions varies from one country to the next. In particular, is the observed deviation between the experts’ opinions and the populations’ statements (see the following section) really a reflection of a different bias between countries when it comes to reporting actual experiences of everyday corruption? The case of Togo provides good evidence to the contrary. Is the lower rate of corruption observed in this country not simply a reflection of the authoritarian nature of the regime and the atmosphere of suspicion leading households to understate corruption out of fear of reprisals? The findings of the household surveys lead us to reject this hypothesis. If the inhabitants of Lomé were scared to the point of not daring to admit having been victims of corruption, then, for the same reasons, they should have been led to minimise other forms of government and political system dysfunctions. Yet this is not the case. For example, they have no qualms about massively criticising democracy’s dysfunctions in the country (see chart in the appendix). Less than 10% gave a positive answer to the question, “Do you think democracy works well in the country?”: 3% said fairly well and 6% said very well. This positive opinion is obviously given by supporters of the regime in power. Togo differs from the other countries on this subject. On average, 61% of the citizens think democracy works well.
This widespread criticism of real democracy in Togo can also be observed for other types of indicators such as respect for democratic principles (see table in the appendix). And it is especially the case with the freedom of speech, electoral transparency, equality before the law and respect for human rights, which we know to be flouted. The criticism also extends to confidence in the political institutions and support for the regime in place, by far the lowest in the region (Razafindrakoto and Roubaud, 2005a). So, despite the regime, the inhabitants of Lomé are not reluctant to give extremely negative opinions of the authorities (tables A1 and A2 in the appendix). Moreover, they put forward an informed analysis of the nature of the problems, which they see as being due not to petty bureaucratic corruption, but to the failings of democracy. The experts, on the other hand, do not appear to be capable of really distinguishing between the different elements of governance. They provide more of an overall assessment.
Furthermore, to prevent certain respondents from being tempted to gloss over these experiences, especially when they themselves had played an active role in the transaction, the question was put in the following way: “Have you been a victim of corruption over the past year?” Even though, in some cases, the respondent probably offered a payment or illicit gift on his or her own initiative, what we are interested in first and foremost is identifying the transactions where corruption is involved, irrespective of who is responsible.
Two further points are worth mentioning, in that they set apart our survey from other similar surveys. Firstly, we have taken into account the fact that a certain number of constituents have not been in contact with the public services. This aspect is particularly important in that the frequency of interactions with the administration varies from one social group to the next (it is lower among the poor) and that certain users might steer clear of the public services precisely because they are afraid of being confronted with corruption. This means that not controlling for actual access to the public services leads to an underestimation of the real risks of corruption. Secondly, our measurement of incomes (and therefore monetary poverty) is lower than in most of the surveys on corruption due to the fact that the objective of the basic survey is precisely to quantify in detail the incomes of each household member.
Lastly, note that this study only covers one of the possible forms of corruption: that which occurs when the population enters into contact with the public administration. We have not sought to capture political corruption (such as vote buying), let alone large-scale corruption (public procurement and embezzlement of public funds), since the very nature of the household surveys makes them unsuitable for this purpose. Our approach can be considered to capture petty administrative corruption.
3.2.
The Mirror SurveyAn expert opinion survey was conducted in the eight African countries to round out the household surveys on Governance and Democracy. The aim of this Mirror Survey, to which 350 experts from the South and the North (researchers, development workers, ‘decision-makers’, high-ranking public officials, politicians, etc.) responded, was to compare the population’s responses with those of the experts on a certain number of questions common to both studies.
The ‘experts’ were asked to select a country (from the eight) based on their own individual knowledge and then to fill in the Mirror Survey questionnaire, which is actually a simplified version of the questionnaire put to the population. Two sets of questions were put for each of the two modules (Governance and Democracy):
- The first set of questions conventionally concerns the expert’s own opinion on certain governance issues. For example, to the question, “Does the administration work well in the country?”, they were asked to give their personal point of view on the public administration’s efficiency in the chosen country;
- The second and more original set of questions is designed to measure what the experts thought the interviewees answered on average. For example, given the same question as above, each respondent was asked to estimate the percentage of the population who consider that the administration works well in the chosen city.
Lastly, to hone the analysis, the experts were asked to provide a certain number of personal socio-demographic characteristics: gender, age, occupation, country of origin, etc. And to gain a better gauge of their level of knowledge, the experts scored their own expertise in governance issues in general and in their chosen country.