HAL Id: hal-03049602
https://hal.archives-ouvertes.fr/hal-03049602
Submitted on 30 Dec 2020
HAL is a multi-disciplinary open access archive for the deposit and dissemination of sci-entific research documents, whether they are pub-lished or not. The documents may come from teaching and research institutions in France or abroad, or from public or private research centers.
L’archive ouverte pluridisciplinaire HAL, est destinée au dépôt et à la diffusion de documents scientifiques de niveau recherche, publiés ou non, émanant des établissements d’enseignement et de recherche français ou étrangers, des laboratoires publics ou privés.
Insights on the Al-Cu-Fe-Mn intermetallic particles
induced pitting corrosion of Al-Cu-Li alloy
Meicheng Li, Antoine Seyeux, Frédéric Wiame, Philippe Marcus, Jolanta
Swiatowska
To cite this version:
Meicheng Li, Antoine Seyeux, Frédéric Wiame, Philippe Marcus, Jolanta Swiatowska. Insights on the Al-Cu-Fe-Mn intermetallic particles induced pitting corrosion of Al-Cu-Li alloy. Corrosion Science, Elsevier, 2020, 176, pp.109040. �10.1016/j.corsci.2020.109040�. �hal-03049602�
Insights on the
Al-Cu-Fe-Mn intermetallic particles induced
pitting corrosion of Al-Cu-Li alloy
Meicheng Li, Antoine Seyeux, Frédéric Wiame, Philippe Marcus and Jolanta Światowska*
Chimie ParisTech - CNRS, PSL University, Institut de Recherche de Chimie Paris, 11 rue Pierre et Marie Curie, 75005 Paris, France
Abstract
The pitting corrosion and surface modifications of aluminium alloy AA2050-T8 (Al-Cu-Li) resulting from immersion in 0.1M NaCl at open circuit potential were studied by time-of-flight secondary ion mass spectrometry (ToF-SIMS). ToF-SIMS chemical mapping showed a local distribution of chlorides and hydroxides in the pits enriched in Cu and Fe. Preferential sites of corrosion initiation were evidenced in the alloy matrix close to Al-Fe-Cu-Mn intermetallic particle. A formation of an oxide-hydroxide layer with different composition and/or higher thickness was evidenced over IMP than the alloy matrix. LiOx dissolved from the oxide layer but metallic lithium was still present in the matrix.
Keywords: aluminum alloy AA2050 (Al-Cu-Li) alloy; intermetallic particles; lithium; pitting
corrosion; oxide layer; ToF-SIMS chemical mapping and depth profiles
1. Introduction
Al-Li alloys have been developed since 1958 as advanced materials for aircraft manufacturing [1]. The presence of Li in the Al alloy allows to decrease the alloy density and improves its mechanical properties. Indeed, the addition of 1 wt% Li results in a significant reduction of weight (3 %) and a considerable increase in elastic modulus (6 %). When the content of Li is over 1.3 wt%, the tensile strength and thermal stability of Al-Li alloy decrease. Moreover, the material may show higher anisotropy of mechanical properties [2]. A development of one of the first generations of Al-Li alloys was focused on the lightweight but their low mechanical properties limited the applications of these alloys. In order to optimize the Al-Li alloy properties (i.e. density, mechanical properties and thermal stability), the content of Cu in Al-Li alloy was increased and Li was limited to 1.3wt% [2–4]. AA2050 is such an Al-Cu-Li alloy, produced by Alcan since 2004. AA2050 has better mechanical properties, higher corrosion resistance and lower density compared to conventional Al alloys such as AA2024 and AA7075 used for aircraft and heavy lift launch vehicles [5–8]. Al-Cu-Li alloy has been used on the Boeing 777 as an advanced material for reducing weight [9]. Several studies have shown that Al-Cu-Li alloys have better corrosion resistance compared to other conventional Al alloys [2,4,10]. However, the corrosion behavior of Al-Cu-Li alloy is still an open subject as Li is considered as one of the possible factors of the alloy instability and leads to a complex corrosion behavior [11,12]. Severe intergranular (IGC) and transgranular corrosion (TGC) observed in Al-Cu-Li alloys, largely depend on the Li dissolution principally observed in the nano-sized T1 phase (Al2CuLi). The presence of Li in T1 phase makes it more anodic than the matrix and prone to dissolution. The T1 phase is preferentially located in the regions with high density of dislocations or high level of misorientation [13–16]. It can also be significantly influenced by thermal treatments during alloy processing. Therefore, some studies focused on the relation between the distribution of T1 phase induced by thermal treatment and corrosion behavior of Al-Cu-Li alloys [17–19].
Pitting corrosion is another main type of corrosion. Al-Fe-Cu-Mn IMPs (dimension > 1 µm) in Al alloys are considered as one of the preferential sites of pitting corrosion [20-22]. Birbilis et al. [21] evidenced the cathodic behaviour of Al7Cu2Fe particles in AA7075-T651 (Al-Zn-Mg-Cu) alloy leading to the pitting corrosion between matrix and IMPs. Boag et al. [22] studied the pitting corrosion of AA2024 Al-Cu-Mg alloy in NaCl electrolytes and also found a preferential corrosion at the interface of Al-Cu-Fe-Mn particle and matrix. The pit propagation induced by Al-Cu-Fe-Mn IMPs was studied by Zhou and Glenn [23, 24] on AA2024 who found that they had a significant influence on extensive grain boundary attack. In the case of Al-Cu-Li alloy (AA2090), Buchheit et al. [17] concluded that there are two corrosion mechanisms. One is the dissolution of anodic T1 phase located at grain boundaries. The other is the pitting corrosion that occurs close to the Al-Fe-Cu-Mn IMPs. However, the distribution of Li in Al-Fe-Cu-Mn IMPs and its effect on pitting corrosion is not clear yet. Few studies tried to evidence the distribution of Li in IMPs. MacRae et al. [25] studied the composition of coarse IMPs and found the existence of Li inside the IMPs by using soft X-Ray emission spectroscopy. Ma et al. [26] investigated the pitting corrosion of Al-Cu-Li alloy (AA2099) and evidenced two kinds of corrosion morphology on the Fe containing IMPs with different Cu contents. They showed that IMPs with higher Cu content containing more Li (evidenced by electron energy loss spectroscopy) are more reactive. The IMPs with lower Cu content showed trenching and the IMPs with higher Cu content showed dissolution of Al and Li over the IMPs. However, as described in Ma’s study, pitting in both cases was superficial. Some researchers claimed that the presence of Li in the Al alloy increases corrosion resistance [4, 27]. The corrosion can be inhibited by the higher concentration of OH− which produced by the reaction of metallic Li with water. This OH− which can neutralize the acidic pitting region and make the pits more superficial [28, 29]. Ghanbari and Lei [28, 29] applied various electron microscopy and electrochemistry techniques and point defect model method to investigate the localized corrosion of Al-Li alloys in order to prove the effect of Li. In their study, the formation of more superficial pits and better corrosion resistance was confirmed in the Al-Li alloy with highest content of Li.
Although, the effect of T1 phase on the corrosion of the Al-Li alloys has already been studied by electrochemical and microscopic techniques, the exact effect of Li and its
distribution on chemical modifications and corrosion of Al-Li alloys is still unclear [30]. Li is difficult to characterize, particularly at such low concentration (around 1 % in the alloy), due to the low detection limits of different techniques (e.g. energy dispersive x-ray spectroscopy (EDS)) and high reactivity of Li, which is prone to dissolve once exposed to electrolyte. Time-of-flight secondary ion mass spectrometry (ToF-SIMS) is a highly sensitive surface technique and is able to detect a low amount of Li. Thus, in this study, ToF-SIMS ion depth profiling and chemical mapping were combined with scanning electron microscopy (SEM) to analyze the sample before and after corrosion and to better understand the corrosion behavior of AA2050-T8 (Al-Cu-Li) alloy and its Al-Fe-Cu-Mn IMPs in 0.1 M NaCl electrolyte. Series of ToF-SIMS imaging were performed on a pitted region to get information about the chemical composition of pitted areas and chemical modifications of the alloy matrix and Al-Fe-Cu-Mn IMPs. The in-depth distribution of Li and other alloying elements (Cu, Mg, Fe) were also analyzed before and after corrosion.
2. Experimental 2.1 Samples
The specification of AA2050-T8 (Al-Cu-Li) alloy used in this study is presented in table 1. The samples were provided by Constellium, France. The specimens were cut into 8.0 mm×8.5 mm pieces (about 3 mm thickness). Surface preparation was performed by mechanical polishing with SiC paper from 320 to 4000 grades then by mirror polishing with alumina suspension down to 0.3 µm. After polishing, samples were cleaned by successive ultrasonic baths in iso-propanol, ethanol and finally Ultra-pure (UP) Millipore water (resistivity >18 MΩ cm) then dried by filtered compressed air.
Table 1. Specification of AA2050-T8 (in wt. %).
Cu Li Mg Zn Mn Ag Zr Fe (max) Al
2.2 Immersion tests
The polished AA2050-T8 samples were immersed in 0.1 M NaCl electrolyte prepared with NaCl (VWR, 99.9%) and UP Millipore® water (resistivity > 18 MΩ cm) for 45 minutes at the open circuit potential (OCP). The potential was controlled by a Reference 600 potentiostat (Gamry). A classical 3-electrode electrochemical cell with a platinum wire and a saturated calomel electrode (SCE) were used as counter and reference electrodes, respectively, and a polished AA2050-T8 sample as a working electrode. The corroded AA2050-T8 samples were then rinsed with UP water, dried and transferred for analysis by ToF-SIMS, optical microscopy and SEM/EDS.
2.3 Surface characterization
ToF-SIMS measurements were carried out using a ToF-SIMS V spectrometer (ION TOF GmbH, Munster, Germany) operating at high vacuum (10−9 mbar). The first series of analysis (the in-depth profiles and ToF-SIMS images) were performed on AA2050-T8 sample before and after immersion in NaCl, then the second series of analysis (ToF-SIMS images) was done on the sample AA2050-T8 on which the region of interest with the IMP was first identified then the same region was analyzed after immersion. To do so, before measurements, the surface sample was marked by etching the number “1” using the Cs+ sputtering beam of the Ion-ToF spectrometer in order to easily identify the same analyzed area called here the region of interest. ToF-SIMS ion-depth profiles were performed by using a 2 keV Cs+ beam delivering a 100 nA current for sputtering and a pulsed 25 keV primary Bi+ delivering a 1.2 pA current (in high current bunched mode) for analyzing. In the high current bunch mode a lateral resolution was around 5 m and a mass resolution M/M around 7000. The sputtered area was 1000 µm × 1000 µm and the analyzed area was 100 µm x 100 µm.
Tof-SIMS imaging (chemical mapping) was performed over the area of 100 µm × 100 µm including the selected Al-Fe-Cu-Mn IMP before and after corrosion. ToF-SIMS images were performed at different depths corresponding to different sputtering times: 60 s (attributed to the oxide part) and 150 s (attributed to the oxide/metal interface). A 1 keV Cs+ beam delivering a 38 nA current was applied for sputtering (500 µm × 500 µm) and 25 keV primary
Bi+ beam was set in burst alignment mode with a primary current adjusted to 0.3 pA over the total area (100 µm × 100 µm). In order to get a high lateral resolution and a good mass resolution the long primary pulses are split into four small pulses. In this mode a lateral resolution was around 200 nm and a mass resolution M/M around 7000, pixel array was 256x256. Data treatment and post processing of ToF-SIMS measurements were performed with Ion-Spec software (version 4.1).
2.4 Microscopy characterization
The AA2050-T8 morphology (comprising the region of interest) before and after corrosion was also analyzed by a digital VHX-5000 Keyence optical microscopy. SEM using Zeiss Ultra55 microscope with high-resolution Schottky thermal field emission gun (Schottky SEM-FEG) was used to select the region of interest with an Al-Fe-Cu-Mn IMP close to the ToF-SIMS formerly identified region with mark “1” made by Cs-ion beam.
3. Results
3.1 Morphological characterization of AA2050-T8 after corrosion
During immersion in the 0.1 M NaCl electrolyte, the OCP of AA2050-T8 decreased approximately from -0.5 (±0.1) V to -0.68 (±0.03) V vs SCE. This finale potential is close to the pitting potential (around -0.70 (±0.03) V vs SCE) of Al-Cu-Li alloys in 3.5 wt. % (~0.6 M) NaCl electrolyte as observed previously on AA2198, AA2524, AA1460 Al-Cu-Li alloys and AA7050 Al-Cu-Mg alloy [27,30]. The immersion leads to formation of numerous corrosion pits as observed by optical microscopy (Fig. 1) and ToF-SIMS chemical mapping (see Fig. 3 on AlO2- ion map). Similar modifications with significant pitting were observed before on AA3003 and AA7075 in 0.1 M NaCl by Liu [31] and Birbilis [21], respectively.
3.2 Chemical surface and in-depth analysis of AA2050-T8 before and after corrosion
In order to get more information about surface chemical modifications of AA2050-T8 induced by immersion in chloride electrolyte (0.1 M NaCl in 45 min), ToF-SIMS ion depth profiles were performed and compared to polished sample (Fig. 2). The ion intensities are plotted versus Cs+ sputtering time in logarithmic scale in order to enhance the low signal intensities. Al2− (m=53.9634 u), AlO2− (m=58.9728 u) and AlO2H− (m=59.9812 u) signals represent Al metal, Al oxide and hydroxide, respectively. 18O− isotope ion was chosen to represent oxygen since 16O− saturates the detector. Cl− (m=34.9696 u) was recorded to observe the corrosion products and the presence of some chloride residues. Cu− (m=62.9268 u), Li− (m=7.0168 u) and MgO− (m=39.9797 u) ion profiles were also plotted to observe the alloying elements. The identification of Zn and Zn compounds (Zn− (m=63.9413 u), ZnO− (m=79.9355 u)) was not possible due to the overlap with Cu (CuH− (m=63.9268 u), CuOH− (m=79.9354 u), respectively) and difficultly in detection of other Zn isotopes.
Three regions can be identified in ToF-SIMS depth profiles, thanks to the intensity modifications of the ions corresponding to oxide and substrate species (Fig. 2):
1) the oxide layer (up to about 70 s of sputtering time),
2) the interface layer (from about 70-80 to about 150-160 s of sputtering),
3) the metal substrate (from about 150-160 s of sputtering where the intensity of Al2− and Cu- signals reaches a plateau).
At very first seconds of sputtering rapid signal intensity changes are observed, which then tend to stabilize with increasing sputtering time. The oxide layer extends up to the position where the AlO2− and 18O- signals reach the maximum intensity (i.e. about 70 s of sputtering time). This region can also be delimited from the high intensity of AlO2H− signal (for pristine surface), indicating the formation of an aluminium oxide-hydroxide layer covering the metallic substrate. After corrosion the intensity of AlO2H− decreases slightly compared to the pristine sample indicating chemical modifications of the oxide layer.
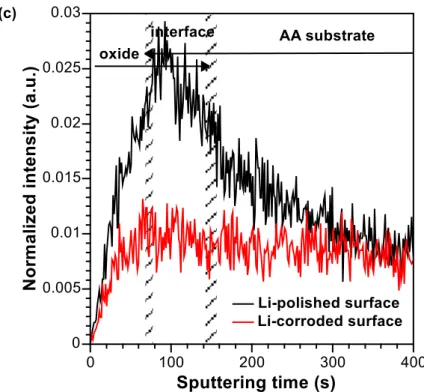
A Li− ion intensity increase is observed in this region up to the interface region for the pristine sample. Less abrupt intensity increase of Li- can be observed for the corroded sample (see also normalized Li- ion profiles in linear scale for pristine and corroded sample in Fig. 2(c)). It can be then concluded that Li enrichment is observed in the oxide layer of pristine sample then it undergoes dissolution in the chloride solution. A Li enrichment in the oxide layer was also found by means of Glow-discharge optical emission spectroscopy elemental depth profiles by Gharbi et al. [32] for a AA2050-T3 alloy after pretreatment and anodically polarized alloy in the neutral NaCl electrolyte. This Li enrichment can be explained by easier Li oxidation at the surface compared to other elements such as Mg as observed in our previous work [33]. No significant modifications are observed for the MgO -profile for the pristine and corroded samples.
Relatively high Cl- signal intensity is observed on the pristine surface, which can be explained by sample exposition to the ambient atmosphere, some pollutions due to the sample cleaning/rinsing. It should be emphasized that due to the high sensitivity of ToF-SIMS technique even a very low quantity of certain elements can be easily detected (which is the case of chloride ions in negative polarity). However, significant increased intensity of Cl- signal (few orders of magnitude) is observed for the corroded sample in the oxide region. The signal intensity progressively decreases with sputtering time. An intersection point of Cl- and 18O− signals is observed at the beginning of the depth profile (at about 20 s of sputtering) for the pristine sample. For the corroded sample this intersection is shifted to longer times of sputtering (about 60 s). Moreover, for the corroded sample, the Cl- signal is relatively high and almost overlapped with the 18O− signal during the whole time of sputtering indicating the enrichment in chlorides.
The interface region is the intermediate region between the oxide and the metallic substrate region and the width of this region depends on the sample roughness. A step increase of the Al2- signal (comprised between the first plateau characteristic of the oxide region and the second plateau characteristic of the substrate region) can be observed here. Similarly, to Al2- signal, the Cu- ion profile shows a significant intensity increase in this region. However, the Cu- signal shows a maximum intensity when reaching the substrate region,
which indicates a metallic copper enrichment in the alloy at the metal/oxide interface. The ion profiles corresponding to the oxides and hydroxides (AlO2-, 18O-, AlO2H-) show a decrease of intensity with increasing sputtering time.
The substrate region (from about 140 s) can be characterized by almost stable intensity of Al2- and Cu- profiles.
3.3 Chemical mapping of AA2050-T8 after corrosion
As aforementioned, the ion depth profiles represent the average chemical distribution over the analyzed surface (100 µm x 100 µm). However, the aluminium alloys show important surface chemical heterogeneities, due to the presence of different IMPs [34, 35]. Thus, the ToF-SIMS chemical mapping was performed on the AA2050-T8 after immersion in 0.1M NaCl electrolyte in the oxide region (Fig. 3(a) after sputtering to 65 s) and at the metal / oxide interface (Fig. 3(b) after sputtering to 150 s). Fig. 4 presents the corresponding overlay of AlO2- and Cl- ions.
The surface is not homogenous and this is particularly reflected by variation in the signal intensity in O−, OH−, Cl−, AlO2− two-dimensional (2D) mapping in the oxide (Fig. 3 (a), (b)) and at the interface and, additionally, from Al2− mapping performed in the interface region (Fig. 3(b)). Locally higher Cu− and FeO− intensity signals are also observed in the interface region (Fig. 3(b)). Several points with higher intensity signal can be observed in the Cl− ion mapping. The higher intensity of Cl- overlaps with a lower signal intensity of AlO2− (Figs. 3 and 4) and Al2− in the substrate region (Fig. 3(b)) indicating pitting corrosion after immersion in 0.1 M NaCl for 45 min. Some larger pits show higher intensity of other ions such as OH− in the oxide region (Fig. 3(a)). In the metal/oxide interface region (Fig. 3b) the OH− intensity is even higher and some additional pits with OH− enrichment can be observed with respect to the oxide layer (Fig. 3(a)), indicating, that the corrosion products (OH−) are buried under the oxide layer. The high intensity of OH− and Cl− ion signals at pit locations corresponds also the higher intensity of Cu− and FeO− at the metal/oxide interface (Fig. 3b) indicating that the corrosion is induced by the presence of Cu and Fe-rich intermetallic
particles, assigned to the Al-Fe-Cu-Mn IMPs. These types of IMPs are sensitive sites for pitting corrosion, and corrosion initiation [17, 36]. Moreover, the presence of OH- and Cu- in some pits (usually bigger in size) corroborates with a trace of CuOH− species as shown in supplemental information (Fig. S1). As discussed above due to the ZnO− (m=79.9355 u) overlapping with CuOH− (m=79.9354 u), the analysis of OH related species is difficult. However, the presence of ZnO− can be discarded since the OH−, Cu− and CuOH− signals are observed in the same pitting spots.
3.4 Chemical mapping in the area of Al-Fe-Cu-Mn IMP before and after corrosion of AA2050-T8
A local surface characterization of the AA 2050-T8 sample before and after corrosion was performed using ToF-SIMS chemical mapping combined with morphological and chemical characterization by SEM. First of all, on the pristine AA 2050-T8 sample before corrosion, a region of interst with a typical Al-Fe-Cu-Mn IMP (with a size of around 30 µm) was selected by means of SEM (Fig. 4 (a)). The chemical composition of the selected IMP was characterized by Tof-SIMS chemical mapping in positive mode, performed on the AA 2024-T8 sample after removing the whole oxide film to reach the metallic substrate (Fig. 6(a)). The positive mode has a better sensitivity to metallic species. The high signal intensity of Fe, Cu, Mn elements in the IMP indicates that this IMP corresponds to the Al-Fe-Cu-Mn IMP. It should be noted that Tof-SIMS is not a quantitative technique and does not allow us to calculate the exact stoichiometry of this IMP. Li ion mapping shows that Li is principally observed in the Al matrix. The lateral resolution of ToF-SIMS chemical images (around 200 nm) and the size of the ToF-SIMS chemical images (100 µm x 100 µm) do not allow us to
observe the presence of Li in the nano-sized T1 phase in the alloy matrix. Thus, T1 phase is considered as part of “matrix” where the Li signal shows a rather homogenous intensity. The homogenous distribution of T1 phase in the matrix of AA2050-T8 alloy was confirmed by the TEM analysis shown in the Supplemental information in Fig. S2. ToF-SIMS (Fig. 6) shows
also a low intensity and inhomogeneous Li signal inside the IMP. Li inside the IMPs was also previously observed by Ma et al. [26] who concluded that the localized distribution of Li in the IMPs was associated to presence of Cu. However, no correlation between Cu and Li distribution was observed in our study.
Immersion in NaCl electrolyte did not remove the selected IMP as shown by SEM in Fig. 5 (b). The surface morphology of the aluminium alloy matrix and intermetallic particle is modified and shows a formation and deposition of corrosion products. As discussed in the literature, a dissolution of the surrounding aluminium matrix leading to protrusion of the cathodic IMPs is a typical corrosion mechanism [37,38], however here the SEM image does not allow us to directly conclude about it. The zoom on the IMP presented in the inset of Fig. 5 (b) shows the formation of a pit of ~1 µm in diameter close to the IMP.
A set of ToF-SIMS images were performed in the positive and negative modes in the same region of interest to better understand the chemical modifications of IMP and surrounding matrix induced by corrosion. The chemical mapping in negative mode used for better sensitivity to the oxidized species was performed at two different sputtering depths of 65 s and 150 s corresponding to the oxide layer (Fig. 7a) and oxide/metal substrate interface (Fig. 7b), respectively. The sputtering times (at which the images were performed) were chosen based on the ion depth profiles shown in Fig. 2.
ToF-SIMS chemical mapping performed in the oxide region (at 65 s of sputtering in Fig. 7 (a)) shows a relatively high and stable intensity of AlO2H− and O−, AlO2− signals, which indicate the formation of a thick and dense homogeneous oxide-hydroxide layer over the whole alloy surface exposed to NaCl electrolyte. However, a slightly higher OH− signal intensity and a lack of the Al2− signal over the IMP than the matrix can be observed (Fig. 7 (a)). A stronger contrast of the OH− signal between the IMP and matrix can be observed in the images taken deeper (at 150 s of sputtering depth, Fig. 7(b)) corresponding to the oxide/metal substrate interface. Here at this depth, much higher intensity over the IMP can be also observed for O−. These results can indicate the formation of a highly hydrated oxide-hydroxide (corrosion) layer with a different composition over the IMP than over the matrix.
to differences in sputtering rate in the IMP and matrix regions. However, assuming a similar sputtering rate over the whole analyzed area (IMP and matrix), the formation of the thicker oxide-hydroxide layer over the IMP than the matrix is suggested. This hypothesis can be also supported by the lack of Al2− signal over the IMP and the presence in the matrix region in the image of Al2− signal (in Fig. 7b) after 150 s of sputtering.
Summarizing, these results (high O− and OH− and low Al2− signals) indicate the formation of an oxide-hydroxide layer with a different composition and/or thickness over the IMP than over the matrix. These chemical variations induced at the surface by corrosion and strongly influenced by the alloy composition and presence of IMP will be discussed in the next section.
It should be also noticed that the intensity of O− signals is not the same over the IMP region, and a higher intensity can be observed at the IMP periphery (Fig. 7b and O− chemical mapping after image treatment in Fig. S4) as also demonstrated previosuly [39,40].
In Fig. 7 (a) and (b), a highlighted point (pit) in the Cl− ion mapping close to IMP is observed. Combined with the SEM presented in Fig. 5 (b), it can be concluded that the enrichment in Cl− species is associated to pitting corrosion. The chloride species enrichment in the pits is in agreement with the results discussed above and presented in Fig. 3 and 4.
To have a better insight into the lateral distribution of alloying elements such as Cu, Li, Fe and Mn corresponding to the Al-Fe-Cu-Mn IMP, the chemical mapping was also performed in positive mode at the oxide/metallic substrate interface (150 s sputtering time) (as shown in Fig. 6(b). The comparison of the chemical maps recorded after corrosion (Fig. 6 (b)) with maps obtained before corrosion (Fig. 6 (a)) shows clearly the inverse signal intensity in the matrix and IMP for Cu+ and Mn+. After corrosion the enrichment of Cu and Mn was not observed anymore in the IMP region but in the matrix. Only slightly higher intensity in the area of IMP was observed for Fe+ indicating the presence of IMP. As aforementioned, the ToF-SIMS chemical maps were obtained at the oxide/metal substrate interface, however the lack of Cu, Mn corresponding to the IMP indicates that after 150 s of sputtering the oxide/metal interface was reached at the matrix region but not for IMP region. This confirms the hypothesis of a thicker layer or a layer with different composition (different nature) formed over the IMP than over the matrix.
A higher intensity of Cu adjacent to IMP was also observed in the positive mode image (Cu+ in Fig. 6b). The analysis of the same area by SEM, allowed to conclude that this Cu enrichment is located at the area of small pit where the presence of Cl was also observed (Cl -in Fig. 7).
The higher Li+ intensity in the matrix than in the IMP was observed after corrosion (Fig. 6a) and this lateral distribution of Li is similar to the pristine sample (Fig. 6b). The presence of Li in the alloy matrix indicates that Li is probably in a metallic state. The presence of other possible Li-related negative secondary ions (such as LiO−, LiOH−) were carefully checked and they were not detected after corrosion confirming the dissolution of Li from the oxide layer (as also discussed for the negative ion depth profile presented in Fig. 2b).
4. Discussion
Combined SEM and ToF-SIMS analyses were applied to study the pitting corrosion behavior of AA 2050-T8 and the surface chemical modifications of the alloy induced by immersion in 0.1 M NaCl. Optical microscopy images indicated a significant pitting corrosion of AA2050-T8 occurring in NaCl electrolyte. The surface attack by chlorides was also observed by ToF-SIMS chemical mapping, with the presence of high Cl− signal intensity in the pits. The thorough analysis of ToF-SIMS mass spectra was unsuccessful in observing the metallic cation, associated to Cl, which could correspond to the formation of MeCl species. It was also demonstrated by Grilli et al. [41] that, even in the presence of Cl, no Al-Cl species were detected due to high solubility of AlCl3 during sample rinsing. Also, the insoluble CuCl, CuCl2 and their complexes can be washed away from the surface, and only some possible residual quantities can be present in the sample cavities like pits and pores.
A higher intensity of Cu− and FeO− observed in the area of larger pits indicates a relation of pits formation and presence of IMPs (Fig. 3). This conclusion was also confirmed by the local characterization of well identified Al-Fe-Cu-Mn IMP before and after corrosion (Fig. 5, 6 and
7). The analysis showed that pitting corrosion occurred in the area adjacent to the IMPs with a significant surface chemical modifications over IMPs.
However, the formation of pits, widely reported in literature [15, 21-23], is not the only evidence of the AA2050-T8 corrosion in NaCl electrolyte. Some important surface modifications occur over the matrix and over the IMPs during alloy exposure to chloride-containing electrolyte as demonstrated in our results. ToF-SIMS images performed in the oxide (65 s of sputtering) showed that the surface after corrosion is covered by a continuous Al oxide and hydroxide layer including both matrix and IMP (similar intensities of AlO2− and AlO2H− shown in Fig. 7 (a)). ToF-SIMS images performed after longer sputtering time (150 s) corresponding to the oxide/metal substrate interface showed differences in lateral distribution of Al oxide (AlO2−) and hydroxide (OH-) indicating a more important thickness and highly hydrated oxide layer over the IMP (Fig. 7(b)). The difference in the layer thickness and/or composition over the IMP compared to the matrix can be related to different behaviors during the immersion in chloride solutions. This different activity of IMPs is related to the cathodic character of IMPs as previously evidenced for Fe-Cu-Mn-containing IMPs [21,38,42–45]. Over the IMP a cathodic reaction of oxygen reduction (ORR) or hydrogen evolution (HER) occur [43]. Both cathodic reactions lead to the local pH change in the region adjacent to the IMP and dissolution of Al alloy. As a consequence, corrosion products (O and OH-rich) form a layer of deposit over the IMPs [12, 45-47]. Due to the high difference of the corrosion potential between the more cathodic (more noble) Cu-rich IMP and a more anodic Al alloy, Al matrix dissolution is enhanced. Moreover, a more severe corrosion at the interface of IMPs and matrix and initiation of pitting corrosion can be observed here (Fig. 5, 6, 7). A similar behavior was demonstrated in previous works. Büchler [39,40] using fluorescence microscopy to trace the distribution of corrosion products and reporting fluorescent rings around the IMPs, which indicated the stronger reaction at the IMP periphery. It was concluded that aluminium oxidation occurs at the border of matrix and cathodic IMPs while the oxygen reduction takes place over the IMPs. Grill et al. [41] used Auger electron spectroscopy and scanning Auger microscopy to study the role of IMPs in pitting corrosion. Looking at corrosion products (rich in aluminium and oxygen), they also demonstrated the corrosion initiation at the boundary between IMPs and matrix which was
similar to our results (Fig. 5, 6, 7). Then, they also evidenced the corrosion propagation into the IMPs with a progressive accumulation of corrosion products over IMPs. Our results, most particularly pitting corrosion adjacent to the IMPs and increase of oxygen signal (corresponding to the corrosion products) at the IMP periphery (Fig. 7b and S4), indicate the enhanced reactivity at the interface between IMP and Al matrix [38-30, 48].
Some important findings on the distribution of alloying elements can be highlighted. After corrosion, the ToF-SIMS images allowed us to conclude that the Cu Liment can be observed in some pits corresponding to Al-Cu-Fe-Mn IMPs (Fig. 3) and also in pits formed close to the IMP (Fig. 6 and 7). An enrichment of more noble elements like Cu over the pitting area was already observed in the literature due to the preferential dissolution of more active elements like Al [49,50]. It should be noted that the surface enrichment in noble elements (such as Cu) is not enough to shift the OCP to higher values [51].
Even more interesting is the distribution of Li. According to ToF-SIMS ion depth profiles (Fig. 2), the shape of Li profile showing a maximum intensity in the oxide and interface region indicates a Li enrichment inside the oxide layer on pristine AA2050-T8 surface. After corrosion, the Li profile shows more flattened shape over the oxide, interface and substrate regions indicating a preferential dissolution of Li as already observed before [11,12] and the modification of the oxide layer composition. The similar intensity of the Li signal in the substrate region for the corroded sample as for the pristine sample indicates no changes of Li distribution in the alloy substrate. ToF-SIMS images performed at the oxide/metal substrate interface (Fig. 6) confirmed that Li is well present in the alloy substrate. In contrast with previous studies [11, 12], our results show that in the experimental conditions applied here (immersion at OCP in 0.1M Na Cl) there is no formation of stabilizing Li-containing layer, which could inhibit the corrosion of AA2050 as discussed by Gui and Devine [52] or Gharbi
et al. [32]. The fact that Li is still present in the alloy matrix (including T1 phases) is
important for the mechanical properties of the alloy but also for the corrosion behavior of the alloy. The presence of Li can have an influence on the pit formation in the matrix. It was demonstrated previously that in the alloys containing Li the pits are more superficial due to
formation of locally more alkaline pH neutralizing the acid pitting areas and stopping the dissolution of Al matrix [4, 27–29].
5. Conclusions
In this study, ToF-SIMS ion depth profiles and chemical mapping were used to characterize the surface modifications of AA2050-T8 Al-Cu-Li alloy induced by pitting corrosion. A well-defined area including Al-Fe-Cu-Mn constituent IMP was characterized before and after corrosion in order to understand the influence of IMPs on the corrosion initiation and surface modifications of Al-Cu-Li alloy. The main findings are the following:
ToF-SIMS negative ion depth profiles show that the native oxide formed on the pristine AA2050-T8 surface is enriched in Li, but it undergoes dissolution once the sample is immersed in NaCl electrolyte. However, ToF-SIMS chemical mapping shows the presence of metallic Li in the matrix (including T1 phase), Corrosion pits observed in the alloy show enrichment in chlorides and
hydroxides, corroborating also with the presence of the trace of Cu and Fe as demonstrated by ToF-SIMS chemical mapping,
A thorough SEM and ToF-SIMS analysis of the alloy with a well-defined area of Al-Fe-Cu-Mn IMP showed that the vicinity of the IMP was a preferential site of pitting corrosion initiation due to the galvanic coupling between the more anodic character of the matrix and the more cathodic character of IMP,
A different oxide-hydroxide layer composition and/or thicker layer over Al-Fe-Cu-Mn constituent IMP formed due to the cathodic reactions and enhanced anodic dissolution of surrounding Al matrix leading to formation of deposit layer rich in O and OH on the surface of IMP.
6. Acknowledgments
Mrs. F. Pillier from UPMC, P aris is acknowledged for SEM measurements.
Figure Captions
Figure 1: Optical microscopy of AA2050-T8 polished surface (a) before immersion (b) after 45 min immersion in 0.1M NaCl.
Figure 2: ToF-SIMS negative ion depth profiles for AA2050-T8 polished (a) pristine sample before immersion and (b) sample after 45 min immersion in 0.1M NaCl, c) Liobtained for AA 2050-T8 polished pristine sample before immersion (black curve) and after 45 min immersion in 0.1M NaCl (red curve). The oxide, interface and the substrate regions are delimited by the hatched wide areas corresponding to dashed lines shown in figures a) and c). The hashed areas cover a discrepancy in the time of sputtering of oxide, substrate and their interface for polished and corroded samples.
Figure 3: ToF-SIMS chemical mapping (100 µm× 100 µm) for AA2050-T8 after immersion in 0.1M NaCl for 45 min (a) in the oxide (sputtered to 65 s) and (b) at the metal / oxide interface (sputtered to 150 s).
Figure 4: Overlay of AlO2- (red) and Cl- (green) signals obtained from ToF-SIMS chemical images (100 µm × 100 µm) for AA2050-T8 after immersion in 0.1M NaCl for 45 min (a) in the oxide (sputtered to 65 s) and (b) at the metal / oxide interface (sputtered to 150 s). Figure 5: Scanning electron microscopy performed on the AA 2050-T8 sample in the region of interes comprising Al-Fe-Cu-Mn IMP (a) before and (b) after immersion in 0.1M NaCl for 45 min.
Figure 6: Positive (Li+, Fe+, Cu+ and Mn+ ToF-SIMS chemical mapping (100 µm× 100 µm) of AA2050-T8 sample in the region of interest comprising a selected Al-Fe-Cu-Mn IMP (a) before corrosion at the metallic substrate, (b) after immersion in 0.1M NaCl for 45 min performed at the metal / oxide interface (sputtered to 150 s).
Figure 7: ToF-SIMS image chemical mapping (100 µm× 100 µm) of AA2050-T8 in the region of interest comprising a selected Al-Fe-Cu-Mn IMP after immersion in 0.1M NaCl for 45 min (a) in the oxide (sputtered to 65 s) and (b) at the metal / oxide interface (sputtered to 150 s).
Figures
Figure 1
Figure 1: Optical microscopy of AA2050-T8 polished surface (a) before immersion (b) after 45 min immersion in 0.1M NaCl.
Figure 2: ToF-SIMS negative ion depth profiles for AA2050-T8 polished (a) pristine sample before immersion and (b) sample after 45 min immersion in 0.1M NaCl, c) Liobtained for AA 2050-T8 polished pristine sample before immersion (black curve) and after 45 min immersion in 0.1M NaCl (red curve). The oxide, interface and the substrate regions are delimited by the hatched wide areas corresponding to dashed lines shown in figures a) and c). The dashed areas cover a discrepancy in the time of sputtering of oxide, substrate and their interface for polished and corroded samples.
Figure 3
Figure 3: ToF-SIMS chemical mapping (100 µm× 100 µm) for AA2050-T8 after immersion in 0.1M NaCl for 45 min (a) in the oxide (sputtered to 65 s) and (b) at the metal / oxide interface (sputtered to 150 s).
Figure 4
Figure 4: Overlay of AlO2- (red) and Cl- (green) signals obtained from ToF-SIMS chemical images (100 µm × 100 µm) for AA2050-T8 after immersion in 0.1M NaCl for 45 min (a) in the oxide (sputtered to 65 s) and (b) at the metal / oxide interface (sputtered to 150 s).
Figure 5
Figure 5: Scanning electron microscopy performed on the AA 2050-T8 sample in the region of interest comprising Al-Fe-Cu-Mn IMP (a) before and (b) after immersion in 0.1M NaCl for 45 min.
Figure 6
Figure 6: Positive (Li+, Fe+, Cu+ and Mn+ ToF-SIMS chemical mapping (100 µm× 100 µm) of AA2050-T8 sample in the region of interest comprising a selected Al-Fe-Cu-Mn IMP (a) before corrosion at the metallic substrate, (b) after immersion in 0.1M NaCl for 45 min performed at the metal / oxide interface (sputtered to 150 s).
Figure 7
Figure 7: ToF-SIMS image chemical mapping (100 µm× 100 µm) of AA2050-T8 in the region of interest comprising a selected Al-Fe-Cu-Mn IMP after immersion in 0.1M NaCl for 45 min (a) in the oxide (sputtered to 65 s) and (b) at the metal / oxide interface (sputtered to 150 s).
References
[1] R. J. Rioja, J. Liu, The evolution of Al-Li base products for aerospace and space applications, Metal Mater. Trans. A. 43 (9) (2012) 3325–3337.
[2] P. Lequeu, K. Smith, A. Daniélou, Aluminum-copper-lithium alloy 2050 developed for medium to thick plate, J. Mater. Eng. Perform. 19 (6) (2010) 841–847.
[3] E. Starke, T. Sanders, I. Palmer, New approaches to alloy development in the al-li system, J. Metals. 33 (8) (1981) 24–33.
[4] T. Dursun, C. Soutis, Recent developments in advanced aircraft aluminium alloys, Mater. Des. (1980-2015) 56 (2014) 862–871.
[5] R. Gupta, N. Nayan, G. Nagasireesha, S. Sharma, Development and characterization of Al–Li alloys, Mater. Sci. Eng. A 420 (1-2) (2006) 228–234.
[6] R. Wanhill, Aerospace applications of aluminum–lithium alloys, Aluminum-lithium Alloys, Elsevier (2014) 503–535. [7] T. Warner, Recently-developed aluminium solutions for aerospace applications, Mater. Sci. Forum. 519-521 (2006)
1271–1278.
[8] A. K. Vasudevan and R.D. Doherty:Aluminum Alloys—Contemporary Research and Applications, Academic Press, Boston, MA (1989) 35–599.
[9] A. Smith, Aluminium–lithium alloys in helicopter airframes, Series in Materials Science and Engineering, (2001) 38. [10] A. Daniélou, J. Ronxin, C. Nardin, J. EhrstrÖm, Fatigue resistance of Al-Cu-Li and comparison with 7xxx aerospace
alloys, ICAA13, Pittsburgh, Springer (2012) 511–516.
[11] J. F. Li., Z. Q. Zheng., W. D. Ren, W. J. Chen, X. S. Zhao and S. C. Li, Simulation on function mechanism of T1 (Al2CuLi)
precipitate in localized corrosion of Al-Cu-Li alloys. Nonferr. Metal. Soc. (2006) 16 (6) 1268-1273.
[12] R. G Buchheit, J. P. Moran, and G. E. Stoner. Electrochemical behavior of the T1 (Al2CuLi) intermetallic compound
and its role in localized corrosion of Al-2% Li-3% Cu alloys. Corr. 50.2 (1994) 120-130.
[13] M. Guérin, J. Alexis, E. Andrieu, L. Laffont, W. Lefebvre, G. Odemer, C. Blanc, Identification of the metallurgical parameters explaining the corrosion susceptibility in a 2050 aluminium alloy, Corr. Sci. 102 (2016) 291–300. [14] R. Buchheit, L. Montes, M. Martinez, J. Michael, P. Hlava, The electrochemical characteristics of bulk-synthesized
Al2CuMg, J. Electrochem. Soc. 146 (12) (1999) 4424–4428.
[15] Y. Ma, X. Zhou, Y. Liao, Y. Yi, H. Wu, Z. Wang, W. Huang, Localised corrosion in AA2099-t83 aluminium-lithium alloy: the role of grain orientation, Corr. Sci. 107 (2016) 41–48.
[16] J. V. de Sousa Araujo, U. Donatus, F. M. Queiroz, M. Terada, M. X. Milagre, M. C. de Alencar, I. Costa, On the severe localized corrosion susceptibility of the AA2198-T851 alloy, Corr. Sci. 133 (2018) 132–140.
[17] R. Buchheit Jr, J. Moran, G. Stoner. Localized corrosion behavior of alloy 2090—the role of microstructural heterogeneity, Corr. 46(8) (1990) 610-617.
[18] V. Proton, J. Alexis, E. Andrieu, J. Delfosse, A. Deschamps, F. De Geuser, M.C. Lafont, C. Blanc, The influence of artificial ageing on the corrosion behaviour of a 2050 aluminium–copper–lithium alloy, Corr. Sci. 80 (2014) 494–502. [19] V. Proton, J. Alexis, E. Andrieu, C. Blanc, J. Delfosse, L. Lacroix, G. Odemer, Influence of postwelding heat treatment on the corrosion behavior of a 2050-T3 aluminum-copper-lithium alloy friction stir welding joint, J. Electrochem. Soc. 158 (5) (2011) C139–C147.
[20] E. Romhanji, M. Popovic, Problems and prospect of al-mg alloys application in marine constructions, J. Metallurgy 12 (4) (2006) 297–307.
[21] N. Birbilis, M. Cavanaugh, R. Buchheit, Electrochemical behavior and localized corrosion associated with Al7Cu2Fe
particles in aluminum alloy 7075-T651, Corr. Sci. 48 (12) (2006) 4202–4215.
[22] A. Boag, A. Hughes, A. Glenn, T. Muster, D. McCulloch, Corrosion of AA2024-T3 part i: Localised corrosion of isolated IM particles, Corr. Sci. 53 (1) (2011) 17–26.
[23] X. Zhou, C. Luo, T. Hashimoto, A. Hughes, G. Thompson, Study of localized corrosion in AA2024 aluminium alloy using electron tomography, Corr. Sci. 58 (2012) 299–306.
[24] A. Glenn, T. Muster, C. Luo, X. Zhou, G. Thompson, A. Boag, A. Hughes, Corrosion of AA2024-T3 part iii: propagation, Corr. Sci. 53 (1) (2011) 40–50.
[25] C. M. MacRae, A. E. Hughes, J. S. Laird, A. Glenn, N. C. Wilson, A. Torpy, M. A. Gibson, X. Zhou, N. Birbilis, G. E. Thompson, An examination of the composition and microstructure of coarse intermetallic particles in AA2099-T8, including Li detection, Microsc. Microanal. 24 (4) (2018) 325–341.
[26] Y. Ma, X. Zhou, W. Huang, G. Thompson, X. Zhang, C. Luo, Z. Sun, Localized corrosion in AA2099-T83 aluminum– lithium alloy: The role of intermetallic particles, Mater. Chem. Phys. 161 (2015) 201–210.
[27] J. Moreto, C. Marino, W. Bose Filho, L. Rocha, J. Fernandes, SVET, SKP and EIS study of the corrosion behaviour of high strength Al and Al–Li alloys used in aircraft fabrication, Corr. Sci. 84 (2014) 30–41.
[28] E. Ghanbari, A. Saatchi, X. Lei, D. D. Macdonald, Studies on pitting corrosion of Al-Cu-Li alloys part ii: Breakdown potential and pit initiation, Materials, 12 (11) (2019) 1786.
[29] X. Lei, A. Saatchi, E. Ghanbari, R. Dang, W. Li, N. Wang, D. D. Macdonald, Studies on pitting corrosion of Al-Cu-Li alloys part i: Effect of Li addition by microstructural, electrochemical, in-situ, and pit depth analysis, Materials, 12 (10) (2019) 1600.
[30] J.L Huang, J.F. Li, D.Y. Liu, R.F. Zhang, Y.L. Chen, X.H. Zhang, P.C. Ma, R.K. Gupta and N. Birbilis, Correlation of intergranular corrosion behaviour with microstructure in Al-Cu-Li alloy, Corr. Sci. 139 (2018) 215-226.
[31] Y. Liu and Y. F. Cheng, Role of second phase particles in pitting corrosion of 3003 Al alloy in NaCl solution, Mater. Corr. 61.3 (2010) 211-217.
[32] O. Gharbi, N. Birbilis, K. Ogle, Li reactivity during the surface pretreatment of Al-Li alloy AA2050-T3, Electrochimica Acta 243 (2017) 207-219.
[33] M. Li, F. Wiame, A. Seyeux, P. Marcus, J. Światowska, Effect of thermal oxidation on surface chemistry and elemental segregation of Al-Cu-Li alloy, Applied Surface Science, 534 (2020) 147633.
[34] R. G. Buchheit, A compilation of corrosion potentials reported for intermetallic phases in aluminum alloys, J. Electrochem. Soc. 142, 11 (1995) 3994-3996.
[35] R. Buchheit, R. Boger, M. Carroll, R. Leard, C. Paglia, J. Searles, The electrochemistry of intermetallic particles and localized corrosion in al alloys, J Metal. 53 (7) (2001) 29–33.
[36] Y. Zhu, K. Sun, and G. S. Frankel, Intermetallic phases in aluminum alloys and their roles in localized corrosion, J. Electrochem. Soc. 165 (11) (2018) C807-C820.
[37] D.S. Kharitonov, C. Örnek P.M. Claesson, J. Sommertune, I.M. Zharskii, I. I. Kurilo and J. Pan, Corrosion inhibition of aluminum alloy AA6063-T5 by vanadates: microstructure characterization and corrosion analysis, J. Electrochem. Soc. 165(3) (2018) C116-C126.
[38] G. Ilevbare, O. Schneider, R. Kelly, J. Scully, In situ confocal laser scanning microscopy of AA 2024-T3 corrosion metrology I. localized corrosion of particles, J. Electrochem. Soc, 151 (8) (2004) B453–B464.
[39] M. Büchler, T. Watari, William H. Smyrl, Investigation of the initiation of localized corrosion on aluminum alloys by using fluorescence microscopy, Corr. Sci. 42 (9) (2000) 1661-1668.
[40] M. Büchler, J. Kerimo, F. Guillaume, and William H. Smyrl, Fluorescence and Near‐Field Scanning Optical Microscopy for Investigating Initiation of Localized Corrosion of Al 2024. J. Electrochem. Soc. 147.10 (2000) 3691-3699. [41] R. Grilli, M. A. Baker, J. E. Castle, B. Dunn, & J. F. Watts, Localized corrosion of a 2219 aluminium alloy exposed to a
3.5% NaCl solution. Corr. Sci. 52(9) (2010) 2855-2866.
[42] M. F. Ashby, D. R. H. Jones, Engineering materials 1: an introduction to properties, applications and design, Vol. 1, Elsevier, 2012.
[43] J. Park, C. Paik, Y. Huang, R. C. Alkire, Influence of Fe-rich intermetallic inclusions on pit initiation on aluminum alloys in aerated nacl, J. Electrochem. Soc. 146 (2) (1999) 517–523.
[44] R. Ambat, A. J. Davenport, G. M. Scamans, A. Afseth, Effect of iron-containing intermetallic particles on the corrosion behaviour of aluminium, Corr. Sci. 48 (11) (2006) 3455–3471.
[45] K. Nis, Electrochemical behavior of aluminum-base intermetallics containing iron, J. Electrochem. Soc. 137 (1) (1990) 69–77.
[46] Z. Szklarska-Smialowska, Pitting corrosion of aluminum, Corr. Sci. 41 (9) (1999) 1743–1767.
[47] J. O. Park, C. H. Paik. RC. Alkire, P. M. Natishan, R. G. Kelly, G. S. Frankel, R. C. Newman (Eds.), Critical Factors in Localized Corrosion II, J. Electrochem. Soc. Pennington, NJ, 1996, pp. 218-225.
[48] G. Chen, M. Gao, R. Wei, Microconstituent-induced pitting corrosion in aluminum alloy 2024-T3, Corrosion 52 (1) (1996) 8–15.
[49] R. G. Buchheit, R. K. Boger, Cu redistribution and surface enrichment due to dissolution of Al-Cu alloys, CORROSION/2001 Research Topical Symposium—Localized Corrosion, (2001) 265-292.
[50] N. Dimitroy, J. A. Mann and Karl Sieradzki. Copper redistribution during corrosion of aluminum alloys, J. Electrochem. Soc. 146.1 (1999) 98-102.
[51] J. Li, C. Li, Z. Peng, W. Chen, Z. Zheng, Corrosion mechanism associated with T1 and T2 precipitates of Al–Cu–Li alloys in NaCl solution, J. Alloys Compd. 460 (1-2) (2008) 688–693.