HAL Id: in2p3-00025071
http://hal.in2p3.fr/in2p3-00025071
Preprint submitted on 17 Nov 2005HAL is a multi-disciplinary open access archive for the deposit and dissemination of sci-entific research documents, whether they are pub-lished or not. The documents may come from teaching and research institutions in France or abroad, or from public or private research centers.
L’archive ouverte pluridisciplinaire HAL, est destinée au dépôt et à la diffusion de documents scientifiques de niveau recherche, publiés ou non, émanant des établissements d’enseignement et de recherche français ou étrangers, des laboratoires publics ou privés.
Radio background measurements at the Pierre Auger
Observatory
J. Lamblin, O. Ravel, C. Medina
To cite this version:
J. Lamblin, O. Ravel, C. Medina. Radio background measurements at the Pierre Auger Observatory. 2005. �in2p3-00025071�
Radio background measurements at the Pierre Auger Observatory
J. Lamblin , O. Ravel for the CODALEMA collaboration
SUBATECH Laboratory, 4 rue Alfred Kastler, 44307 Nantes
C. Medina
Tandar Laboratory -CAC-CNEA, av. Gral Paz 1499, San Martin, Buenos Aires, Argentina
I) Introduction
The CODALEMA experiment recently demonstrated the possibility to detect radio signals associated with high energy cosmic rays air showers and use them to determine the primary arrival direction [1]. To get a better knowledge of these radio signals and their dependences on other primary characteristics, at higher energies, a possible forthcoming stage would be to associate antennas to larger ground detector arrays as the Pierre Auger Observatory, in Argentina. However, before carrying out such a project, two points must be checked. The first one is the radio background at Malargue in the frequency band of interest for radiodetection. The procedure for doing so consists in identifying the main transmitters in the 0-100 MHz frequency band. The second one is the electromagnetic noise in the tank vicinity in order to know if electronics can induce radio signals strong enough to trigger antennas and then generate background.
We report in this note the set up and the results of such measurements performed at Malargue site at different location between the 10th and the 15th of January 2005. We will compare
the results with those obtained at Nancay (France), the site of the CODALEMA experiment [2]. II) Measurement setup and data analysis procedure.
To carry out measurements, we used an active antenna ADOC1001 (short dipole) commercialized by Thales. This antenna has a constant gain on a large bandwidth (from 10 KHz to 1 GHz). More characteristics are given in annex.
Figure 1 shows the experimental setup. The short dipole powered by a battery was linked to the acquisition system by 300 m of optical fiber. The optical receiver converted the optical signal into electrical signal. The signal was then digitalized by an 8 bits ADC at 2 GigaSamples/s (Lecroy oscilloscope). We had the possibility to filter the electric signal before its digitalization with a 33-65 MHz pass band filter, same as the ones used by the CODALEMA experiment [2]. The data acquisition was controlled with a LabView program on a laptop via a GPIB bus.
Dipole optical fiber Oscilloscope Lecroy 9384 ADC 8 bits 2 GS/s GPIB Optical receiver PC DAQ LabView filter Power Supply 220 V 50 Hz Portable generator 300 m max
The acquisition system was able to record randomly the radio signal collected by the dipole over one duration Tr, adjustable from 10 to 100 microseconds. This time fixes the minimum frequency that can be reach using Fast Fourier Transform (Fmin= 1/Tr) whereas the maximum
usable frequency is given by Fs/2 (FS is the sampling frequency). A typical snapshot is shown in
Figure 2.
Figure 2: Example of recorded signal as a function of time recorded over 10 µs with 2 GHz sampling frequency.
It is important to note that, for all the measurements, the weather was excellent. There was no storm in the area, which would have disturbed the results.
An offline analysis using Matlab® permitted to obtain the Power Spectral Density (PSD)
spectrum of the measured signals. In order to clean it from power fluctuations, PSD spectra presented in this document are mean values of several hundred spectrums computed on temporal records taken randomly during few minutes. For the calculation, we used the PSD Matlab function [3]. This function gives an amplitude, APSD, in V2, which is then converted in dBm/Hz
as following :
∑
⎟⎟ + ⎠ ⎞ ⎜⎜ ⎝ ⎛ = evt N S PSD 10 evt 30 F R A 10 Log N1 Hz dBm A . ) / (where R is the load impedance of the oscilloscope (50 Ω).
The lower measurable amplitude is given by the Low Significant Bit value (LSB) of the oscilloscope ADC :
(
)
30 F R 256 V 10 Log Hz dBm LSB S 2 MAX 10 ⎟⎟ + ⎠ ⎞ ⎜ ⎜ ⎝ ⎛ = . ) / (where VMAX is the maximum voltage for a given sensitivity.
III) Radio Spectrum at central campus
The first measurements were done at Auger central campus in order to have a first general idea of the Malargue sky. The apparatuses were supplied by the general power supply. The spectrum of the sky over the entire frequency band accessible by our detection system, between Fmin=100 KHz (Tr=10 µs) and 1 GHz (dipole frequency limit), is shown on Figure 3, whereas
Figure 4 presents a zoom at low frequencies. This spectrum has been obtained with the following parameters :
Fs (GHz) Tr(µs) Samples/evt Sensitivity VMAX LSB Nevt
First of all, the spectrum at the campus appears quiet and poor in radio transmitters in comparison with the one obtained in a large urban area, like Nantes in France (cf. Figure 15 in annex). At Malargue, transmitters are present in the low frequency region up to the FM band (only few FM transmitters). Above the FM band, there are transmitters up to 500 MHz (transmitters around 200 MHz corresponds to TV). It is interesting to note the peak at 470 MHz corresponding to the CB communication of the Auger experiment. Finally, the band 860-900 MHz corresponds to the Malargue cellular phone transmitters.
As going to be explained in section VI-1, the Malargue spectrum floor corresponds to the sky radio background (at Nantes, the spectrum floor is higher because the voltage sensitivity was changed and the LSB was in this case equal to -124 dBm/Hz).
Figure 3: Radio spectrum measured at the central campus of Pierre Auger Observatory (LSB = -136 dBm/Hz).
IV) Radio Spectrum at El Chacay
As the objective would be to associate antennas with the particle detectors, we performed the next measurements in the Pampa. We choose the area of El Chacay inside the triangle formed by “Ayelen”, “Carina” and “Rosa Candida” tanks. As the most part of signals detected at the central campus comes from the Malargue city, we can expect a quieter spectrum in the Pampa. We used a portable electric generator to power the optical receiver and the oscilloscope. Thanks to the optical fiber, the active dipole could be far enough not to be disturbed by the electromagnetic noises from the generator.
1) Full spectrum 100 KHz - 1 GHz
First, the entire spectrum is presented on Figure 5. The spectrum floor (around -130 dBm/Hz) corresponds to the sky radio noise. Transmitters are present in the low frequency region (up to 20 MHz) then one finds a very quiet band up to the FM band (only few FM transmitters). Above the FM band, there are transmitters around 200 MHz and one at 500 MHz (probably TV). Finally, the band 860-900 MHz corresponds to cellular phone.
As expected, it is much more quiet than at the central campus (Figure 3). FM peak amplitudes are lower of a factor around 1000 (–30 dBm/Hz). Other peaks are also lower, particularly the cellular phone peaks which are almost not visible. The comparison with the spectrum measured at Nancay (see Figure 16 in Annex), which has a very quiet environment, shows the particularly low number of transmitters in the pampa.
Figure 5: Radio spectrum measured at El Chacay (LSB = - 136 dBm/Hz).
2) Radio spectrum between 100 KHz-100 MHz
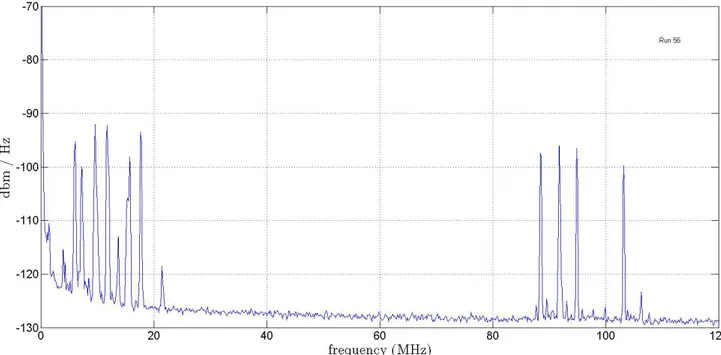
Figure 6 shows a zoom of the spectrum between 100 KHz and 100 MHz, which is the interesting frequency band for cosmic ray radiodetection.
The radio spectrum is very quiet, we only identify 4 transmitters with amplitude around -115 dBm/Hz in the band 10-20 MHz (see Table 1). For comparison, they are two times more transmitters at Nancay in the same frequency band with power amplitudes approximately 100 times stronger (see Figure 7). We could make the same kind of remarks for the FM band. There are only 4 transmitters with amplitude not bigger than -110 dBm/Hz.
Finally, it is interesting to note that the four transmitters in the band 10-20 MHz were not visible at the central campus and the transmitter at 800 KHz was weaker. They may not come from the city of Malargue but this effect could be also explained by fluctuant transmitters.
f (MHz) 0,80 9,64 11,80 15,38 17,80 88,1 94,1 97,5 98,5 A (dBm/Hz) -78 -113 -122,5 -116,5 - 123,5 -110 -121,6 -121 -124,3
Table 1: Main transmitters between 100 KHz and 100 MHz at El Chacay (in the pampa).
Figure 6: Radio spectrum between 100 KHz and 120 MHz near El Chacay in the Pampa (LSB = -136 dBm/Hz)
V) Radio spectrum at Los Leones fluorescence building
The last measurements were carried out at Los Leones, just close to the fluorescence building, during daytime. The measured spectrum (cf. Figure 8 and Figure 9) presents more powerful peaks than in the Pampa. There are two reasons for this.
First, the site is in altitude, it is therefore more sensitive to radio transmitters. It is the case for the FM band, for the transmitters around 200 MHz and for cellular phones at 860-900 MHz. The 470 MHz peak, corresponding to the Auger CB, is also much higher.
Secondly, due to fluorescence buildings, there are many electronic apparatuses to which should be added radio communications, particularly, wireless LAN radio operating in the 902-928 MHz ISM radio band [4]. In order to check the measurement quality, Figure 10 shows the detail of this frequency band. With our device, we measured the 51 channels spaced by 500 kHz with an amplitude around -110 dBm/Hz, corresponding to data sent by Surface Detectors.
We do not know exactly the origin of the small peaks regularly spaced (∆f = 10 MHz) over the entire spectrum. They could come from the Los Leones building power supply, we should perform additional measurements to check this point.
Figure 8 : Radio spectra measured at Los Leones Fluorescence Building (LSB = -136 dBm/Hz).
Figure 10 : Zoom on the WLAN surface detectors (51 channels every 500 KHz between 902 and 928 MHz).
However, even if the spectrum is noisier than in the pampa, it is still quieter than the one measured at Nancay. Thus, the sky is still compatible with the level required by radiodetection.
VI) Transient studies 1) Experimental set up
In the perspective to associate antennas with particle detectors, we carried out measurements to know the transient electromagnetic signals produced by the electronics of an operating tank. As the radio signal induced by an extensive air shower has components (in the space of Fourier) in the range from 1 MHz to 100 MHz, we restricted our measurement to a part of this bandwidth using a pass-band filter 33-65 MHz (as in the CODALEMA experiment [2]).
Figure 11 shows the filter effect on the frequency spectrum. For this measurement, the LSB was -164 dBm/Hz. Therefore, the floor around -147 dBm/Hz represents the electronic noise of the equipment and the level of -130 dBm/Hz in the filter frequency band corresponds to the sky radio background.
We performed transient detection at various distances from a tank for horizontal and vertical polarization of the dipole. Concerning the horizontal polarization, there was no significant differences between N-S and E-W measurements.
The first run was performed at the furthest point from the three tanks (point A on the Figure 12) which should be a priori the less noisy point. The second one was realized at the most unfavorable position, just close to the Ayeleen tank (point C), and the last one was located at around 50 m from the tank (point B).
Ayeleen A 1.5 km ~800 m 50 m B Rosa Canada C Carina
Figure 12: Three locations of transients measurements.
2) Point A
We observed two very different behaviors:
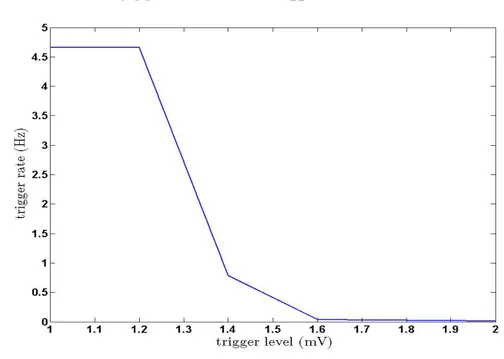
• Quiet periods, concerning the most part of time, while we could measure the trigger rate variation as a function of the trigger level for horizontal polarization (see Figure 13). The value of 4.7 Hz obtained for amplitudes lower than 1.2 mV corresponds to the limit of our acquisition system. Above 1.2 mV, the counting rate drops strongly and reaches a value of 0.015 Hz at 2 mV. To compare, the threshold used by the CODALEMA experiment at Nançay [2] to have a similar trigger rate is around 2 mV.
• High activity periods of few minutes while pulses with amplitude around 3 mV were detected at a trigger rate around 3.5 Hz (see an example on Figure 14). We do not know the origin of these events. They could come from the Auger data transmission. However, above 4 mV, these events do not trigger anymore. It would be also interesting to test if using coincidences between several antennas, we could reject this kind of events.
Figure 14 : Transient measured in the Pampa.
3) Measurement at the point C
For horizontal polarization, we noticed the same phenomenon close to the Ayeleen tank, a succession of quiet periods and high activity periods, with similar trigger rates than at point A. So, tanks will not perturb the detection of horizontal polarized electric field.
Nevertheless, in vertical polarization, with a trigger threshold lower than 2.4 mV, we detected exactly one event per second. We deduced that the active dipole was triggering on the GPS signal (Pulse per Second or PPS). Pulses were probably induced by the amplifier of the tank GPS antenna.
4) Measurement at the point B
For horizontal polarization, we got counting rates with the same order of magnitude as at points A and C whereas in vertical polarization, we did not detect anymore signals induced by the UB (signal 1 PPS) even with low threshold. Therefore, further a few ten meters, tanks do not perturb radiodetection anymore in both polarizations.
VII) Conclusion
Measurements of the radio background show that the Malargue site is a very quiet and calm zone. The weak presence of transmitters, mainly at low frequencies, confirms the idea that this area is a very good place to implement the radiodetection of cosmic ray air showers at high energy. The radio environment is even better than the one at Nancay site.
In every case, we showed that low transient counting rates for self triggered antennas could be reached keeping low trigger levels. The only identified effect due to the surface detectors is the influence of 1 PPS pulses generated by the electronics. However, this effect only affects the vertical polarization of the dipole when the antenna is close to the tank.
These results allow us to consider a next step which could be to install several antennas inside the surface detector array to perform high energy cosmic ray radiodetection, even if practical aspects need to be studied in details. The ideal place to perform this test would be as further as possible from the Malargue city but radiodetection could be also implemented nearer (for example at El Chacay, the site we have tested), logistics should be more simple.
To conclude, we would like to point out that the same measurements, which have been reported here, should be done for the Auger North Site, looking forward finding the same quiet sky as at the Auger South Site or Nancay Site.
We would like to thank the Auger Collaboration for allowing us to perform these measurements. We are also very grateful to I. Allekotte, P. Clark and all the staff at Malargue, in particular RosaPacheco, Ricardo Perez, Pedro Barraza and Lucas Munoz,, who helped us for all practical aspects.
References :
[1] D. Ardouin et al., Evidence for Radio Detection of Extensive Air Showers Induced by Ultra High
Energy Cosmic Rays, astro-ph/0504240, submitted to P.R.L., 2005.
[2] D. Ardouin et al., CODALEMA, a Proof-of-Principle Experiment for Radio Detection of Ultra High Energy Cosmic Rays, astro-ph/0504297, submitted to NIM A, 2005.
[3] T. Krauss, 3-26-93 Copyright 1988-2004 The MathWorks, Inc. Revision: 1.12.4.2
[4] P.D.J. Clark & D. Nitz, Communications in the Auger Observatory, Proceeding of ICRC 2001, GAP 2001-032, 2001.
Annexes
Figure 15 : Radio spectrum measured at Nantes (France) (LSB = -124 dBm/Hz).
Figure 16 : Radio spectrum measured at Nancay (France) (LSB = -136 dBm/Hz).
MELOPEE – ADOC 1001
Active Dipole Optically Coupled for EMC tests
Applications
• EMC measurement (radiated emission and immunity levels) • Emission spectrum caracterisation and control
• Complex antennas diagram measurement • Field cartography and uniformity measurements • Radiated interferences analysis
• Shielding effectiveness measurements Main characteristics (typical data)
The ADOC 1001 compared to classical antennas
January 2002
Classical antennas ADOC 1001
Dimensions Large (>> λ/2) Small (≈λ/2 at 1 GHz)
Transmission Coaxial cable Optic fiber link
Losses HF losses in cable AGC on optical signal
Field distortion Yes: metallic cables No: dielectric medium
Spurious signal Yes: ground loops No: optical isolation
Complexity 2 or 3 antennas One sensor only
Antenna factor Variable Nearly constant
Sensitivity Limited by reveiver 20 dBµV/m noise floor
Instantaneous dynamic Limited by reveiver 80 dB
Operating Time n.a. (passive) > 10 hours
Test installation Tedious and time-consuming Simple and fast
Maintenance High cost (2 or 3 antennas) Low cost (only one small sensor)
Bandwidth 10 kHz - 1 GHz
Flatness within bandwidth ± 3 dB 1 dB compression point 350 mV/mRMS
Sensitivity within 100 KHz 20 dBµV/mRMS
Antenna factor AF = 3 dB (m-1)
Instantaneous dynamic > 140 dB within 1 Hz
Optical cable 25 meters (standard)
Output of receiver 50 ohms, 200 mVPEAK
Operating time > 10 hours
Power supply 4 x AA batteries (LR6)