HAL Id: hal-00998842
https://hal.archives-ouvertes.fr/hal-00998842
Submitted on 3 Jun 2014
HAL is a multi-disciplinary open access
archive for the deposit and dissemination of
sci-entific research documents, whether they are
pub-lished or not. The documents may come from
teaching and research institutions in France or
abroad, or from public or private research centers.
L’archive ouverte pluridisciplinaire HAL, est
destinée au dépôt et à la diffusion de documents
scientifiques de niveau recherche, publiés ou non,
émanant des établissements d’enseignement et de
recherche français ou étrangers, des laboratoires
publics ou privés.
Measurement of Individual Changes in the Performance
of Human Stereoscopic Vision for Disparities at the
Limits of the Zone of Comfortable Viewing
Jan Paulus, Georg Michelson, Marcus Barkowsky, Joachim Hornegger, Bjorn
Eskofier, Michael Schmidt
To cite this version:
Jan Paulus, Georg Michelson, Marcus Barkowsky, Joachim Hornegger, Bjorn Eskofier, et al..
Mea-surement of Individual Changes in the Performance of Human Stereoscopic Vision for Disparities at
the Limits of the Zone of Comfortable Viewing. 2013 International Conference on 3D Vision, Jun
2013, seattle, United States. pp.310–317, �10.1109/3DV.2013.48�. �hal-00998842�
Measurement of Individual Changes in the Performance of Human Stereoscopic
Vision for Disparities at the Limits of the Zone of Comfortable Viewing
Jan Paulus
Pattern Recognition Lab
Institute of Photonic Technologies
Erlangen Graduate School in Advanced Optical Technologies (SAOT)
University of Erlangen-Nuremberg, Germany
jan.paulus@cs.fau.de
Georg Michelson
Department of Ophthalmology
Erlangen Graduate School in Advanced Optical Technologies (SAOT)
University of Erlangen-Nuremberg, Germany
georg.michelson@uk-erlangen.de
Marcus Barkowsky
Image and video-communication (IVC) research group
LUNAM Universit´e, Universit´e de Nantes
IRCCyN UMR CNRS 6597, Polytech Nantes, France
marcus.barkowsky@univ-nantes.fr
Joachim Hornegger, Bj¨orn Eskofier
Pattern Recognition Lab
Erlangen Graduate School in Advanced Optical Technologies (SAOT)
University of Erlangen-Nuremberg, Germany
joachim.hornegger@cs.fau.de, bjoern.eskofier@cs.fau.de
Michael Schmidt
Institute of Photonic Technologies
Erlangen Graduate School in Advanced Optical Technologies (SAOT)
University of Erlangen-Nuremberg
michael.schmidt@lpt.uni-erlangen.de
Abstract
3D displays enable immersive visual impressions but the impact on the human perception still is not fully understood. Viewing conditions like the convergence-accommodation (C-A) conflict have an unnatural influence on the visual sys-tem and might even lead to visual discomfort. As visual perception is individual we assumed the impact of simu-lated 3D content on the visual system to be as well. In this study we aimed to analyze the stereoscopic visual perfor-mance of 17 subjects for disparities inside and outside the
in literature defined zone of comfortable viewing to provide an individual evaluation of the impact of increased dispar-ities on the performance of the visual system. Stereoscopic stimuli were presented in a four-alternative forced choice (4AFC) setup in different disparities. The response times as well as the correct decision rates indicated the performance of stereoscopic vision. The results showed that increased disparities lead to a decline in performance. Further, the impact of the presented disparities is dependent on the diffi-culty of the task. The decline of performance as well as the deciding disparities for the decline were subject dependent.
1. Introduction
3D displays enable immersive 3D impressions by pro-viding images for each eye separately. Depth is encoded by disparity, the offset between the projections of the same real world 3D point acquired by both eyes [6].
But still the impact of simulated depth on the human per-ception which can even lead to visual discomfort is not com-pletely understood. Several impacts have been discovered as potential disturbances [9]. One of the main problems is the convergence-accommodation (C-A) conflict [5]. Con-vergence describes the eyes’ alignment mechanism to map points onto corresponding areas in both retinas. Accom-modation describes the lenses’ mechanism to re-adjust their focus for a sharp image. Naturally the distance to a certain point connects those two mechanisms. For simulated 3D content the convergence mechanism is related to the dis-tance of the virtual object outside of the screen plane while the accommodation mechanism is related to the distance of the screen plane. This results in an unnatural offset influ-encing the human perception and potentially even in visual discomfort.
Approaches have been proposed based on the depth of focus and Panum’s area [16] providing a zone of comfort-able viewing where no visual discomfort is present. The depth of focus describes the distance change in which a re-accommodation of the lenses is not required but still a sharp image is obtained. Panum’s area is the small region around the surface containing points that are mapped on corresponding areas on both retinas due to convergence, but where still no double image is perceived. The idea is to select the maximum disparity and thus the depth in the simulated images related to the depth of focus and Panum’s area (≤ 1◦). More recent studies recommend an even lower maximum value of 0.2 diopters (D) [4]. Also, studies about definitely annoying conditions for 3DTV consumption have been made [10].
There have been published various methods to describe and analyze the impact of simulated 3D content on the hu-man perception and potential visual discomfort. Perfor-mance tasks [3] have been used as well as subjective ques-tionnaires [8] or measurements of Electroencephalograms (EEG) [14]. Recently, stereo acuity, the minimum perceiv-able disparity, before and after consuming 3D content was evaluated on an autostereoscopic display [2].
We assumed the impact of simulated 3D content on the visual system to be individual as visual perception is as well. The goal of this study was to analyze the individual performance of human stereoscopic vision and its change while being affected by increased disparities. Therefore, we evaluated performance tasks at disparities inside and
out-side of the zone of comfortable viewing. We assumed a de-crease of performance for excessively inde-creased disparities. Our focus was set on the in literature defined performance aspects of stereoscopic vision [7,12]:
1. Stereo acuity: A quantitative measurement describing the minimum perceivable disparity.
2. Speed: A qualitative measurement describing the time until the depth stimulus is detected.
3. Robustness: A qualitative measurement describing the repeatability of the performance results.
We measured estimates of the above listed items by pre-senting disparity stimuli at different base depth levels and measuring the response times as well as the correct deci-sion rates.
In this study we decided for a polarized 3D-TV as its eyewear is of less weight than eyewear of active shut-ter technologies and thus more comfortable. Further, larized technology is less dependent on the viewing po-sition than autostereoscopic displays without expensive head/pupil tracking [15]. Disadvantages like reduced verti-cal resolution were not of interest for our study as we were interested in the impact of horizontal disparities.
2. Methods
We provided a four-alternative forced choice (4AFC) setup. Our stimuli consisted of four disks equally rendered in front of a background on the screen plane presented in multiple iterations (Fig. 1). Three disks were rendered in each iteration with the same crossed disparity, further called base disparity, to appear on the same depth plane in front of the screen plane. One of the disks was randomly chosen in each iteration to have a higher crossed disparity and thus to appear closer to the subject. The difference between the crossed disparity of this front disk and the base disparities of the other disks will be further denoted as disparity dif-ference. The subject’s task was to identify this front disk in each iteration as fast as possible.
We presented three disparity differences (19 arcsecs, 57 arcsecs, 95 arcsecs) on three base disparities (19 arcsecs, 2280 arcsecs, 4294 arcsecs) in seconds of arc (arcsecs) (Fig. 2). The three disparity differences were classified as simple, medium and difficult performance task levels in decreasing order. The three base disparities were related to the zone of comfortable viewing known from literature [4]. 19 arcsecs equated to 0.002 D. It was classified as a reference value for natural viewing conditions. 2280 arcsecs equated to 0.180 D and was located inside the limits of the zone of comfort-able viewing. 4294 arcsecs equated to 0.340 D and was located outside of the zone of comfortable viewing (Fig.3).
Figure 1. Left: A subject performing our stereo vision performance task. Right: The presented stimuli and the used interface. Subjects are asked to identify the front disk by pressing the corresponding button in a four-alternative forced choice (4AFC) test.
Figure 2. Disparity is given as angle φ, the difference between the angle β enclosing the eyes and the screen and the angle α enclosing the eyes and the virtual object.
Figure 3. The setup of the presented base disparities of the disks indicated by dashed lines with a zone of comfortable viewing of 0.2 diopters (D) or 2475 seconds of arc (arcsecs).
We detected three possible issues for the monocular de-tection of the front disk for which we implemented the fol-lowing solutions:
1. Size: In perspective projection disks appearing nearer in 3D would appear larger in their projections. In or-der to eliminate this depth cue, all disks were renor-dered with the same radius of 180 pixels in their 2D projec-tions.
2. Disparity offset: The enlarged disparity would add an offset to the horizontal distances of the disks in one eye’s view. Therefore, we applied a random offset to the horizontal offset of each disk’s projections individ-ually. The random offset for one disk’s projections was the same resulting in a slight shift to the left or right side. The offset could be positive or negative and var-ied in the range of the largest presented disparity dif-ference.
3. Ghosting: Ghosting added a shimmering ring to each disk showing the amount of disparity monocularly. Therefore, we applied a background to the disks mask-ing the ghostmask-ing effect.
2.1. Correct decision rate
Each disparity difference was presented in 16 repetitions on each base disparity. A disparity difference was classi-fied as detected if at least 10 out of 16 repetitions in the 4AFC setup were correctly identified. This equated to a correct decision rate threshold of 0.625 and corresponded to the psychometric threshold (PT) [13]. It is calculated by
modelling a sigmoid function with a decision rate of 1.000 as upper bound and the guessing rate as lower bound. The threshold is assumed to be located at the steepest position. For a guessing rate of 0.250 this yields to:
P T = 1.000 − 0.250
2 + 0.250 = 0.625 (1) The probability Pgof guessing at least 10 out of 16 times
correctly is below a significance level of 0.01 and can be calculated as follows: Pg= 16 X i=10 B(i|16, 0.25) ≤ 0.01 (2)
where B(·|n, p) is the binomial distribution with n = 16 as total number of iterations and p = 0.25 as the probability for a correct guess.
The correct decision rate for each disparity difference was an estimate of stereo acuity and thus indicated a quan-titative performance measurement.
2.2. Response time
In each repetition we measured the response time start-ing with the image onset and stoppstart-ing with a button press by the subject. This resulted in 16 response times for each combination of disparity difference and base disparity. Each response time is an estimate of speed while each set of 16 response times gives information about the robustness.
2.3. Final test procedure
The basic test procedure for one repetition consisted of presenting a pair of base disparity and disparity difference. The subject had to select the front disk (forced decision) by pressing a corresponding button on an input device (Fig.1). We presented three disparity differences on three base disparities in 16 repetitions each (3 × 3 × 16 stimuli in to-tal). This results in a total number of 144 presentations. The order of the presented base disparities and disparity differ-ences was randomized. At the beginning of a test for each subject each base disparity and disparity difference com-bination was presented once without being measured and without being included in the 144 presentations.
3. Experiments and Results
3.1. Subjects and Setup
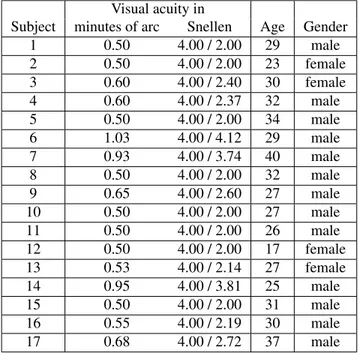
We measured 17 subjects including 13 males and four fe-males (Table1). Their visual acuities were measured with the “Freiburg Visual Acuity Test” [1]. The subjects’ ages ranged from 17 to 40 (29.2 ± 5.3). If subjects had support-ing eyewear (contact lenses, glasses, etc.) they were asked to wear them during all tests. The subjects were told to
Table 1. Table containing all measured subjects with visual acuities, ages, and genders. Visual acuities were measured with the “Freiburg Visual Acuity Test” [1]. Some visual acuities reach even 4.00/2.00 which is not unusual for young normal subjects according to Rassow et al. [11] who measured 5.00/2.50 as a me-dian value. The used visual acuity test is especially designed to also measure those ranges.
Visual acuity in
Subject minutes of arc Snellen Age Gender 1 0.50 4.00 / 2.00 29 male 2 0.50 4.00 / 2.00 23 female 3 0.60 4.00 / 2.40 30 female 4 0.60 4.00 / 2.37 32 male 5 0.50 4.00 / 2.00 34 male 6 1.03 4.00 / 4.12 29 male 7 0.93 4.00 / 3.74 40 male 8 0.50 4.00 / 2.00 32 male 9 0.65 4.00 / 2.60 27 male 10 0.50 4.00 / 2.00 27 male 11 0.50 4.00 / 2.00 26 male 12 0.50 4.00 / 2.00 17 female 13 0.53 4.00 / 2.14 27 female 14 0.95 4.00 / 3.81 25 male 15 0.50 4.00 / 2.00 31 male 16 0.55 4.00 / 2.19 30 male 17 0.68 4.00 / 2.72 37 male
evaluate a new strategy for stereo acuity tests. They were in-structed to wait for the exposure of the stimulus. After expo-sure they were told to press the corresponding button as fast as possible. Each subject had the possibility to pause the test by leaving one of the buttons pressed down. We used a circularly polarized 3D-TV (Philips 7000 series, SMART LED TV) with a resolution of 1920 × 1080 (Full HD) and a diagonal of 81 cm. The frame rate was 60 Hz.
3.2. Evaluation
We compared the response times between the different base disparities at a certain disparity difference using sig-nificance tests at a level of 0.05 and of 0.01. We performed a Wilcoxon signed rank test instead of e.g. ANOVA as not all response times per subject and per base disparity could be verified to be normal distributed according to a Lilliefors test with a significance level of 0.05.
3.3. Results
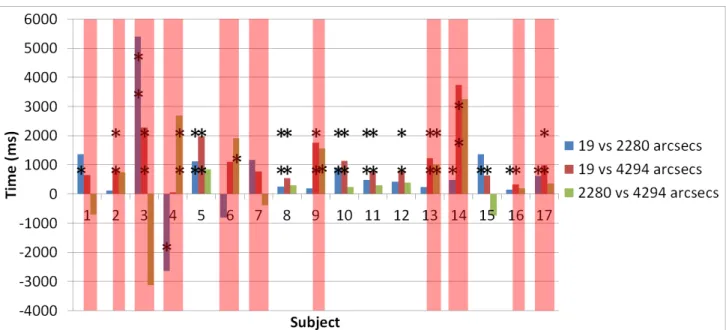
For a disparity difference of 95 seconds of arc eight sub-jects showed significant differences in response times be-tween base disparities of 19 and 2280 seconds of arc and between base disparities of 19 and 4294 seconds of arc. Three subjects only showed significant differences between 19 and 4294 seconds of arc and four subjects showed no
Figure 4. Comparison of the response times in ms of one subject for one base disparity against another base disparity (in arcsecs) at a disparity difference of 95 arcsecs using Wilcoxon signed rank test. The values show the differences of the medians computed using all response times respectively. Red colored background indicates that the correct decision rate at one or at both base disparities for the given disparity difference was below the psychometric threshold of 0.625. (*) indicates significance at a significance level of 0.05. (* *) indicates significance at a significance level of 0.01.
Figure 5. Comparison of the response times in ms of one subject for one base disparity against another base disparity (in arcsecs) at a disparity difference of 57 arcsecs using Wilcoxon signed rank test. The values show the differences of the medians computed using all response times respectively. Red colored background indicates that the correct decision rate at one or at both base disparities for the given disparity difference was below the psychometric threshold of 0.625. (*) indicates significance at a significance level of 0.05. (* *) indicates significance at a significance level of 0.01.
significant differences at all compared to 19 seconds of arc. Two subjects showed only significant results between 19 and 2280 seconds of arc (Tab.2, Fig.4).
For a disparity difference of 57 seconds of arc eight sub-jects showed significant differences in response times be-tween base disparities of 19 and 2280 seconds of arc and
between base disparities of 19 and 4294 seconds of arc. Six subjects only showed significant differences between 19 and 4294 seconds of arc and three subjects showed no significant differences at all compared to 19 seconds of arc (Tab.3, Fig.5).
sub-Figure 6. Comparison of the response times in ms of one subject for one base disparity against another base disparity (in arcsecs) at a disparity difference of 19 arcsecs using Wilcoxon signed rank test. The values show the differences of the medians computed using all response times respectively. Red colored background indicates that the correct decision rate at one or at both base disparities for the given disparity difference was below the psychometric threshold of 0.625. (*) indicates significance at a significance level of 0.05. (* *) indicates significance at a significance level of 0.01.
Table 2. Comparison of the response times in ms of one subject for one base disparity against another base disparity (in arcsecs) at a disparity difference of 95 arcsecs using Wilcoxon signed rank test. The values show the differences of the medians computed using all response times respectively. Bold values indicate that the correct decision rate at one or at both base disparities for the given disparity difference was below the psychometric threshold of 0.625. (*) indicates significance at a significance level of 0.05. (**) indicates significance at a significance level of 0.01.
Subject 19 vs 2280 19 vs 4294 2280 vs 4294 1 1192.32** 1524.93** 332.61 2 41.51 250.09** 208.57** 3 199.97* 233.39 33.43 4 1266.66* 3383.31** 2116.65* 5 116.90* 191.58* 74.68 6 8.34 208.32 199.98 7 1058.40* 1400.05** 341.66 8 −116.68* −91.59 25.09 9 724.91** 658.32** −66.60 10 333.27** 449.94** 116.68 11 16.65 191.69** 175.04 12 −24.92 −91.60 −66.68 13 175.02* 374.96** 199.94 14 524.20* 1908.21** 1384.01* 15 −91.56 75.02 166.58* 16 158.32** 316.59** 158.27** 17 −49.87 166.67** 216.54*
Table 3. Comparison of the response times in ms of one subject for one base disparity against another base disparity (in arcsecs) at a disparity difference of 57 arcsecs using Wilcoxon signed rank test. The values show the differences of the medians computed using all response times respectively. Bold values indicate that the correct decision rate at one or at both base disparities for the given disparity difference was below the psychometric threshold of 0.625. (*) indicates significance at a significance level of 0.05. (**) indicates significance at a significance level of 0.01.
Subject 19 vs 2280 19 vs 4294 2280 vs 4294 1 2233.19** 1650.04** −583.15 2 141.70** 391.74** 250.05** 3 858.35* 1391.50** 533.15 4 −283.30 2516.64** 2799.94* 5 83.31 216.64** 133.33 6 66.74 274.99 208.26 7 433.32 3483.19** 3049.86* 8 158.18 149.93 −8.25 9 1200.01** 1258.23** 58.22 10 374.91** 683.21** 308.30** 11 125.08* 341.69** 216.61* 12 116.82 108.47 −8.35 13 308.40** 633.27** 324.87 14 975.02** 4316.73** 3341.71* 15 0.09 249.35** 249.26** 16 33.24 241.65** 208.41** 17 25.00 216.71** 191.71
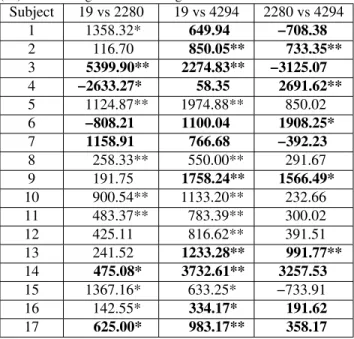
Table 4. Comparison of the response times in ms of one subject for one base disparity against another base disparity (in arcsecs) at a disparity difference of 19 arcsecs using Wilcoxon signed rank test. The values show the differences of the medians computed using all response times respectively. Bold values indicate that the correct decision rate at one or at both base disparities for the given disparity difference was below the psychometric threshold of 0.625. (*) indicates significance at a significance level of 0.05. (**) indicates significance at a significance level of 0.01.
Subject 19 vs 2280 19 vs 4294 2280 vs 4294 1 1358.32* 649.94 −708.38 2 116.70 850.05** 733.35** 3 5399.90** 2274.83** −3125.07 4 −2633.27* 58.35 2691.62** 5 1124.87** 1974.88** 850.02 6 −808.21 1100.04 1908.25* 7 1158.91 766.68 −392.23 8 258.33** 550.00** 291.67 9 191.75 1758.24** 1566.49* 10 900.54** 1133.20** 232.66 11 483.37** 783.39** 300.02 12 425.11 816.62** 391.51 13 241.52 1233.28** 991.77** 14 475.08* 3732.61** 3257.53 15 1367.16* 633.25* −733.91 16 142.55* 334.17* 191.62 17 625.00* 983.17** 358.17
Table 5. Number of subjects that were able to correctly identify a certain disparity difference (diff.) in seconds of arc (arcsecs) at a certain base disparity (base) in seconds of arc.
P P P P P P PP Base Diff.
19 arcsecs 57 arcsecs 95 arcsecs
19 arcsecs 14 17 17
2280 arcsecs 11 17 17
4294 arcsecs 7 16 16
jects showed significant differences in response times be-tween base disparities of 19 and 2280 seconds of arc and between base disparities of 19 and 4294 seconds of arc. Four subjects only showed significant differences between 19 and 4294 seconds of arc and two subjects showed no significant differences at all compared to 19 seconds of arc. Two subjects showed only significant results between 19 and 2280 seconds of arc (Tab.4, Fig.6).
For a disparity difference of 95 and of 57 seconds of arc all subjects were able to correctly identify all stimuli at each base disparity except of one subject. For a disparity differ-ence of 19 seconds of arc six subjects were able to correctly identify all stimuli at each base disparity. Two subjects had a stereo acuity of higher than 19 seconds of arc as they were not able to correctly identify this disparity difference at any base disparity.
Table 5 summarizes the number of subjects that were able to correctly identify a certain disparity difference at a certain base disparity.
4. Discussion and Conclusion
We expected that increased base disparities lead to de-creased stereoscopic visual performance. As 19 seconds of arc as base disparity was close to natural viewing conditions we assumed those performance results as reference values. We considered significant differences in the response times to be an indicator for a decrease in performance as the qual-itative measure “speed” degrades significantly. Thus, sub-jects required significantly more time to resolve a certain disparity difference into a recognized depth impression for comparison. We considered unsuccessful detection rates to be an indicator for an even stronger decrease in performance as the quantitative measure “stereo acuity” degrades. Thus, subjects were not able to resolve a certain disparity differ-ence into a recognized depth impression for comparison al-though they have been able at a lower base disparity.
For a disparity difference of 95 seconds of arc we as-sumed that for those eight subjects showing only signifi-cant differences they had a decline in performance inside and outside the zone of comfortable viewing. For those four subjects with no significant differences we assumed that their performance did not change even outside the zone of comfortable viewing. Two subjects are outliers due to their significant differences at the higher base disparities but not at the lower ones. This would mean that their refer-ence performances under natural conditions were lower. For the rest of the subjects the performance progress seemed to correspond to the zone of comfortable viewing as no per-formance decline appeared inside the zone of comfortable viewing but outside.
For a disparity difference of 57 seconds of arc we as-sumed that the performance progress corresponded with the zone of comfortable viewing for six subjects. Eight sub-jects showed a performance decline already inside the zone of comfortable viewing. Three subjects showed no decline in performance.
For a disparity difference of 19 seconds of arc four sub-jects showed a strong decline in performance as they could not detect disparity differences inside and outside the zone of comfortable viewing. For five subjects the performance progress in terms of detection rates corresponds with the zone of comfortable viewing, for three of them this also holds for the response time differences. Six subjects did not show a strong decline in performance in terms of detec-tion rates inside and outside the zone of comfortable view-ing. For one of them the performance progress in terms of response time differences corresponds with the zone of comfortable viewing.
base disparity corresponded to decreased performances. The higher the base disparity the higher the decline in per-formance. The harder the performance task the stronger the decline in performance for higher base disparities. There might be various reasons for this decline. One might be an increased visual discomfort due to the excessive C-A con-flict. Connecting the zone of comfortable viewing with the performance task results would yield to the requirement of an individual zone of comfortable viewing as the perfor-mance declines were highly subject dependent. The pro-posed method shows promising results to be used to mea-sure such individual zones of comfortable viewing but cur-rently there is no connection to visual discomfort as corre-lations to feedback by the subjects about visual discomfort were missing in this study. This is a requirement for future work.
5. Future Work
We presented a new method to quantify stereoscopic vi-sual performance at different base disparity levels inside and outside the zone of comfortable viewing. The com-bined analysis of stereo acuity and response time could en-able the measurement of an individual zone of comforten-able viewing for a given task complexity assuming comfortable viewing is connected with stereoscopic performance under natural viewing conditions. It could allow to adjust indi-vidual zones of comfortable viewing where disparities at their limits either do not change quantitative components of stereoscopic performance or also do not change qualitative components of stereoscopic performance. Our vision is to evaluate the connection between this task performances and visual discomfort and then to integrate tests based on this approach into commercially available 3D displays. Thus, users could run the tests initially on their own so that the display automatically and individually adjusts settings for a 3D television consumption without visual discomfort ac-cording to performance levels.
Acknowledgment
The authors gratefully acknowledge funding of the Er-langen Graduate School in Advanced Optical Technolo-gies (SAOT) by the German National Science Foundation (DFG) in the framework of the excellence initiative.
References
[1] M. Bach. The freiburg visual acuity test - automatic mea-surement of visual acuity. Optometry and Vision Science, 73(1):49–53, 1996.4
[2] M. Barkowsky, R. Cousseau, and P. Le Callet. Is visual fatigue changing the perceived depth accuracy on an au-tostereoscopic display? In SPIE 2011 Stereoscopic Displays and Applications XXII, pages 78631V–78631V–8, 2011.2
[3] M. Barkowsky and P. Le Callet. The influence of autostereo-scopic 3d displays on subsequent task performance. In Stereoscopic Displays and Applications XXI, pages 7524– 7534, 2010.2
[4] W. Chen, J. Fournier, M. Barkowsky, and P. Le Callet. New requirements of subjective video quality assessment method-ologies for 3dtv. In Video Processing and Quality Metrics 2010 (VPQM), 2010.2
[5] D. M. Hoffman, A. R. Girshick, K. Akeley, and M. S. Banks. Vergence-accommodation conflicts hinder visual per-formance and cause visual fatigue. Journal of Vision, 8(3):1– 30, March 2008.2
[6] I. P. Howard and B. J. Rogers. Perceiving in Depth - Volume 2: Stereoscopic Vision. Oxford University Press, Inc., 2012.
2
[7] B. Julesz. Binocular depth perception without familiarity cues. Science, 145(3630):356–362, 1964.2
[8] J. Kuze and K. Ukai. Subjective evaluation of visual fatigue caused by motion images. Displays, 29(2):159–166, 2008.2
[9] M. Lambooij, W. IJsselsteijn, M. Fortuin, and I. Heynder-ickx. Visual discomfort and visual fatigue of stereoscopic displays: A review. Journal of Imaging Science and Tech-nology, 53(3):030201–030201–14, May-June 2009.2
[10] J. Li, M. Barkowsky, J. Wang, and P. Le Callet. Study on visual discomfort induced by stimulus movement at fixed depth on stereoscopic displays using shutter glasses. In Dig-ital Signal Processing (DSP), 2011 17th International Con-ference on, pages 1–8, 2011.2
[11] B. Rassow, H. Cavazos, and W. Wesemann. Normgerechte Sehsch¨arfenbestimmung mit Buchstaben. Augen¨arztliche Fortbildung, 13:105–14, 1990.4
[12] J. J. Saladin. Stereopsis from a performance perspective. Op-tometry and Vision Science, 82(3):186–205, 2005.2
[13] J. A. Swets and D. M. Green. Signal Detection Theory and Psychophysics. New York: Wiley, 1966.3
[14] K. Ukai and P. A. Howarth. Visual fatigue caused by view-ing stereoscopic motion images: Background, theories, and observations. Displays, 29(2):106–116, 2008.2
[15] H. Urey, K. V. Chellappan, E. Erden, and P. Surman. State of the art in stereoscopic and autostereoscopic display. Pro-ceedings of the IEEE, 99(4):540–555, 2011.2
[16] M. Wopking. Viewing comfort with stereoscopic pictures: an experimental study on the subjective effects of disparity magnitude and depth of focus. Journal of the Society for Information Display, 3:101–103, 1995.2