T
T
H
H
È
È
S
S
E
E
En vue de l'obtention du
D
D
O
O
C
C
T
T
O
O
R
R
A
A
T
T
D
D
E
E
L
L
’
’
U
U
N
N
I
I
V
V
E
E
R
R
S
S
I
I
T
T
É
É
D
D
E
E
T
T
O
O
U
U
L
L
O
O
U
U
S
S
E
E
Délivré par : Institut National Polytechnique de Toulouse Discipline ou spécialité : Sciences de la Terre et des Planètes Solides
JURY
Mohamed CHAGDALI (rapporteur) Université Hassan II, laboratoire LCSM, Casablanca Diane P. HORN (rapporteur) Birkbeck University, London, School of Geography Vincent REY (président) Université du Sud-Toulon-Var, ISITV & LSEET-LEPI
Dominique ASTRUC Institut National Polytechnique de Toulouse, IMFT
Jérôme BROSSARD Université du Havre, laboratoire LOMC
David LABAT Université Paul Sabatier, LMTG, Toulouse
Manuel MARCOUX (co-dir. thèse) Université Paul Sabatier, IMFT
Rachid ABABOU (dir. thèse) Institut National Polytechnique de Toulouse, IMFT Olivier EIFF (invité) Institut National Polytechnique de Toulouse, IMFT Michel QUINTARD (invité) CNRS, laboratoire IMFT, Toulouse
Ecole doctorale : Sciencesde l'univers, de l'environnement et de l'espace (SdU2E)
Unité de recherche : Institut de Mécanique des Fluides de Toulouse (IMFT) Directeur(s) de Thèse : Rachid ABABOU etManuel MARCOUX.
Présentée et soutenue par Yunli WANG LE 16SEPTEMBRE 2010
Etude expérimentale et numérique des oscillations hydrodynamiques
en milieux poreux partiellement saturés
I
Title
Experimental and Numerical Study of
Hydrodynamic Oscillations in Partially
en milieux poreux partiellement saturés
II
Résumé
Cette thèse vise à étudier expérimentalement, analytiquement et numériquement, les conséquences de variations et d’oscillations hydrodynamiques à forte variabilité temporelle en milieux poreux partiellement saturés. Les problèmes que nous étudions comportent des surfaces libres tant à l’extérieur qu’à l’intérieur des milieux poreux, celles-ci étant définies comme des isosurfaces de pression d’eau égale à la pression atmosphérique (Pwater = Patm). Les différentes études expérimentales réalisées en laboratoire sont, respectivement :
• une expérience d’imbibition dans une boite à sable avec effets capillaires importants; • la transmission d’oscillations de la surface libre à travers un massif sableux
intercalaire dans un petit canal à houle (IMFT, Toulouse);
• l’étude de la dynamique et de la propagation des oscillations des niveaux d’eau dans un grand canal à houle (HYDRALAB, Barcelone), partiellement recouvert d’un fond sableux incliné, avec mesures de niveaux d’eau en pleine eau et sous le sable, et mesures du fond sableux (érosion/dépôts).
Pour les études théoriques, nous avons développés des solutions analytiques linéarisées. Un exemple de problème traité analytiquement est: l’équation linéarisée de Dupuit-Boussinesq (D-B) transitoire à surface libre, en hypothèse d’écoulements plans et vidange/remplissage instantané : oscillations forcées, transmission et dissipation d’ondes à travers une boite à sable rectangulaire.
Nous avons aussi développé une solution de l’équation faiblement non linéaire de Dupuit-Boussinesq (D-B) pour étudier le problème d’imbibition avec variation abrupte du niveau d’eau amont (suivi temporel du front de saturation).
Nous avons pu étudier les différents types de problèmes transitoires liés aux expériences citées plus haut par simulation numérique. En particulier, nous avons simulé des écoulements partiellement saturés et insaturés, en coupe verticale, à l’aide d’un code de calcul (BIGFLOW 3D) qui résoud l’équation de Richards généralisée en régime transitoire.
Nous avons ainsi étudié numériquement en régime non saturé, l’expérience d’imbibition dans un sable initialement sec à frontières verticales (IMFT sandbox), puis l’expérience de propagation d’ondes dans le grand canal à houle de Barcelone (laboratoire HYDRALAB) comportant une plage de sable inclinée, avec un couplage complètement intégré entre les zones micro-poreuse (sable) et “macro-poreuse” (pleine eau).
Pour analyser les résultats de cette dernière expérience et les comparer aux simulations, nous avons utilisé plusieurs méthodes de traitement et d’analyse des signaux : analyse de Fourier (spectres de fréquences) ; ondelettes discrètes multi-résolution (Daubechies) ; analyses corrélatoires simple et croisée. Ces méthodes sont combinées avec des méthodes de pré-filtrage pour estimer dérives et résidus (moyennes mobiles ; ondelettes multi-résolution). Cette analyse des signaux a permis de comprendre et quantifier la propagation à travers une plage de sable.
Au total, les différentes approches de modélisation mis en œuvre, associé à des procédures de calage en situation de couplage transitoire non linéaire ont permis de reproduire globalement les phénomènes de propagation de teneur en eau et de niveau d’eau dans les différentes configurations étudiées.
Mots-Clé : Eau souterraine; Imbibition ; Propagation d’ondes ; Oscillations et fluctuations; Milieux
poreux; Macro-poreux; L’écoulement plan (Dupuit-Boussinesq); Equation de Richards ; Ecoulement partiellement saturé; Plage de sable inclinée; Traitement des signaux ; Ondelettes multirésolution ; Fonction de corrélation croisée; Spectre de fréquences ; Fonction de cohérence ; Canal à houle
Hydrodynamic Oscillations in Partially Saturated Porous Media
III
Abstract
This thesis aims at investigating experimentally, analytically and numerically, the consequences of hydrodynamic variations and oscillations with high temporal variability in partially saturated porous media. The problems investigated in this work involve “free surfaces” both outside and inside the porous media, the free surface being defined as the “atmospheric” water pressure isosurface (Pwater = Patm).
The laboratory experiments studied in this work are, respectively: • Lateral imbibition in a dry sand box with significant capillary effects;
• Transmission of oscillations of the free surface through a vertical sand box placed in a small wave canal (IMFT, Toulouse);
• Dynamics of free surface oscillations and wave propagation in a large wave canal (HYDRALAB, Barcelona), partially covered with sand, with measurements of both open water and groundwater levels, and of sand topography (erosion / deposition).
For theoretical studies, we have developed linearized analytical solutions. Here is a sample problem that was treated analytically in this work:
• The linearized equation of Dupuit-Boussinesq (DB) for transient free surface flow, assuming horizontal flow and instantaneous wetting/drainage of the unsaturated zone: forced oscillations, wave transmission and dissipation through a rectangular sandbox.
We also developed a weakly nonlinear solution of the Dupuit-Boussinesq equation to study the sudden imbibition (temporal monitoring of the wetting front).
We have studied the different types of transient flow problems related to the experiments cited above by numerical simulation. In particular, we have simulated unsaturated or partially saturated transient flows in vertical cross-section, using a computer code (BIGFLOW 3D) which solves a generalized version of Richards’ equation.
Thus, using the Richards / BIGFLOW 3D model, we have studied numerically the experiment of unsaturated imbibition in a dry sand (IMFT sandbox), and then, with the same model, we have also studied the partially saturated wave propagation experiment in the large Barcelona wave canal (HYDRALAB laboratory), focusing on the sloping sandy beach, with coupling
between the micro-porous zone (sand) and the “macro-porous” zone (open water).
To interpret the results of the latter experiment and compare them to simulations, we use several methods of signal analyzis and signal processing, such as: Fourier analysis, discrete multi-resolution wavelets (Daubechies), auto and cross-correlation functions. These methods are combined with pre-filtering methods to estimate trends and residuals (moving averages; discrete wavelet analyses). This signal analyzis has allowed us to interpret and quantify water propagation phenomena through a sandy beach.
To sum up, different modeling approaches, combined with model calibration procedures, were applied to transient nonlinear coupled flow problems. These approaches have allowed us to reproduce globally the water content distributions and water level propagation in the different configurations studied in this work.
Key-Words: Groundwater; Sand box; Imbibition ; Wave propagation and transmission ; Water level
oscillations and fluctuations ; Porous media ; Micro-porous ; Macro-porous ; Numerical simulation ; Plane flow model (Dupuit-Boussinesq) ; Richards nonlinear 3D model ; Partially saturated flow ; Sand Box ; Sloping sand beach ; Signal processing ; Multiresolution wavelets ; Cross-correlation function ; Period ; Frequency spectrum ; Coherency function; Wave canal ; Wave generator.
IV
Remerciements
Ce travail de thèse a été réalisé à l’Institut de Mécanique des Fluides de Toulouse (IMFT), et financé par le gouvernement chinois (CSC scholarship).
Arrivée au bout de ce travail, il m’est agréable de remercier tous ceux qui n’ont pas hésité à me fournir ce qu’ils pouvaient comme aide et assistance.
Je tiens tout d'abord à exprimer ma profonde reconnaissance à mon directeur de thèse le professeur Rachid Ababou, qui a consacré à l'encadrement de ma thèse un temps et une disponibilité d’esprit considérables ; j'y ai été d'autant plus sensible que son emploi du temps est très chargé. J'ai ainsi largement pu profiter de sa grande acuité scientifique et de son enthousiasme indéfectible et communicatif pour le travail de ses étudiants. Je lui suis donc redevable d'avoir pu faire une thèse dans des conditions exceptionnelles.
Je remercie également mon co-directeur de thèse, Dr. Manuel Marcoux, qui m'a accompagnée tout au long de ce travail de thèse. Je souhaite également le remercier en particulier pour le sens qu’il a su donner à mon travail ainsi que pour son aide lors des expériences.
Je tiens à remercier Monsieur Michel Quintard qui m’a présenté au professeur Rachid Ababou m’ayant permis de réaliser ma thèse à IMFT.
Je remercie tous les membres du jury d’avoir accepté l’invitation pour participer à mon jury de thèse : Mohamed Chagdali, Diane P. Horn, Vincent Rey, Dominique Astruc, Jérôme Brossard, David Labat, Olivier Eiff, Michel Quintard.
Je remercie la direction de l’IMFT (directeur Jacques Magnaudet, directeur adjoint Henri-Claude Boisson, assistante de direction Doris Barrau, coordinatrice administrative Sandrine Chupin, agents hygiène et sécurité Bruno Bourret) et tous le personnel (en particulier Suzy Bernard, Lionel Le-Fur, Muriel Sabater, Catherine Thuriot, Jean-Pierre Escafit, Hervé Ayroles, Yannick Exposito) pour leur gentillesse et leur excellent travail. Particulièrement, je
tiens à remercier madame Catherine Thuriot qui m’a aidé pour le bon déroulement de l’apéritif de fin de soutenance.
Je remercie les directeurs de l’Université Jiaotong Chongqing qui m’ont donné la chance de faire mes études en France ; également, je remercie la responsable de ma bourse Xiaotao Zhang et tous les employés du Crous qui ont une grande responsabilité dans le déroulement de ce travail, m’ayant permis de réaliser ma thèse dans de bonnes conditions matérielles.
Je remercie tous les doctorants de Groupe GEMP, ceux qui sont toujours là comme ceux qui sont partis : Hassane Fatmi, David Bailly, Khalil Alastal, Clément Louriou, ..., pour leurs amitié et discussions concernant le sujet de thèse mais aussi parcequ’ils ont facilité mon intégration et le bon déroulement de mon séjour en France.
Je remercie tous mes amis, particullierement, Bilal Alhajjar, Faiza Hidri, Long Du, Na Tao, Yua Yang et Thu-Thi-Hoai Le qui m’ont donné beaucoup d’amitié et beaucoup de courage pendant ma thèse, surtout pendand les périodes les plus difficiles.
Je désire enfin remercier mes parents, mes frères et mes soeurs. Je pense à ma mère: ses conseils et ses sacrifices sont gravés dans mon esprit et me guideront pour toute la vie ; à mon père ; sa patience et son soutien moral et matériel au long de mes études ont été pour moi d'un grand réconfort. Je pense aussi, à mes frères et soeurs pour leur compréhension et leur amour qui m’a donné la force de continuer.
V
Table of contents
List of symbols
Introduction ... 1
0 Introduction ... 1
0.1 Objectives of the thesis 1 0.2 Literature review (state of the art) 2 0.2.1 Observations on beach groundwater response to tidal & wave forcing ... 2
0.2.2 Modeling of beach groundwater response to tidal & wave forcing ... 7
0.2.3. Other review on topics of interests ... 11
0.3 Outline of the thesis 14
Part I GOVERNING EQUATIONS AND NUMERICS ... 17
Chapter 1: Governing equations and constitutive laws for porous media ... 18
1.1 Introduction 18 1.1.1 Configuration and hypothesis of the problems ... 18
1.1.2 Navier-Stokes equation and its simplifications ... 18
1.2 Plane flow equations with a free surface (Dupuit-Boussinesq) 19 1.3 Partially saturated / unsaturated media with capillary effects (3D Richards) 20 1.3.1 Van Genuchten / Mualem model of K(h) and θ(h) ... 21
1.3.2 Exponential model of θ(h) and K(h) ... 21
1.3.3 Capacity function C(h) ... 22
1.3.4 Diffusion function D(h) ... 22
1.3.5 Interpretation of the parameters (α) in the exponential model ... 23
1.3.6 Interpretation of the parameters (α) in the VGM model ... 24
1.4 Partially saturated macro-porous media (3D Richards) 25
Chapter 2: Numerical procedure ... 26
2.1 General presentation of BigFlow (2D/3D finite volume code) 26 2.2 Flowchart of the numerical iterations in the Bigflow code 27 2.3 Numerical procedure for time-varying Boundary Conditions 27 2.3.1 Boundary conditions for the Boussinesq model and Richards model ... 27
2.3.2 Compilation of executable file for the time-varying BC’s problem ... 28
VI
2.4 Debugging and validation tests for the unsaturated flow 30
2.4.1 Validation tests of macro-porous media: the falling head permeameter ... 31
Part II MODELING OF NON-OSCILLATORY FLOWS IN POROUS
MEDIA ... 41
Chapter 3: Wetting and discharge problems (non-oscillatory) ... 42
3.1 Introduction 42 3.2 Wetting problem (variably saturated imbibition in a dry sand) 42 3.2.1 Introduction ... 42
3.2.2 Laboratory experiment ... 42
3.2.3 Analytical solution with Boussinesq plane flow (Polubarinova) ... 43
3.2.4 Numerical simulation and calibration of the wetting problem ... 46
3.2.5 Conclusion on the wetting problem ... 54
3.3 Groundwater discharge problem 54 3.3.1 Introduction ... 54
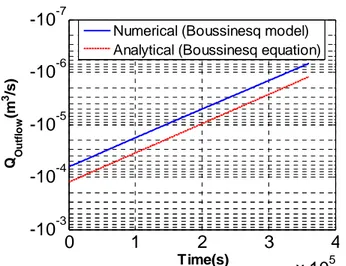
3.3.2 Analytical solutions of Boussinesq equation ... 55
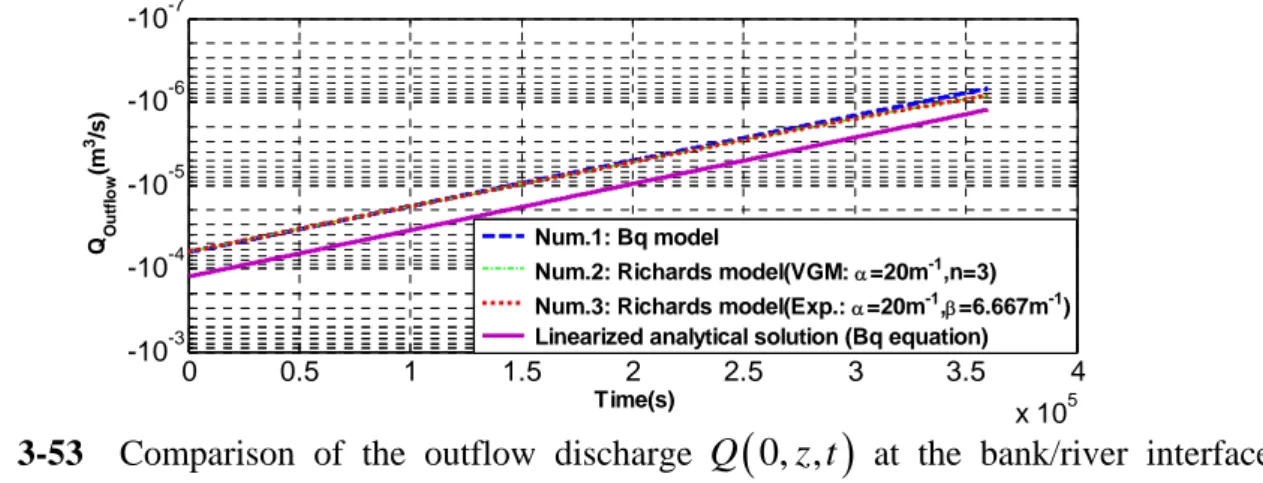
3.3.3 Numerical simulations (Boussinesq and Richards) ... 59
3.3.4 Conclusion on the discharge problem ... 72
Part III MODELING OF OSCILLATORY FLOWS IN POROUS MEDIA 74
Chapter 4: Wave propagation through a vertical sandbox (small wave
canal) ... 75
4.1 Introduction 75 4.2 Laboratory experiment: vertical sandbox in small wave canal 76 4.2.1 Experiment description and methodology ... 76
4.2.2 Interpretation of the experimental results ... 80
4.2.3 Acknowledgment ... 83
4.3 Linearization and analytical solution of the non-linear Boussinesq equation 83 4.3.1 Linearized Boussinesq analytical solution under oscillatory conditions ... 83
4.3.2 Physical interpretation ... 86
4.3.3 Posterior analysis of various effects and limitations (inertial effects, acceleration, erosion)86 4.4 Numerical simulations of wave propagation in the sandbox 88 4.4.1 Numerical simulation with vertically hydrostatic Boussinesq model ... 88
4.4.2 Comparisons of the numerical results and analytical solution ... 90
4.5 Analysis of the maximum error of analytical results 92 4.5.1 Introduction and definition of maximum errors ... 92
VII
4.5.3 Applicable range of the analytical solution ... 97
4.6 Conclusion 97
Chapter 5: Water level measurements in a sandy beach: the Barcelona
wave canal experiment ... 100
5.1 Introduction 100 5.2 Laboratory experiment: sloping sand beach in wave canal (Hydralab Barcelona) 101 5.2.1 Experiment description and methodology ... 101
5.2.2 Measured water levels Hi(t) of the experiment ... 108
5.3 Conclusion and outlook 109 5.5 Acknowledgement 110
Chapter 6: Signal analyses and interpretation of water level data H(x,t) in
the Barcelona wave canal ... 111
6.1 Introduction 111 6.2 Analysis of Sensor 1 (H1(t)) used as entry boundary condition 112 6.2.1 Introduction ... 112
6.2.2 Periodic characteristics of the original signal ... 112
6.2.3 Fourier spectral analysis of the original signal ... 112
6.2.4 Multi-resolution wavelet decomposition of the original signal, and Fourier analysis of wavelet components ... 114
6.2.5 Simplification of the signals ... 117
6.2.6 Summary ... 119
6.3 Analysis of Sensor 7 (groundwater) 119 6.3.1 Introduction ... 119
6.3.2 Analysis of the results ... 119
6.4 Analysis of the other sensors (between swash zone and deep groundwater) 121 6.5 Cross analysis 121 6.5.1 Introduction ... 121
6.5.2 Residuals of Hi(t)(i=1, …, 7) with moving average filtering ... 122
6.5.3 Cross analysis between H1(t) and Hi(t) (i=2, …, 7) ... 123
6.5.4 Detailed cross analysis between H1(t) and H3(t) ... 138
6.5.5 Cross analysis between H1(t) and H7(t) ... 144
6.6 Wave propagation velocity 149 6.6.1 Measured wave propagation velocity ... 149
6.6.2 Theoretical wave propagation velocity ... 150
VIII
Chapter 7: Numerical simulations of wave propagation in the sloping sandy
beach of the Barcelona canal ... 155
7.1 Introduction 155 7.2 Computational domain 155 7.3 Left boundary condition for the numerical simulation of Barcelona experiment 156 7.4 Saturated hydraulic conductivity of the beach sand 157 7.4.1 Kozeny-Carman empirical formula ... 157
7.4.2 Measured hydraulic conductivity obtained in laboratory experiment ... 157
7.4.3 Discussion about the saturated hydraulic conductivity ... 157
7.5 Vertically hydrostatic Boussinesq model (2D) 157 7.5.1 Introduction ... 157
7.5.2 Numerical simulation with Boussinesq model ... 158
7.5.3 Comparisons between numerical and experimental results ... 159
7.5.4 Sensitivity analysis with respect to hydraulic conductivity Ks ... 161
7.5.5 Conclusion on the Dupuit-Boussinesq model ... 163
7.6 Simulation with Richards model in vertical cross-section (x,z) 163 7.6.1 Introduction ... 163
7.6.2 Hydrodynamic behavior of the macro porous medium ... 163
7.6.3 Coupling of the micro porous medium and macro porous medium ... 164
7.6.4 Numerical tests with the VGM model for K(h) and θ(h) ... 164
7.6.5 Numerical simulation with the exponential model for K(h) and θ(h) ... 179
7.6.6 Comparison of the numerical results with the Exponential and VGM models ... 182
7.7 Conclusion and outlook 185
Chapter 8 : Conclusions ... 187
Conclusions et perspectives ... 188
Conclusions and outlook ... 194
Part IV APPENDICES ... 199
Résumé étendu ... 200
Appendix A ... 214
Appendix A: Chapter 2 ... 215
AC.2.1 ReadMe_BF2005FORTRAN_Compiling.rtf... 215Appendix B ... 217
Chapter B9: Signal analysis for oscillatory flows (methodology) ... 218
IX
9.2 Signal filtering methods 218
9.2.1 Introduction ... 218
9.2.2 Moving average filtering (linear integrator filter) ... 218
9.2.3 Differential filtering ... 220
9.2.4 Discrete multi-resolution wavelet filtering ... 220
9.2.5 Comments... 220
9.3 Signal analysis methods 221 9.3.1 Introduction ... 221
9.3.2 Correlation analysis (single and cross) and temporal transfer function ... 221
9.3.3 Fourier spectral analysis with Fourier transformation of single, cross spectra and frequency gain ... 224
9.3.4 Multi-resolution wavelet analysis ... 235
9.4 Conclusion 241
Chapter B10: Illustrations of the signal processing of the measured water
level data H
1(t) and H
6(t) of the experiment in Barcelona ... 244
10.1 Introduction 244 10.2 Preliminary note (Sub-sampling) 244 10.3 Original signal of H1 (t) and H6 (t) 245 10.3.1 Introduction ... 245
10.3.2 Original signal of H1(t) ... 246
10.3.3 Original signal of H6 (t) ... 247
10.4 Signal processing of H1 (t) 247 10.4.1 Introduction ... 247
10.4.2 Signal processing of the original signal H1(t) ... 248
10.4.3 Analysis of the residuals of H1(t) ... 252
10.4.4 Comparison of the same wavelet dyadic component C5 ... 261
10.5 Signal processing of H6(t) 262 10.5.1 Introduction ... 262
10.5.2 Analysis of the original signal H6(t) ... 262
10.5.3 Analysis of the residual of H6(t) ... 264
10.5.4 Comparison of the same wavelet dyadic component C9 ... 273
10.6 Cross analysis between H1(t) and H6(t) 274 10.6.1 Introduction ... 274
10.6.2 Cross analysis of the original signal between H1(t) and H6(t) ... 274
X
10.7 Comparison of the wavelet dyadic component C8 of H1(t) and H6(t) 283
10.7.1 Wavelet dyadic component C8 of the original signal of H1(t) and H6(t) ... 283
10.7.2 Wavelet dyadic component C8 of the residuals of H1(t) and H6(t) with moving average filtering ... 284
10.7.3 Wavelet dyadic component C8 of the residuals of H1(t) and H6(t) with differential filtering ... 284
10.7.4 Wavelet dyadic component C8 of the residuals of H1(t) and H6(t) with multi-resolution wavelet filtering ... 285
10.8 Conclusion 286
Chapter B11: Single harmonic wave numerical experiment for the
Barcelona canal (short run) ... 288
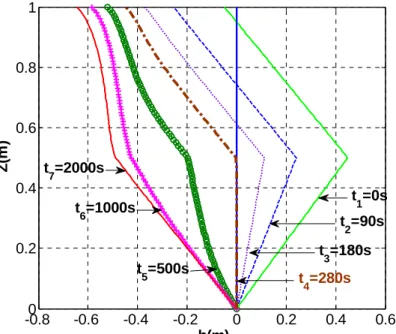
11.1 Introduction 288 11.2 Simulation domain 288 11.3 Boundary and initial conditions 288 11.3 Physical properties of the beach sands and the sea water 289 11.4 Duration of the simulation and numerical parameters 290 11.5 Numerical behaviour of Bigflow during the simulation 290 11.6 Result analysis of the one single harmonic wave test 291 11.6.1 Profiles of the pressure head contour and the flux velocity field ... 291
11.6.2 Instantaneous water content distribution θ(h) in the vertical section ... 292
11.6.3 Water levels H(x,t) and pressure head h(x,z=0,t) ... 293
11.6.4 Evolution of the water level fluctuations in time and space ... 294
11.7 Analysis on the system energy balance during the numerical simulation 296 11.8 Conclusion on one single harmonic wave test 298
Chapter B12: Single harmonic wave numerical experiment for the
Barcelona experiment (long run) ... 300
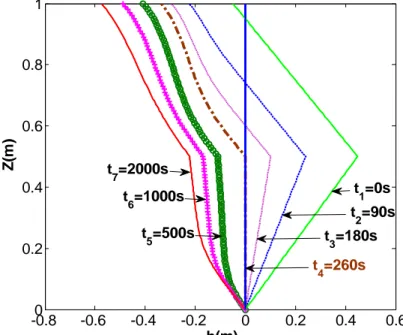
12.1 Introduction 300 12.2 Simulation domain 300 12.3 Boundary and initial condition 300 12.3 Physical properties of the sand beach and the sea water 301 12.4 Duration of the simulation and numerical parameters 301 12.5 Numerical behaviour of Bigflow during the simulation 301 12.6 Result analysis of continuous wave test 302 12.6.1 Profiles of the pressure head contour and the flux velocity field ... 302
XI
12.6.3 Evolution of the water level fluctuations in time and space ... 305
12.7 Analysis on the system energy balance during the numerical simulation 309 12.8 Sensitivity analysis of the VGM parameters, soil physical properties, mean free water levels and beach slopes on the groundwater level fluctuations 311 12.9 Conclusions and outlook 314 12.10 Key questions and discussion 315
REFERENCES ... 316
References ... 317
List of Figures ... 326
XII
List of symbols
Roman symbols
Amplutude of the watel level fluctuations, m;
Approximation of the dyadic scale ‘m’ (low pass filter) of multi-resolution wavelet, m; Wavelet component of the dyadic scale "j", m;
Phase velocity of Boussinesq, m/s; Group velocity of Boussinesq, m/s;
Fourier frequency coherency function; Autocovariance function;
Cross covariance function;
Capacity function with respect to the pressure head h, ; Diffusion function with respect to the pressure head h, / ;
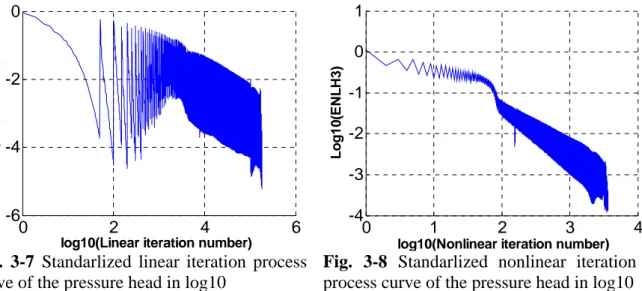
Detail of a discrete signal with the resolution "m" of the multi-resolution wavelet, m; ENLH3 Convergence criterion of pressure head of no-linear iterations (Picard);
ENORM3 Convergence criterion of pressure head of linear iterations; Dimensional frequency;
Dimensionless frequency;
Fourier no-reduced gain function (dimensional); Fourier reduced gain function (dimensionless); Gravity acceleration and 9.81 / ;
b
h
Bubble pressure head, m;H Water elevation or water head, m;
h Pressure head in the Richards equation, m;
h Water depth in the Dupuit-Boussinesq equations, m; h Mean water depth in the porous media, m;
S
K
Saturated hydraulic conductivity, m/s;r
K
Residual hydraulic conductivity, m/s;XIII
Relative hydraulic conductivity function with respect to the pressure head h, m/s; Permeability of the porous media, m2;
Hydraulic conductivity and 0.87310 , m/s;
m Dimensionless exponent of the VGM model and 1 1/ (Mualem); n Dimensionless exponent of the VGM model;
Darcy flux vector, / ;
Total net discharge entering or outgoing through all the faces of the computional domain (instantaneous or local) with Bigflow, / ;
Discharge corresponding to the change in volume of water inside the computational domain during the time interval DT (instantaneous or local) with Bigflow, / ;
Residual of the dyadic scale ‘m’ (high pass filter) of multi-resolution wavelet, m; Autocorrelation function;
Cross correlation function;
Degree of saturation of water content;
Relative hydraulic conductivity function with respect to the pressure head h; Dimensional Fourier auto-spectrum, . ;
Dimensional Fourier cross spectrum, . ; Dimensionless Fourier auto-spectrum; Dimensionless Fourier cross spectrum; ∆ Time step, s;
Time, s; Period, s;
Hydraulic transmissivity in Dupuit –Boussinesq equation, m2 /s; Velocity vector, m/s;
Net volume of water entered or exited through all the sides of the field since the beginning of the numeric simulation (accumulative or global) with Bigflow, ;
Van Genuchten/Mualem;
Volume of water formed or disappeared within the area since the beginning of the numerica simulation (accumulative, global) with Bigflow;
W-K Wiener-Khichen;
half window width of Moving average filtering, s; Wetting saturation front toe, m;
XIV
Greek symbols
Inverse of the capillary length for the VGM model and Exponential model, ; Capillary parameter for the water content function in the Exponential model; Decay length of the wave propagation in the porous media and δ K , m; Water depth, m;
( )
hθ Unsaturated water content function with respect to the pressure head h, m3
/m3;
r
θ
Residual water content, m3/m3;s
θ
Saturated water content in the Richards equation, m3/m3; Frequency spectrum of phase density, rad/s; Capillary length and , m;Dynamic viscosity, / · ;
Cinematic viscosity and / , / ; Volumic specific density or mass, / ;
Volumic specific density or mass, / ; Standard deviation function;
Lag time of Tuckey filter, s;
Φ Unconfined storage coefficient or effective porosity, m3/m3;
, Wavelet function (mother wavelet);
i
Introduction
En hydrologie et l'hydrogéologie, les niveaux d'eau subissent des oscillations ou de brusques changements dans le temps. Cela peut se produire dans les aquifères, réservoirs, lacs, rivières, digues, les estuaires, les ports et les zones côtières. Dans de nombreux cas, les oscillations des surfaces libres ont lieu en eau libre, puis, se propagent dans les milieux poreux adjacents (plages, les aquifères côtiers, les berges, les digues, brise-lames, et ainsi de suite). Dans ce travail, nous étudions la réponse de la nappe phréatique, qui est, à la fois des zones saturées et non saturées (séparés par des surfaces libres) dans des conditions très dynamiques. Nous sommes intéressés à deux cas en particulier: des changements brusques et des oscillations périodiques des niveaux d'eau. Ceux-ci peuvent résulter de conditions environnementales naturelles ou induites par les opérations de l'homme dans le génie civil et hydrologiques applications.
Ainsi, nous nous concentrons sur les effets potentiels des variations des niveaux d'eau dans le voisinage de corps poreux, tels que (Figures 0-1 et 0-2):
Propagation d’ondes dans un environnement cosntitué de milieux poreux (plages, zones côtières et les estuaires) ;
Transmission / dissipation des marées et des vagues à travers les digues, brise-lames ou (ports) ;
variations de niveau d’eau de grande amplitude dans les rivières et les réservoirs, par exemple, à cause d’opérations de barrages;
Interactions crues/eaux souterraines, et inondations/eaux souterraines (interactions sols-nappes-riviere en hydrologie)
Dans cette thèse, nous étudions en particulier la réponse du système de nappe phréatique des milleux poreux avec la surface libre aux variations des niveaux d'eau dans les eaux libres adjacents. Celui-ci peut être traité soit comme une frontière du domaine poreux, ou bien comme une interface interne (cf. plage de sable en pente). Deux types principaux de
ii
(ii) des oscillations périodiques dues par exemple à des marées ou vagues (cf. les expériences de canal à houle).
Les analyses développées dans la thèse reposent sur trois approches complémentaires: Expériences physique avec des modèles à échelle réduite dans le laboratoire (boites à
sable, canaux);
Solutions analytiques linéarisées ou faiblement non-linéaire en termes des niveaux d'eau (modèle de Dupuit-Boussinesq de l’écoulement plan)
Solutions numériques complètements non-linéaires de l’équation de Richards en termes de pression interstitielle, teneur en eau et Darcy flux, en 3D ou en coupes verticales, basée sur le code volume finis implicite (BigFlow 3D).
1
0 Introduction
0.1 Objectives of the thesis
In hydrology and hydrogeology, water levels frequently undergo oscillations or abrupt changes in time. This can occur in aquifers, reservoirs, lakes, rivers, embankments, estuaries, ports, and coastal zones. In many cases, oscillations of free surfaces take place in open water bodies, and then, propagate into adjacent porous media (beaches, coastal aquifers, river banks, dykes, breakwaters, and so on). In this work, we study the response of ground water, that is, both unsaturated and saturated zones (separated by free surfaces) under very dynamic conditions. We are interested in two cases in particular: abrupt changes, and periodic oscillations of water levels. These can arise from natural environmental conditions, or from man induced operations in civil engineering and hydrological applications.
Thus, we focus on the potential effects of variations of water levels in the vicinity of porous bodies, such as (as illustrated in Figures 0-1 and 0-2):
Wave propagation in environmental porous media (beaches, coastal areas and estuaries); Transmission/dissipation of tides and swells through dykes, or breakwaters (harbours) Large variations of water levels in rivers and reservoirs, e.g. due to dam operations, Effect of river floods on groundwater via stream-aquifer interactions (hydrology).
Figure 0-1. Three Gorges Dam Reservoir filled
to 135 meters (international PROBE, Mu Lan, June 2003).
Figure 0-2. Sea beach of Rincon, Puerto
2
In this thesis, we investigate in particular the response of a ‘free surface’ porous medium water system (e.g. a phreatic aquifer with a ‘groundwater table’) to variations of the water levels in adjacent open water bodies. The latter can be treated either as a boundary of the porous domain, or else as an internal interface (cf. sloping sand beach). Two main types of dynamics are investigated: (i) sudden change of water level (cf. ‘imbibition problem’,
Chapter 3); and (ii) periodic oscillations due for example to tides or swells (cf. wave canal
experiments, Chapter 4, 5, 6, and 7).
The analyses developed in the thesis rely on three complementary approaches:
Physical experiments with reduced scale models in the laboratory (sandboxes, canals); Linearized or weakly non linear analytical solutions in terms of water levels
(Dupuit-Boussinesq plane flow model);
Fully nonlinear numerical solutions of the Richards flow equation in terms of pore pressure, water contents and Darcy fluxes, in 3D or in vertical cross-sections, based on implicit finite volume code (BIGFLOW 3D).
0.2 Literature review (state of the art)
In this section, we examine the literature on oscillations and wave propagation in groundwater and above the free surface as well (unsaturated zone). We also include the case of sudden variations of water levels, as can occur for instance in dam reservoirs and lakes. However, we do not study two other important topics: the full coupling of porous media and open water hydrodynamics based on Navier-Stokes approaches, and the hydro-mechanical coupling (pressure-stress-strain, erosion, effects on possible terrain failures and slides) that can occur within the porous media under highly variable water levels and water pressures. Rather, we focus mainly on experimental and modeling studies focusing on water level oscillations and wave propagations, e.g., through reservoir dam embankments and through sandy beaches (our review is currently more complete on the latter topic).
0.2.1 Observations on beach groundwater response to tidal & wave forcing
Beach groundwater hydrodynamics are a result of combined forcing from ocean tides (at diurnal of half-diurnal periods) and other shorter waves (swell) generated by wind and by barometric pressure differences, and occurring at a wide range of frequencies or periods (typically around 0.1 Hz or 10 s).
Beach groundwater response to tidal forcing has been studied extensively, and has been reviewed by many authors, including Nielsen et al. (1988)[72], Gourlay (1992)[11], Baird and
3
Horn (1996)[25], Turner et al. (1997)[59], Turner (1998)[14], Horn (2002)[18] and Horn (2006)[19]. Most early studies concentrated on groundwater in sandy beaches, particularly tide-induced fluctuations of the local beach water table, and generally in the cross-shore direction (perpendicularly to the shoreline).
• Shape and elevation of the beach water table response to tidal forcing
A large number of observations describe the shape and elevation of the beach water table in response to tidal forcing at diurnal, semi-diurnal and spring-neap tidal frequencies.
Observations of beach water table behavior show that the water table surface is generally not flat, and that it is asymmetrical (eg: Turner(1993)[12], Raubenheimer et al.(1999)[29], Baird et al.(1998)[26], and Nielsen (1999)[16]).
The propagation of the water table fluctuations is influenced primarily by oscillation frequency, and by vertical flow and capillarity effects. The sloping boundary is responsible for the generation of higher harmonics in the water table oscillations, which have been shown to be stronger in the upper part of the aquifer due to the greater amount of vertical flow in this part of the aquifer (Cartwright et al. (2004b)[64]).
The asymmetry and phase lag between the water table and the tide increase in the landward direction, while the amplitude of the water table oscillations decreases in the landward direction (eg. Baird et al. (1998) [26], Raubenheimer et al. (1999) [29], and Robinson et al. (2005) [32] ).
Measured watertable elevations are generally higher than the tidal elevation (e.g. Nielsen et al. (1988)[72] [19], and Turner et al. (1997) [59]). This overheight increases as the beachface slope and sediment size decrease and as tidal range and wave infiltration increase (Turner et al. (1997) [59]). In general, the elevation of the beach water table increases as the permeability of the beach decreases.
• Shape and elevation of the beach water table response to wave forcing
Wave forcing affects beach groundwater in a number of ways. Time-averaged wave effects contribute to watertable overheight, by two phenomena (e.g: Nielsen and Kang (1995) [67], Kang and Nielsen (1996) [44], and Nielsen (1999) [16] [19]):
• by set-up / raising the mean water surface at the shoreline, and • by run-up / increasing the mean water surface through infiltration.
4
Considering a vertical cross-section perpendicular to the shoreline, hydraulic gradients controlled by wave set-up also drive a general groundwater circulation in the beach (e.g: Li and Barry (2000) [53]).
Run-up of individual waves generates high-frequency water table and pore pressure fluctuations, which have been reported in a number of field experiments (e.g. Turner and Nielsen (1997) [47], Horn et al. (1998) [37], Turner and Masselink (1998) [48], Blewett et al. (2001) [31], Baldock et al. (2001) [83], Butt et al. (2001) [81], Cartwright et al. (2005)[61], and Robinson et al. (2005) [32] ).
High-frequency water table oscillations exhibit a similar asymmetry to that of tidally induced water table fluctuations, with a faster rate of rise than fall (Hegge and Masselink (1991) [30]).The landward propagation of a swash-induced pore pressure wave has been shown to be similar to that of tidally induced groundwater waves, with the amplitude decaying exponentially and the phase lag increasing linearly in the landward direction (Cartwright et al. (2005) [61]).
Waddell (1973) [38] and Waddell (1976) [5]observed that a wave arriving at the base of the beach face induced an instantaneous rise in the beach water table as a result of a “mass pressure flux” through the saturated sediment. In contrast, Hegge and Masselink (1991) [30]found that the water table elevation increased 4–5 seconds after maximum run-up, attributing this lag to the effects of “frictional retardation” on the input swash water. They suggested that the relative importance of pressure vs. swash infiltration is controlled by the location of the exit point, with pressure forces dominating on the saturated beach face seaward of the exit point and infiltration dominating landward of the exit point. Waddell (1976) [5] made a similar suggestion, and also suggested that sediment size will affect pressure transmission through the beach. Nielsen (1997) [13] noted that neither of these studies measured the actual position of the water table, but rather the pressure at some depth, and argued that such measurements cannot determine how the water table (as opposed to the non-hydrostatic pressure at some depth) behaves under unsaturated conditions landward of the run-up limit.
• Spatial evolution of the dominant periods of the beach water table fluctuations Some field evidence also suggests that wave effects can be observed over long time periods. For instance, Nielsen (1999) [16] noted that water table oscillations due to relatively slow changes in wave height (say over several days) propagate further inland than
higher-5
frequency oscillations. Similarly, several authors reported measurements of a beach groundwater pulse which was due to an increase in wave set-up at the shoreline during storms, and which propagated inland into the aquifer (Turner (1998) [14], Cartwright et al. (2004a) [62] , and Cartwright and Nielsen (2004c) [65] [19]).
In the same line of thought, many researchers have noted that the beach acts as a low-pass filter, only allowing the larger or longer period swashes to be transmitted through the beach’s porous matrix. It is observed that both the amplitude and the dominant frequency of the groundwater level spectrum decrease in the landward direction. The further landwards the given groundwater spectrum, the narrower its band and the more it is shifted towards lower frequencies (Lewandowski and Zeidler (1978)[22]).
There is indeed some evidence to suggest that some frequencies are less attenuated than others; however, it is not clear what controls the frequency pass band on a particular beach. Waddell (1980) [6] noted that the deeper the well point, the lower the cut-off frequency of the filter function is. Hegge and Masselink (1991) [30] suggested that the cut-off frequencies of the filter will be a function of tidal stage, hydraulic conductivity, beachface slope and the measurement position relative to the shoreline.
Relatively few studies have reported simultaneous measurements of beach groundwater and swash; here are a few such studies and their main conclusions:
• Hegge and Masselink (1991) [30] compared swash zone run-up and groundwater spectra, which showed a considerable reduction in dominant energy and also a shift in dominant energy towards lower frequencies.
• Turner and Nielsen (1997) [47] noted that although the pore water pressures in the beach clearly responded to wave run-up, these fluctuations had a significantly lower frequency than that of the waves. They also noted that rapid water table fluctuations in the swash zone were more evident on the falling tide than on the rising tide, and highlighted the importance of capillary effects.
• Nielsen and Turner (2000) [68] showed measurements of pore water pressure in the beach with a spectral peak at the frequency of the water table exit point, rather than at other forcing frequencies such as surf zone waves or run-up.
• Cartwright et al. (2005) [61] presented shoreline, exit point, and pore pressure spectra. They showed that the transfer of energy from high-frequency swash forcing to
low-6
frequency groundwater response could be attributed to wave run-up exceedance probabilities relative to the position of the exit point
• Unsaturated zone and capillary fringe of the beach groundwater
The presence of a capillary fringe can have a significant effect on the exchange of water between the ocean and the coastal aquifer, particularly in terms of the storage capacity of the coastal / beach aquifer.
Recent studies have demonstrated that due to hysteretic water retention, capillarity affects water table dynamics over a much wider range of frequencies, including the tidal frequency (e.g. Nielsen and Perrochet (2000a) [69], Nielsen and Perrochet (2000b) [70], and Werner and Lockington (2003) [24]). At higher frequencies, the presence of a capillary fringe will have a significant effect on the dispersion of water table waves. Field and laboratory observations have also shown that natural groundwater waves usually propagate faster and decay more slowly in aquifers with a capillary fringe (eg. Nielsen and Turner (2000) [68], Cartwright et al. (2004a) [62], and Cartwright et al. (2004b) [64] ).
The height of the capillary fringe can be estimated under quasi-static assumptions (not always stated as such). Thus, Turner and Nielsen (1997) [47] gave an expression for the thickness of the capillary fringe within the beach, B, assuming cubic packing of spherical grains of uniform diameter:
(0-1)
where is the surface tension, is the density of the fluid, and D is the mean grain diameter. Atherton et al. (2001) [79] give an expression for the height of capillary rise:
(0-2)
where, is the surface tension, the density of the fluid, the contact angle between water in a pore and the pore side wall (taken to be zero), the mean pore radius and g is acceleration due to gravity. In terms of macroscopic constitutive relationships, using the Van Genuchten Mualem model, Alastal et al. (2010) [50]point out, from earlier work by Ababou (1991) [10], that the mean static capillary height can be defined and calculated as the point of maximum moisture capacity, i.e., the inflexion point of (h), which leads to an explicit expression:
1
1 1
/
7
where “α” is the Van Genuchten pressure scaling parameter (inverse length units), and “n” is the Van Genuchten/Mualem exponent, or shape parameter (“n” is a dimensionless positive real number).
Observations which suggest that horizontal flows may also occur in the capillary zone have been reported (e.g. Atherton et al. (2001) [79], Silliman et al. (2002) [80], Cartwright et al. (2002) [63], Cartwright et al. (2004b) [64]), but the most significant phenomenon is probably the vertical exchanges in that zone under dynamic oscillatory conditions.
• Effects of infiltration and exfiltration
The effects of infiltration and exfiltration are generally invoked to explain why beaches with a low water table tend to accrete, and beaches with a high water table tend to erode.
However, the relative importance of processes such as infiltration losses in the swash, changes in the effective weight of the sediment, and modified shear stress due to boundary layer thinning, are not yet clear. Experimental work on the influence of seepage flows within sediment beds provides conflicting results concerning the effect on bed stability (Horn (2006)[19]).
0.2.2 Modeling of beach groundwater response to tidal & wave forcing
There are also a great number of numerical and analytical models for the investigation of the wave propagation in porous media, including the case of a vertical porous boundary (eg. Dominick et al. (1971) [40] ) and a sloping porous boundary as occurs for a bach (eg. Nielsen (1990) [9] ).
In unconfined aquifers, the dynamics of the water table will be influenced by the capillary fringe for all but the coarsest sands and gravel. Most existing models rely on the Dupuit-Boussinesq equation (Chapter 1, for more details) for plane flow, in 1D across the shore (e.g. Nielsen (1990) [9], Baird et al. (1998) [26], Raubenheimer et al. (1999) [29], Song et al., (2007) [92]) and sometimes also in the 2D horizontal plane (e.g. Li et al. (1996) [54], and Li et al. (1997b) [56]). In all these cases, one considers only saturated flow and ignores the unsaturated zone and its capillary effects. Therefore, according to these models, high-frequency forcing does not induce water table fluctuations to any appreciable distance inland, a result which is contradicted by field observations (Li et al. (1997a) [58]).
Many other authors have attempted to capture the effects of the capillary fringe on beach groundwater dynamics based on the Green and Ampt (1911) [86] piston flow approximation,
8
which assume that the capillary fringe is completely saturated with a constant suction head at the top. Parlange and Brutsaert (1987) [49] added a correction term to the Boussinesq equation to account for the mass transfer of water across the moving watertable due to capillarity. Barry et al. (1996) [25] used this modified Boussinesq equation to investigate the propagation of small amplitude oscillations, and showed that the influence of the capillary fringe increases with oscillation frequency. Li et al. (1997a) [58] derived a dispersion relation including the effects of both finite aquifer depth and capillarity. Their model simulated 2D horizontal saturated flow and included capillary effects through the free-surface boundary condition. They investigated the influence of wave run-up on coastal aquifers and showed that capillary effects are important for high-frequency oscillations and provide the mechanism for high-frequency groundwater waves. Without the capillary correction term, the model was unable to reproduce the propagation of high-frequency watertable waves which has been observed in the field.
Li et al. (2000a) [57] incorporated capillary effects based on the Green and Ampt (1911) [86] piston flow approximation into the intermediate depth groundwater wave equations of Nielsen et al. (1997) [71] to derive a new groundwater wave equation :
(0-3)
where B is the thickness of the capillary fringe, h is the watertable elevation, s is specific yield, d is aquifer depth, K is hydraulic conductivity, t is time and x is horizontal distance. The first term includes the effects of vertical flows. The second term in the right-side of this equation accounts for the apparent water exchange between the capillary fringe and the aquifer that occurs when the water table fluctuates (Li et al. (1997a) [58] ). Comparison of their dispersion relation with a capillary term of Nielsen et al. (1997) [71] demonstrated the importance of capillarity for high-frequency oscillations, exhibiting a more realistic representation of high-frequency watertable oscillations as observed in the field by Kang et al. (1994) [52]. Their simulations showed that vertical flow effects reduces as aquifer depth decreases, and that wave damping at high frequencies is sensitive to the thickness of the capillary fringe.
In order to obtain an analytical solution, Li et al. (2000a) [57] assumed a vertical interface with a uniform head fluctuation; however, they noted that their ground water wave equation could be applied to a sloping beach with swash motion, in which case a moving boundary is involved and numerical solutions are required.
9
Nielsen and Perrochet (2000a) [69], and Nielsen and Perrochet (2000b) [70] incorporated a simplified description of the capillary fringe in the watertable equations, in order to express the change in total moisture (water table and capillary fringe) in terms of derivatives of the water table height only. They introduced the concept of the complex effective porosity, ne, to account for the observed damping and lag of oscillations in the total moisture compared to those in the watertable alone. They defined the complex effective porosity (nE) as follows:
(0-4)
where n is the drainable porosity (specific yield), h is water table elevation and htot is the equivalent saturated height of the total moisture (the sum of the water table height and the thickness of the capillary fringe). This term (nE) accounts mathematically for damping of
fluctuations in the total moisture through its magnitude and for phase lag through its argument. In studies of simple harmonic forcing in a sand column, Nielsen and Perrochet (2000a) [69], and Nielsen and Perrochet (2000b) [70] found that the complex effective porosity (nE) was a constant for a given sediment at a given compaction. They also showed
that the thickness of the capillary fringe varied nearly as much as the water table height. Nielsen and Turner (2000) [68] extended the work of Nielsen and Perrochet (2000a) [69], and Nielsen and Perrochet (2000b) [70] to consider the case of simple harmonic oscillations and a wider range of sediment sizes, and obtained an empirical expression for the complex effective porosity
⁄ (0-5)
where is the drainable porosity (specific yield), is the angular frequency, is the height of the capillary fringe obtained from measurements, K is the hydraulic conductivity, and C is an empirical constant (C=2 in Nielsen and Turner (2000) [68], C=2.5 in Cartwright et al. (2002) [63], Cartwright et al. (2004b) [64], and Cartwright et al. (2005) [61]). Eq. (0-5) indicates that the influence of the capillary fringe is reduced for coarse sand and long forcing periods. Nielsen and Turner (2000) [68] noted that Eq. (0-5) is only valid when the capillary fringe is well below the sand surface and suggested when the capillary fringe is close to the sand surface, the flexing of meniscuses may be what determines the effective porosity of the beach.
Cartwright et al. (2004b) [64] considered the effect of a truncated capillary fringe (where the capillary fringe intersects the sand surface) on the dispersion of water table waves. They
10
investigated the extent to which truncation of the capillary fringe limits moisture exchange under periodic forcing via sand column experiments, and showed that the complex effective porosity was significantly reduced with increasing truncation, by up to a factor of 4. These results showed that truncation effects only became apparent when the distance between the sand surface and the maximum water table elevation was approximately half the height of the capillary fringe. When the sand surface is above the region of saturated moisture, there was no measurable effect of the sand surface on the water table oscillations. However, once the sand surface began to truncate the tension-saturated zone of the capillary fringe, there was a rapid decrease in the magnitude and argument of the complex effective porosity until a point where the sand surface equalled the maximum driving head elevation and the magnitude of the frequency response almost reached unity.
Cartwright et al. (2005) [61] presented simultaneous measurements of shoreline location, exit point location and pore pressure response, which they showed to be influenced by the presence of a capillary fringe. They used the parameter derived by Cartwright et al. (2004b) [64] to represent the reduction in aquifer storage due to both the effects of capillarity and the truncation of the capillary fringe by the sand surface. They compared the predictions of Turner's (1993b) [12] exit point model to their field measurements and showed that the inclusion of capillary effects improved the agreement between measured and predicted exit point location. They concluded that further work is needed to quantify the reduction in aquifer storage in terms of measurable aquifer parameters, and to allow for the dependence of the exit point (and of pore pressure dynamics) on shoreline proximity.
The use of the complex effective porosity does not give any information on the dynamics of the moisture distribution above the water table. It is clear that an improved understanding of processes in the capillary zone is essential for modeling moisture exchange in beaches, particularly in the swash zone. Any model which does not consider capillarity will create a large local hydraulic head gradient during wave run-up, leading to overestimation of infiltration (Li et al. (1999) [55]). Infiltration and/or exfiltration on a beach will be influenced by both the input of water from wave run-up and the ability of the sediment to take in water (hydraulic conductivity, specific yield and moisture content), which will be affected by the presence of a capillary fringe.
Both modeling and experimental work indicates that the hydraulic conductivity of the beach is a critical parameter. However, hydraulic conductivity varies both spatially and temporally on beaches, particularly on gravel and mixed sand and gravel beaches. Another important, but
11
poorly understood, consideration in beach groundwater studies is the role of air encapsulation during the wetting of beach sand.
Improved predictions of swash zone sediment transport and beach profile evolution cannot be achieved unless the complex fluid and sediment interactions between the surface flow and the beach groundwater are better understood, particularly the sensitivity of sediment transport processes to flow perpendicular to the permeable bed. Important research questions remain to be answered on the role of the capillary fringe in swash /watertable interaction:
• nature of periodic fluctuations in the capillary fringe, both vertical and horizontal; beach groundwater recharge landward of the run-up limit;
• variability of hydraulic conductivity and moisture content/air entrapment, especially on mixed beaches;
• effects of pressure gradients in the swash zone;
• and the effects of infiltration/exfiltration on swash sediment transport, particularly on coarse-grained beaches.
Most of the models require validation against laboratory and field data, particularly those on beach groundwater response to wave forcing and the effects of infiltration/exfiltration. The latter, in particular, are based on theory which needs to be verified. This will require careful laboratory experiments under realistic flow conditions and over a wide range of sediment sizes in order to determine the effect of seepage flows on sediment entrainment and transport. Direct measurements of key parameters such as hydraulic conductivity and moisture content need alos to be carried out in the field and more direct field measurements of infiltration rates are also required (Horn, 2006 [19]).
0.2.3. Other review on topics of interests
Water level dynamics in other porous bodies (other than sand beaches)
We have also reviewed the literature about ground water level variations in other contexts. For instance, in the sloping banks of large dam lakes, we have reviewed several papers focused on the groundwater response to high amplitude variations of water levels due to dam operations (particularly in the Chinese literature, eg. Feng et al. (2006) [87]; Mo et al. (2006)[88]).
Another case of interest is the case of wave propagation and damping through wave breakers (coarse dykes) in harbour engineering. These cases are all relevant to our work. For
12
instance, concerning the sudden variation of water level, see the imbibition experiment in a dry sandbox (studied in Chapter 3).
Concerning the damping of waves through a porous dyke, see the small wave canal experiment with an inserted vertical sandbox (Chapter 4). In fact, in the literature, problems of reflection and transmission of water waves through porous structures have been studied by the application of the eigenfunction expansion method (e.g., Sollitt and Cross (1972) [51], Dalrymple et al. (1991) [35], Yu and Chwang (1994) [89], Chwang and Chan (1998) [82], Chan and Lee (2001) [27], and Azhar et al. (2008)[28]). To calculate the porous medium flow, either Darcy’s law (e.g., Chwang and Chan (1998) [82]) or Forchheimer’s law (e.g., Dalrymple et al. (1991) [35], Azhar et al. (2008) [28]) has been used, but without considering the capillary effects that may occur in the unsaturated zone of the porous media.
Oscillations and wave propagation analyses based on the Richards equation
We have reviewed above quite extensively a number of analyses on the effects of oscillatory forcing on free surface groundwater flow based on Dupuit-Boussinesq models with or without an additional capillary fringe submodel (Green and Ampt (1911) [86]).
However, other authors have studied directly unsaturated flow under oscillatory conditions. We only cite here two works that have been developed at IMFT.
The first one (Trégarot (2000) [17], Chap.4) consists in a linearized analyzis of the response of an unsaturated soil column to an oscillatory unsaturated flux imposed at the surface of the column. Damping, phase lag, and wavelength are analyzed mathematically in terms of soil parameters as a function of input frequency (based on earlier unpublished work by Ababou). In addition, the linearized solution is compared to nonlinear simulations of oscillating pressure profiles based on the Richards equation.
The second one is a more recent work by Alastal et al. (2010) [50]. They analyze the response of a partially saturated soil column to a pressure wave input at the bottom of the column. Phase lags due to both saturated and unsaturated zone dynamics are being studied (work in progress).
Coupling Navier-Stokes (or other hydrodynamics) with porous media flow
Coupling Navier-Stokes (or other related hydrodynamics equations) with the Darcy-based porous media flow equations is an important topic to solve the real hydrodynamic problem which occurs in an interface such as sea/beach and river/bank. However, in this work, we will
13
be using a different approach from a “porous medium perspective”. Indeed, the approach to be implemented in this work (Chapter 7) will be based on generalizing the Richards porous media equation in order to include open water zones in the computational domain, rather than using Navier-Stokes based equations.
However, it is recognized that a different approach based on Navier-Stokes might be worthy of consideration, if properly adapted or coupled to porous media hydrodynamics. In order to make progress in this area, research has focused on establishing consistant interface conditions between open water (Navier-Stokes) and porous media (Darcy) domains, such as the Beavers-Joseph interface conditions [91]. This topic will not be pursued further in this work.
Hydro-mechanical coupling and fluid-solid interactions
There are various types of hydro-mecanical coupling and fluid-solid interactions involved in the problems of interest for this thesis work, namely, harbor engineering, beach hydrodynamics (and morphodynamics), and also, estuaries, river banks, and dam lake embankments. In all these cases, fluid-solid interactions take place.
Briefly, two types of cases might be considered, as follows. First, for unconsolidated granular porous media, the changing regime of surface water flow can impact on erosion/deposition processes (beach swash zone); however, subsurface flow also can generate internal erosion and thus, create new flow pathways. Secondly, when porous media are consolidated, pore pressure and/or capillary pressure variations can lead to significant changes in the effective stress, which can have effects on cohesion and on failure mechanisms (rock falls, landslides, collapse of a dyke). This thesis is focused on the hydraulics aspects only, but it is clear that the mechanical consequences of internal pressure fluctuations and water level fluctuations are of great interest for applications and can lead to forgoing work.
Signal analyzis and processing of water levels and pressure time series
In this thesis, we rely on mathematical and statistical methods for analyzing highly variable signals, in particular the water level signals H(xi,t) obtained from experimental measurements
(Chapter 5 and Chapter 6, for more details).
For this sake, multiresolution wavelet analyzis, as well as correlation function and spectral density function have been used. The wavelet concept can be applied to any signal, while the correlation/spectrum concepts are well defined only for statistically stationary random processes. However, note that sometimes the the water level signals have been prefiltered, and
14
the correlation/spectral analyses have been applied only to their residuals. The soundness of our moving average filter (and the choice of window width) has also been tested by comparing it to the result obtained from wavelet orthogonal decomposition into approximation+residual.
The software tools used in this thesis were originally developed in the form of MATLAB
Toolboxes in a previous thesis at IMFT (Fatmi (2009) [21]) for application to the analyzis of pore pressure and atmospheric pressure signals in a hydrogeologic site (Fatmi et al. (2008) [43]). For the present work, they have been adapted and re-interpreted some of these tools for these specific purposes (sometimes in collaboration with H. Fatmi). For completeness, we provide an upgraded version of the corresponding signal analyzis theory in Appendix B9.
0.3 Outline of the thesis
After this introductory chapter, the rest of the thesis is structured sequentially into eight chapters regrouped in three main parts, plus appendices, as follows:
First, note that the APPENDICES include not only classical appendices for each chapter (Appendices A), but also, additional chapters labeled Chapter B9 to Chapter B12 which contain additional results and details on signal analyses and simulations of the Barcelona wave canal (they can be skipped on first reading).
Let us now summarize briefly the contents of each part and each chapter.
PART I (Chapters 1-2): Governing equations & constitutive relations for porous media
Chapter 1 presents the governing equations and the constitutive relations for partially saturated or unsaturated porous media.
Chapter 2 defines the numerical procedures in the plane flow Dupuit-Boussinesq model and in the 3D partially saturated Richards model, taking into account time-varying boundary conditions in both models.
PART II(Chapter 3): Modeling of non-oscillatory flows in porous media
Chapter 3 describes numerical simulations with the Richards unsaturated flow model using the VGM (Van Genuchten / Mualem) model for conductivity and moisture curves versus pressure. The parameters of the VGM model are manually calibrated (fitted) with the results of the imbibition experiment conducted at IMFT (sudden imbibition or wetting of a dry sandbox). On the other hand, the linearized analytical solution of the Dupuit-Boussinesq
15
equation for the sudden discharge problem is validated by numerical simulations with Dupuit-Boussinesq equations, and these are also compared with the more complete Richards model.
PART III (Chapters 4-7): Modeling of oscillatory flows in porous media
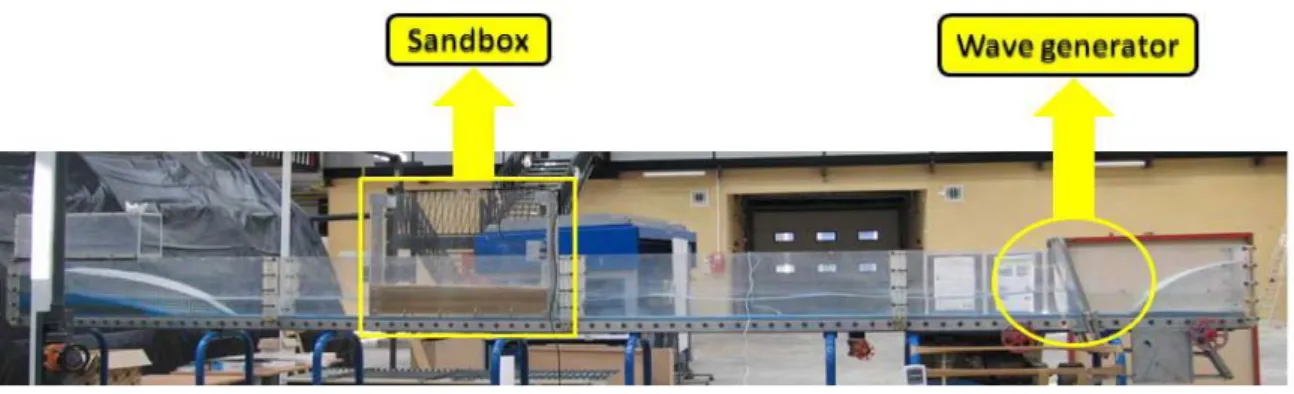
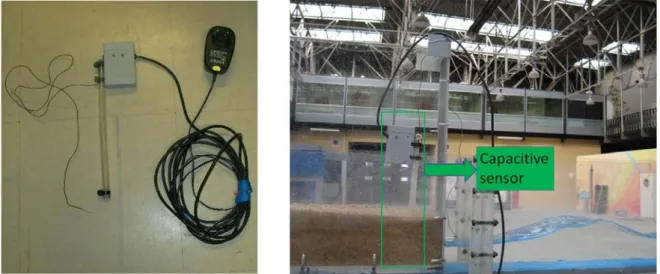
In Chapter 4, we describe a lab experiment with a vertical sandbox in a small wave canal (IMFT). We study the transmission of oscillations through the sandbox, experimentally with water level sensors, and numerically with the Dupuit-Boussinesq plane flow model. We also analyze linearized solutions of the Dupuit-Boussinesq equation and use them to interpet the experimental observations (damping). This experiment was also useful to test piezometric water level sensors for the measurements of water level fluctuations in sand (see next experiment in the Barcelona long wave canal).
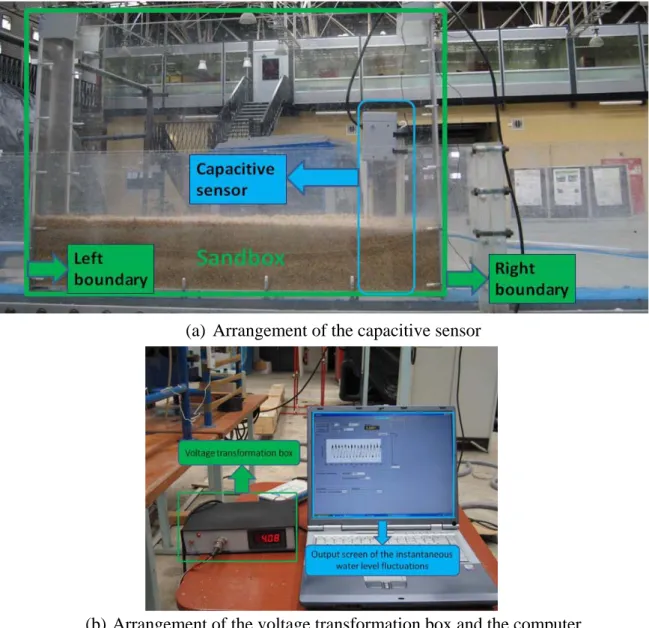
Chapter 5 describes the experimental set up of the long wave canal (HYDRALAB,
Barcelona), including a presentation of the water level measurements in the sloping sandy beach. The water level signals H(x,t) are presented, and their space-time characteristics are simply described (preliminary analyses). This chapter also serves as an introduction to the theories of the signal processing methods that will be used to analyze water level fluctuations.
Note. Theoretical aspects of signal processing are developed in more detail in the appended
Appendix B9. In addition, more details on the water level signals recorded at different distances from
the “coast line” are presented in the appended Appendix B10, comparing the entry water level near the “coast line” to the “pure groundwater” level fluctuation further away from the “coast”. In Chapter 6, the measured water level fluctuations in the sloping sandy beach of the Barcelona wave canal are analyzed and interpreted via signal processing techniques, based on prefiltering techniques (e.g. moving averages) and three types of methods: Fourier spectra versus frequency; multi-resolution wavelet analyses; and temporal correlation and cross-correlation functions versus lag times. Cross-analyses involve pairs of signals (Hi(t),Hj(t)) sampled at two positions in space perpendicular to the shoreline (xi,xj).
In Chapter 7, the wave propagation process in the sloping sandy beach of the Barcelona
wave canal experiment is modeled numerically using the 3D Richards flow model in a vertical cross-section comprising both the “microporous” sand and the supposedly “macroporous” open water zone (swash zone above the sand beach). The partially saturated / unsaturated flow experiments are calibrated using the VGM parameter model, and also the Exponential parameter model, for the unsaturated conductivity and moisture-pressure curves K(h) and θ(h). In addition, the simpler Dupuit-Boussinesq plane flow model is also briefly tested for comparison. This chapter leads not only to a re-interpretation of the observed
16
experimental groundwater fluctuations, but also, to an evaluation of the numerical approach to coupled open water / porous media hydrodynamics.
Note. In addition, Appendix B11 and B12 present simulations of wave propagation in the sloping sandy beach under simpler wave input that those measured, in order to provide some more insights into the process. Thus, a single harmonic wave was forced at the beach entry during one period
(Appendix B11) and during several wave periods (“continuous wave test” in Appendix B12).
Finally, Chapter 8 summarizes the main conclusions and the outlook for future research.
Note: some parts of this work were published and presented earlier in Wang et al. (2008) [90],
Wang et al. (2008) [93], Wang et al. (2010) [94], and some other parts of this work have been submitted more recently for publication.
17