Progress and Challenges in the
Results of a Global Survey
Urban Governance of Climate Change
Massachusetts Institute of Technology – Department of Urban Studies and Planning
Alexander Aylett, Banting Postdoctoral Fellow in Urban Climate Change Governance
Acknowledgements
I am grateful to the many ICLEI member communities and local government representatives who generously gave their time to participate in this survey. Without their willingness to share their experiences and expertise this research would not have been possible. Many ICLEI staff had a hand in making this project a success. I would particularly like to thank Richard Simpson, Alice Balbo, and Laura Kavanaugh for helping to facilitate communication and coordination within ICLEI during the various stages of this project. Additional thanks goes to the ICLEI World Secretariat for supporting this project, and to staff from regional secretariats for reviewing translations, providing feedback on the survey instrument, and helping to disseminate information on the survey to their members. I would also like to thank John Robinson, Harriet Bulkeley, and Sarah Burch for their input into the early stages of the survey instrument. Finally, I would like to extend a deep expression of gratitude to JoAnn Carmin for her support throughout this research. The impact of her guidance, and of her own research, is visible throughout these pages.
This research was funded through a Banting Postdoctoral Fellowship.
Recommended Citation
Aylett, Alexander. 2014. Progress and Challenges in the Urban Governance of Climate Change: Results of a Global Survey. Cambridge, MA: MIT.
© 2014 Alexander Aylett
Cover photo: Grant Robinson, Montage Maker
Report layout and infographics by Christopher Rhie / christopherrhie.com
Contents
Credits ... 2
Executive Summary ... 4
I. Introduction: Objectives and Methodology... 8
II. Local Government Responses to Climate Change: A Global Overview of Planning and Action ... 12
III. Motivations, Synergies, and Competing Priorities ... 22
IV. Institutional Structures and Integration ... 28
V. Challenges in Planning and Implementation ... 40
VI. External Partners: Civil Society & Private Sector Engagement ... 48
VII. Enablers of Planning and Implementation... 54
VIII. Summary and Conclusions... 62
Executive Summary
Urban responses to climate change are entering their third decade. The potential for cities to lead in the field is now widely recognized. Efforts that began with a narrow focus on energy efficiency and mitigation are becoming increasingly ambitious, and have also expanded to include adaptation. Simultaneously, cities are moving climate change out of a narrowly environmental silo and attempting to mainstream it across the municipal bureaucracy. Some are also involving civil-society and private actors in climate planning and implementation. But important barriers remain. Current understandings of these issues are based on a variety of case study and best-practice literatures that provide detailed insights into specific localities, but are unable to identify regional and global trends. To gain access to this broader perspective, a survey was conducted among over 700 communities that are members of ICLEI – Local Governments for Sustainability. This survey explored the state of adaptation and mitigation planning globally, the challenges cities are facing, and the way that networks connecting multiple different players (municipal, community-based, and business) influence how climate policies are designed and implemented. A total of 350 cities (48%) responded to the 69 question survey. The majority of respondents were from the United States where ICLEI has its largest membership.
Local Responses to Climate Change
In total 75% of cities worldwide report that they are engaging with both adaptation and mitigation. Just under 24% are focused
exclusively on mitigation. The United States is the one notable exception, with 58% of cities reporting that they engage with both adaptation and mitigation, and the highest percentage of cities conducting only mitigation planning (41%). Rather than producing isolated climate change plans, cities report that they are increasingly building climate change into other local government plans (i.e. sectoral, long range, or sustainable development plans). Canadian cities have made the most progress in this direction, while African and American cities report the lowest rates of integrating climate change into other municipal plans.
Eighty-five percent of cities worldwide have conducted an inventory of local greenhouse gas emissions. An ambitious minority (15%) are including in their inventories some portion of the upstream emissions related to the goods and services consumed within the city. Seventy percent of cities report that their mitigation efforts have produced measurable emissions reductions. The most common areas where local governments reduce emissions are those under their direct control (i.e. local government buildings and vehicle fleets). The least common are reductions made in emissions coming from the private sector, with only 23% of cities reporting reductions among local businesses.
Motivations and Competing Priorities
The top three motivations that cities report for initiating climate change mitigation planning are: to demonstrate leadership globally, nationally, or regionally (66%); to promote sustainable
urban development more generally (57%); and to improve community quality of life (53%). Forty percent report being motivated by an understanding of local climate related risks. Local responses to climate change must function within the broader context of multiple other development priorities. There is a growing literature on the potential synergies between climate change policies and other urban development goals, but examples of this in practice appear to be rare. Respondents report that mitigation policies contribute little or nothing to their ability to meet goals in other areas. The two exceptions to this are priorities related to increasing local sustainability, and increasing access to basic services which are both seen to work in synergy with mitigation programs. Africa was the only region where a large percentage of cities (100%) report mitigation programs make important contribution to meeting local economic goals.
Urban Climate Change Planning
Globally, 63% of cities report that they have between 1 and 5 staff members whose core responsibility is climate change planning. North American cities are the most likely to report having only one staff member. Sixty-one percent of cities report that their mitigation plans are created with regular input by other municipal agencies throughout the planning process. The two exceptions to this are Africa and Asia, where a majority of cities report carrying out mitigation planning in an isolated fashion (64% and 51% respectively). The agencies that contribute most heavily are those responsible for environmental planning, land-use planning, solid waste management, water, and transportation. Those that contribute the least are the locally operated electrical utility (where these exist), and the agencies responsible for health, and
economic development.
Challenges in Planning and Implementation
Cities report that their climate change planning and implementation work faces multiple significant challenges. Foremost among these are financial challenges. A lack of funding for implementing projects and programs is a significant challenge for 78% of cities. A lack of funding to hire sufficient staff to work on climate change affects 67% of cities.
Competing priorities (in areas such as health, nutrition, housing, sanitation, and economic growth) are the second most significant challenge experienced by cities (76%). As cities work to integrate climate change planning across municipal agencies, many also report important difficulties incorporating climate change into existing departmental functions and procedures. Encouragingly though, few cities cite a lack of leadership from mayors, senior officials, and other levels of government as important barriers to their climate change work. The main exception to this are Canadian cities, which report the highest rates of being affected by a lack of strong leadership from senior management (53%) and from regional or national government (73%).
External Partners
Civil society and private sector groups can play an important role in helping design and implement local responses to climate change. Cities report that civil society groups are already acting as valuable partners in urban responses to climate change. Fifty-seven percent report that these groups have lobbied government for strong climate change action, and 55% report that they are actively engaged in provided input into local government climate
change policy making. On these and other metrics of engagement the private sector trails far behind. Only 26% of cities, for example, report that the private sector has actively engaged with local climate change planning. Rather than strong opposition, results here point to a more neutral disengagement with the issue of climate change on the part of local business and industry.
Enablers of Planning and Implementation
The top three factors that enable local governments to design and implement their mitigation strategies are: (1) leadership from the mayor or senior elected officials; (2) leadership from senior management, and; (3) support from various types of local government networks (such as ICLEI). The next three most important enablers all relate to obtaining adequate funding for climate change programs, and staff. Access to information on local emissions and the local impacts of climate change are also signaled as important enablers by 40% and 32% of cities, respectively.
Conclusions
The survey results show both the evolution of urban responses to climate change and the significant challenges that cities still have before them. Cities are pursuing climate change planning in an integrated fashion and mainstreaming it across local government agencies. They are conducting their planning in a collaborative manner, enabled by strong leadership and support from local government networks.
Simultaneously, the strongest cross-cutting finding in the survey is the lack of engagement of economic actors (both public and private) in urban responses to climate change. What cities can
accomplish will necessarily be limited if they do not effectively connect economic and environmental priorities, and actively incorporate economic actors into local networks of urban climate governance. The lack of synergies in this area is the most severe example of a general inability to effectively link mitigation policies to other local development priorities. Finally, many cities have yet to build strong partnerships with the civil-society and private sectors. Addressing these issues may help cities reduce the impact of the limited financial and human resources available to address climate change.
Introduction: Objectives and Methodology
Urban responses to climate change are entering their third decade. The potential for cities to lead in the field is now widely recognized. Initially narrow efforts focused on energy efficiency and mitigation are becoming increasingly ambitious, and have expanded to include adaptation. Simultaneously, cities are moving climate change out of a narrowly environmental silo and attempting to mainstream it across the municipal bureaucracy. Some are also involving civil-society and private actors in climate planning and implementation.
But important barriers remain. Current understandings of these issues are based on a variety of case study and best-practice literature that provides detailed insights into specific localities, but is unable to identify regional and global trends. To gain access to this broader perspective, a survey was conducted among over 700 communities that are members of ICLEI – Local Governments for Sustainability. This is the first systematic study of this scale to look at how cities are approaching climate change planning and implementation. It provides an overview of who is involved in addressing climate change, what measures they are taking, what barriers they are facing, and how they are resolving them. It also explores how climate change work overlaps with other local government priorities and responsibilities. The study covers both adaptation and mitigation efforts. Mitigation receives proportionally more attention in order to compliment an earlier adaptation-focused report, also released in collaboration with ICLEI (see Carmin, Nadkarni, and Rhie 2012).
This report summarizes key findings that arose from the survey. It describes how ICLEI members are approaching climate change planning and implementation, the types of governance structures they have put in place, their accomplishments and challenges to date, and key enablers of their work. It also highlights areas where increased attention and support could allow them to be more efficient and effective in their responses to climate change.
Governance and Local Responses to Climate Change
Urban areas occupy a unique space in terms of the causes and the impacts of climate change. Cities are responsible for between 30% to 70% of global greenhouse gas emissions (Satterthwaite 2008) and consume roughly 60% of the world’s energy (van der Hoeven 2012). At the same time, the projected impacts of climate change show that urban populations and infrastructure around the world are at significant risk (Carmin, Nadkarni, and Rhie 2012, Hunt and Watkiss 2011, IPCC 2014). As a result, local governments have emerged as important players in global efforts to mitigate greenhouse gas emissions and to enact adaptive policies to protect both people and assets.
Often beginning with low-hanging fruit like increasing the energy efficiency of local government assets, many cities are now aiming to reduce a broad array of emissions linked to transportation, urban form, residential and private buildings, and waste management. In addition to work on mitigation, cities are now also putting in place adaptation plans aiming to protect residents and urban
infrastructure from the impacts of climate change. Rather than producing single isolated plans, they are also mainstreaming their climate change work into plans across the various agencies that govern, build, and maintain our urban spaces.
This is a significant shift. Rather than the regulation of climate change by a single local government agency, we are seeing governmental and non-governmental actors working together within broad networks of urban climate change governance (Aylett 2011, Brownill & Carpenter 2009, Bulkeley 2010). This is a response to the fact that both emissions and vulnerabilities are distributed across the urban landscape in a way that makes it impossible for effective responses to be based on the isolated work of any one group or agency.
Understanding how these networks of governance function – and how they could function more effectively – means paying attention to processes of institutional design, alliance building, collective innovation, and collaborative implementation. The internal dynamics within and between municipal agencies can have a determining impact on local transitions to more resilient low-carbon cities (Roberts 2008). Key as well are the contributions made by other scales of government, civil-society groups, and the private sector (Aylett 2013, Bulkeley et al. 2011, While et al. 2004).
Governance and Resilience
This governance-focused approach to understanding local responses to climate change is also central to discussions of urban resilience. In the context of climate change, urban resilience refers to the ability of urban systems to withstand,
adapt to, and recover from climate related hazards. This applies to social and institutional systems, as much as to the brick and steel of urban infrastructure. Increasing the disaster-resistance of transportation or energy systems, for example, is crucial. But so too is increasing the ability of urban institutions and networks of governance to practice adaptive management, integrate new ideas, support innovation, and coordinate active collaborations between different stakeholders (Evans 2011, Folke 2006, Leichenko 2011, World Bank 2009). These socio-institutional factors increase urban resilience by broadening the base of information and resources available to plan for and respond to disturbances, enhancing governance systems by expanding and strengthening collaborative relationships between different actors, and increasing the flexibility of established systems to create and test new ideas and policies.
Survey Methodology
In the spring of 2013 a survey was sent to communities around the world that were currently members of ICLEI – Local Governments for Sustainability. The survey questionnaire was composed of 69 questions divided into 6 sections: (1) basic characteristics of local government climate change initiatives; (2) institutional structures for addressing climate change; (3) the mainstreaming of climate change; (4) challenges to planning and implementation; (5) engagement of non-governmental and non-local groups with planning and action, and; (6) location characteristics.
The survey questionnaire was reviewed for content and clarity by ICLEI staff members in Europe, Africa, and Asia, and urban climate change researchers in North America and Europe. The final questionnaire was translated into French, Spanish, and Korean.
ICLEI members around the world were then invited to participate in the survey. All direct communication with respondents was conducted by e-mail, with supporting publicity for the survey included in ICLEI’s iNews newsletter. First contact was initiated with an introductory e-mail explaining the aims of the research and containing a link to the on-line survey. This e-mail also offered respondents the opportunity to receive the survey as a document, and to opt-out of future e-mails. Non-respondents, or respondents who had only completed a portion of the survey, were sent reminder e-mails at two-week intervals, as well as 72 and 24 hours before the on-line survey closed. As an additional incentive to complete the survey, respondents were entered into a draw for one of three tablet computers. These communications were carried out in English, French, Spanish, or Korean, according to the language that was most commonly spoken in the destination country.
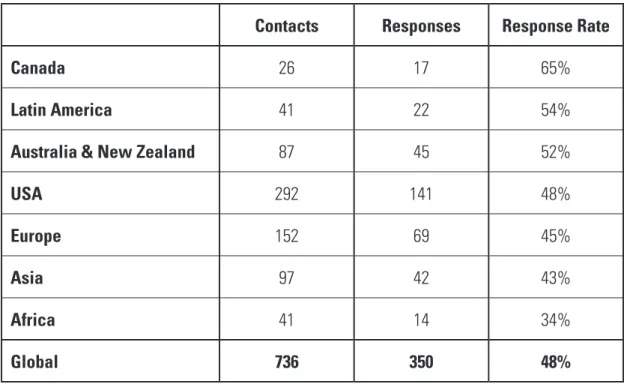
After correcting for inaccurate contact information and removing ICLEI members who were not representative of local governments (regional associations for example), 736 communities received an invitation to participate in the survey. In total 350 (48%) of these responded to the survey, and 264 (36%) completed the entire survey. American cities account for the largest number of survey responses (in line with the large number of ICLEI members in the USA); they were followed by cities in Europe, Australia and New Zealand, Asia, Latin America, Canada, and Africa (see Table 1). Response rates were highest in Canada, followed by Latin America, Australia & New Zealand, the United States, Europe, Asia, and Africa.
---Notes on the text: In the results presented below all percentages
have been rounded to the nearest percentage point. This research covers both adaptation and mitigation. These are referred to individually when specific results apply only to one or the other. To avoid repetition, I have used to phrases “climate change planning” to denote both adaptation and mitigation together.
TABLE 1 | NUMBER OF SURVEY RESPONSES AND RESPONSE RATES BY REGION
Contacts Responses Response Rate
Canada 26 17 65%
Latin America 41 22 54%
Australia & New Zealand 87 45 52%
USA 292 141 48%
Europe 152 69 45%
Asia 97 42 43%
Africa 41 14 34%
Local Government Responses to Climate Change:
A Global Overview of Planning and Action
After more than two decades of work on urban climate mitigation, there is still no accepted common metric to gauge the scope and scale of urban mitigation plans and actions. To provide a clear picture of the current state of urban mitigation efforts, the survey asked respondents a series of questions covering the defining aspects of their plans and actions. This included information on the scope and frequency of emissions inventories; the type, number, and institutional location of climate relevant plans; the areas where local governments have made measurable emissions reductions; and the history and evolution of climate change planning in the municipality. It also engaged with the way in which cities view the relationship between adaptation and mitigation. Taken together these responses create a detailed portrait of the current state of local responses to climate change.
The Focus of Local Responses to Climate Change: Mitigation & Adaptation
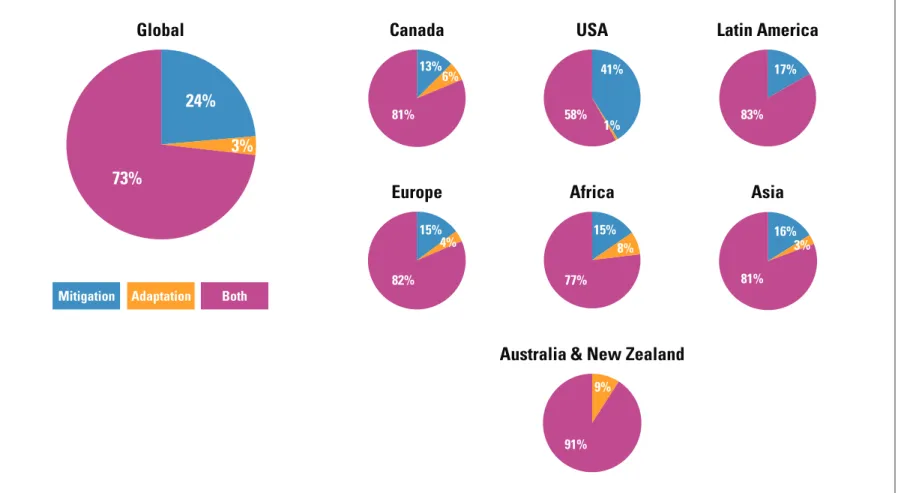
The survey asked respondents to identify the focus of their local government’s engagement with climate change. In total 73% of respondents stated that their engagement was focused on both adaptation and mitigation. Just under 24% reported a focus solely on mitigation, and only 3% reported that engagement was focused on adaptation. Looked at regionally we see a generally stable level of performance in terms of the number of cities conducting both adaptation and mitigation planning, as can be seen in Figure 1. Australia and New Zealand lead (91%), followed by Europe (82%), Canada (81%), Asia (81%), and Africa (77%).
The one area where there is a stark difference is in the United States, where only 58% of cities report engaging with both adaptation and mitigation. The United States is also the country with the highest percentage of cities conducting only mitigation planning (41%).
When asked about the relationship between adaptation and mitigation planning, 92% of respondents report treating the issues in an integrated way that takes into consideration the synergies and conflicts between planning in the two areas. The overall picture that emerges from these responses is of a strong majority of cities engaging with both adaptation and mitigation, and conducting their planning in these areas in an integrated fashion. This calls attention to how rapidly adaptation planning has come to establish itself in a policy space previously dominated by mitigation plans.
Integration of Climate Change Plans Across Local Government Planning
To better understand how local governments are carrying out climate change planning (for both adaptation and mitigation), respondents were asked to select from a variety of options describing the position of climate related plans in relation to other local governments plans (i.e. sectoral, long range, or sustainable development plans). Respondents were asked this question for their current climate change plans, as well as for the first climate change plans produced by their local government. Recognizing that
local governments may conduct climate change planning in more than one area within local government structures, respondents were able to signal all areas where they had mitigation or adaptation plans. A city may have, for example, a plan focused
specifically on climate mitigation and also have included climate change as a planning variable within their spatial development plan.
FIGURE 1 | FOCUS OF CLIMATE CHANGE PLANNING AND ACTION
Global Canada USA Latin America
Europe
Australia & New Zealand
Both Adaptation 73% 24% 13% 6% 81% 3% Mitigation Africa Asia 82% 77% 8% 15% 15% 91% 9% 4% 1% 41% 17% 16% 58% 83% 81% 3%
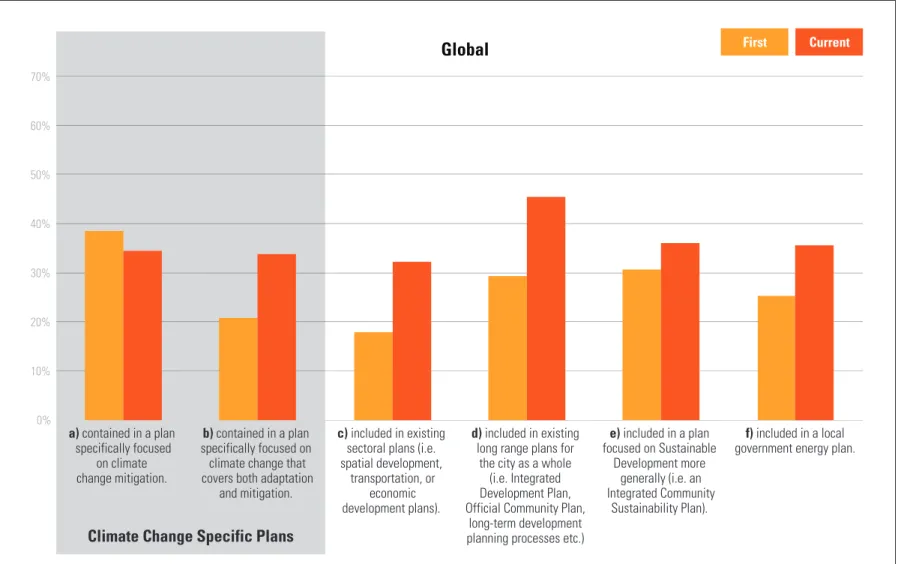
FIGURE 2 | CLIMAGE CHANGE PLANS: FIRST AND CURRENT MITIGATION PLANS COMPARED
Current First
Climate Change Specific Plans
Global 0% 10% 20% 30% 40% 50% 60% 70% a) contained in a plan specifically focused on climate change mitigation. b) contained in a plan specifically focused on climate change that covers both adaptation
and mitigation.
c) included in existing
sectoral plans (i.e. spatial development,
transportation, or economic development plans).
d) included in existing
long range plans for the city as a whole
(i.e. Integrated Development Plan, Official Community Plan,
long-term development planning processes etc.)
e) included in a plan focused on Sustainable Development more generally (i.e. an Integrated Community Sustainability Plan). f) included in a local
Canada USA Latin America
Europe
Australia & New Zealand
Africa Asia a b c d e f a b c d e f a b c d e f a b c d e f a b c d e f a b c d e f a b c d e f 0% 70% 0% 70% 0% 70% 0% 70% 0% 70% 0% 70% 0% 70%
For their current plans, respondents report a dominance of plans that are integrated into other types of plans across the municipality. The most common (46%) are plans that are included in existing long range plans for the city as a whole (i.e. Integrated Development Plan, Official Community Plan, long-term development planning processes, etc.). This is followed by climate plans that are included in broader sustainable development plans (36%), and those (32%) that are included in existing sectoral plans (i.e. spatial development, transportation, or economic development plans). Only 34% of mitigation plans and 39% of adaptation plans are described as being “contained in a plan specifically focused on climate change adaptation and mitigation.”
Overall, these results show a preference for the integration of climate change planning within other plans. But, as can be seen in Figure 2, there are significant regional variations here. Notably, a higher percentage of North American cities (47%) report having plans focused specifically on mitigation. Latin American (73%) and African cities (64%) lead in terms of creating plans that are focused on both adaptation and mitigation. Local governments in the United States (25%) and Africa (9%) lag in terms of integrating climate change into sectoral plans. Canadian (50%) and African (55%) cities are most likely to have integrated climate change plans into existing sustainable development plans. European cities (54%) are most likely to have included them within local government energy plans.
This integration of climate change planning within other plans is highlighted when descriptions of current climate plans are compared to those provided for the first climate change plans
produced by the municipality (see Figure 2). Respondents report a slight decrease in the number of plans focusing solely on climate change, and a significant increase in plans included in long range plans (an increase of 16 percentage points), and sectoral plans (+14%p). This comparison also shows an increase in the number of local governments conducting adaptation and energy planning. Finally, it can be inferred from their answers that local governments have also increased the number of climate relevant plans going from an average of 1.6 plans in their initial emissions mitigation planning efforts, to a current average of 2.2 climate mitigation related plans in each city.
Canadian cities are those that report the largest shift between their first and current climate change plans. While climate specific plans stay relatively stable, Canadian cities report marked increases in the inclusion of climate change plans within existing sectoral (+50%p), long range (+38%p), and sustainable development plans(+25%p). Asian cities show the smallest amount of change, with both initial and current plans showing among the highest rates of integration. American cities also report little change, but in contrast they consistently report among the lowest rates of integration across both their initial and current climate change plans.
To establish which of these various plans was the dominant climate plan for the local government, respondents were asked to identify their central or most important climate planning document. Here the most common single responses were that the central plan was one that focused solely on mitigation (21%), or on mitigation and adaptation together (23%). But overall, a strong majority of respondents (56%) describe the central
climate-planning document as being one that is integrated into some other local government plan. The type of policy integration reported here also bolsters the more general push to increase urban resilience by maximizing synergies across different policies and programs.
Targets and Proposed Actions
Respondents were asked to report on the existence of greenhouse gas (GHG) emissions reductions targets and specific actions to meet those targets. The majority of respondents report having concrete reduction targets (78%) and of these 93% report having specific actions proposed in their climate change plan (or plans) to meet those targets. For the minority of respondents whose local governments have not committed to specific reduction
targets (n=64), 86% report that their climate change plan (or plans) nonetheless proposes specific actions to reduce emissions. This is an encouraging result that shows that local governments are tying their reduction commitments to specific actions, and taking action even when they have yet to commit to specific reduction targets. But to understand the likely impact of these efforts it is necessary to take into account the scope of the proposed actions. Early initiatives often focus only on corporate emissions that are directly under local government control (retrofitting municipal buildings, for example). It is only by addressing larger community emissions that local governments will have a significant impact on global anthropogenic emissions.
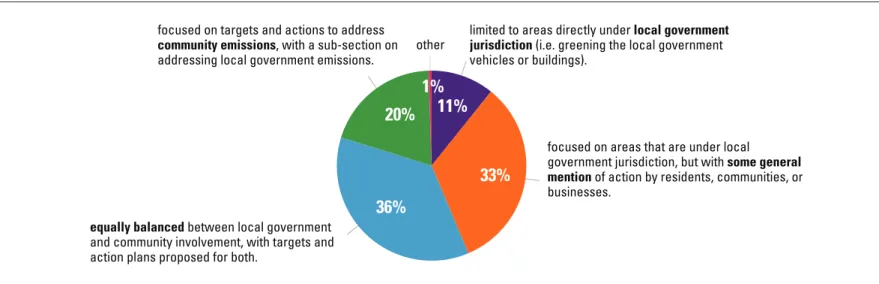
FIGURE 3 | SCOPE OF MITIGATION TARGETS & PLANNED ACTIONS: GLOBAL RESULTS
limited to areas directly under local government
jurisdiction (i.e. greening the local government
vehicles or buildings).
focused on areas that are under local
government jurisdiction, but with some general
mention of action by residents, communities, or
businesses.
equally balanced between local government
and community involvement, with targets and action plans proposed for both.
focused on targets and actions to address
community emissions, with a sub-section on
addressing local government emissions. other
33% 36%
20% 1%
When asked to select between statements that described the scope of their targets and planned actions, the majority (56%) of respondents reported that they were seriously tackling both corporate and community emissions. But this leaves 44% of cities with plans that are either limited exclusively to corporate emissions (11%), or that focus on corporate emissions and make only a general mention on broader emissions and actions to reduce them (33%).
Inventories: Frequency and Scope
Conducting an emissions inventory is a basic first step in climate change planning processes. When asked if they had conducted an emissions inventory (or hired a third party to do so), 85% of cities report having done so. Globally, 59% report having conducted multiple inventories since the start of their efforts to reduce GHG emissions. American and Canadian cities are most likely to have conducted an inventory (at 98% and 94% respectively). African
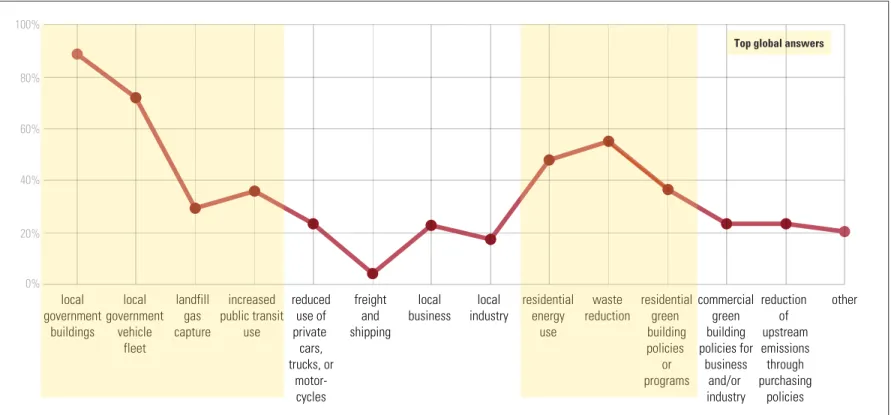
FIGURE 4 | WHERE CITIES HAVE MADE MEASURABLE EMISSIONS REDUCTIONS: GLOBAL RESULTS
local government buildings local government vehicle fleet landfill gas capture increased public transit use reduced use of private cars, trucks, or motor-cycles freight and shipping local
business industrylocal residentialenergy use
waste
reduction residentialgreen building policies or programs commercial green building policies for business and/or industry reduction of upstream emissions through purchasing policies other 0% 20% 40% 60% 80% 100%
and Asian cities are most likely not to have conducted one (at 82% and 46%).
The majority of local governments (62%) are conducting inventories that include corporate and community emissions as well as the emissions associated with the generation of the electricity consumed within the city (known as Scope 2 emissions). A smaller more ambitious group (15%) is also inventorying at
least some portion of the upstream emissions related to the goods and services consumed within the city (moving towards what are known as Scope 3 emissions). Roughly one quarter (22%) of respondents report that they are only inventorying the local government’s corporate emissions.
The most significant deviation from these averages occurs in cities in Australia and New Zealand, where 74% report having
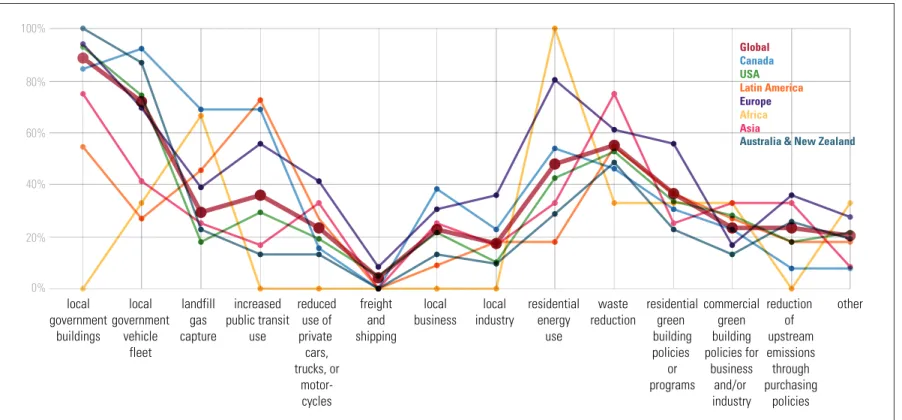
FIGURE 5 | WHERE CITIES HAVE MADE MEASURABLE EMISSIONS REDUCTIONS: REGIONAL RESULTS
local government buildings local government vehicle fleet landfill gas capture increased public transit use reduced use of private cars, trucks, or motor-cycles freight and shipping local
business industrylocal residentialenergy use
waste
reduction residentialgreen building policies or programs commercial green building policies for business and/or industry reduction of upstream emissions through purchasing policies other Global Canada USA Latin America Europe Africa Asia
Australia & New Zealand
0% 20% 40% 60% 80% 100%
inventories that focus solely on corporate emissions. Latin American and European cities are leading efforts to expand the scope of urban emissions inventories. Twenty-five percent (25%) of Latin American cities and 20% of European cities report that they are including upstream emissions in their inventories.
Where are Cities Reducing Emissions?
Cities can pursue a wide range of activities to reduce their GHG emissions. In total, 70% of cities report that their mitigation efforts have produced measurable emissions reductions. Of these, the three most common areas where local governments reduce emissions are: local government buildings (89%), local government vehicle fleets (72%), and waste reduction (55%). The next most common areas where reductions are made are: residential energy use (48%), residential green buildings policies and programs (36%), and increased public transit use (36%). (see Figure 4).
Reductions made in emissions coming from the private sector are far less common: 24% of cities report reductions from commercial green building programs, 17% report reductions from local industry, and 4% report reductions made in the freight and shipping sector. Roughly one quarter of cities surveyed (23%) report reductions made by addressing the upstream emissions associated with municipal purchases.
Looked at by region, in all but two areas the percentage of cities reporting that they are making measurable emissions reductions tends to vary between 72% (for the EU) to 82% (for Australia). The two outliers are African and Asian cities, where the
percentages fall to 27% and 43%, respectively. As can be seen in Figure 5 regional responses on where emissions reductions are being made tend to follow the global averages, with a few notable exceptions. Latin American cities were the least likely to report reductions made in the areas of local government vehicle fleet or residential energy use. They were however leaders (along with Canadian cities) in reductions related to increased use of public transportation. Although lagging in the area of public transportation, Asian cities reported were the most likely to report that they had cut their GHG emissions through waste reduction measures. African cities displayed the most uneven responses. They lead in the areas of landfill gas capture (along with Canadian cities) and residential energy use, but reported no reductions in half of the different areas of emissions reductions presented in the survey.
Discussion
Taken as a group, the questions in this section bring to light significant achievements as well as some priority areas for the future evolution of urban responses to climate change. At the level of climate change planning, a large majority of cities in most regions (with the notable exception of the US) are addressing both adaptation and mitigation. They are doing so in a way that brings together adaptation and mitigation, and are also including climate change planning itself within other long-range and sectoral plans within the city. This widespread mainstreaming of climate planning within cities suggests that cities are addressing climate change in an integrated fashion that should support both effective emissions reductions and an increase in urban resilience. However, comparing the scope of emissions inventories to the
areas where concrete emissions reductions have been made shows that the scale of measurement far exceeds the scope of action.
Through the inventories they are conducting, most cities possess the information necessary to support a much broader engagement with community-wide emissions. This is particularly true for the private and industrial sectors. As will be discussed below, the majority of cities have only recently begun their climate planning efforts. As these initiatives evolve it is important that there be a focus on bringing actions in-line with inventories, and that inventories themselves evolve to follow the lead of pioneer cities already engaging with Scope 3 emissions. This type of progression will help ensure that cities effectively contribute to an overall reduction in anthropogenic emissions (Satterthwaite 2008, Hoornweg et al 2011). As a strategic part of urban resilience strategies, this will contribute to keeping the anticipated impacts of climate change within a more manageable level.
Box 1: Key Findings
s
adaptation and mitigation.
s contain specific targets, and of those 93% report proposing specific actions to reach those targets. s
actions are mostly or entirely limited to areas
directly under local government control.
s are taking broader actions that target community as well as local government emissions.
s inventories make any mention of upstream emissions generated in the production of the goods and services consumed within their boundaries (Scope 3 emissions). s
integration of climate mitigation into sectoral plans,
long range plans, general sustainable development plans, and local government energy plans.
s concrete emissions reductions are: local government
buildings, local government fleets, waste reduction, residential energy use, residential green buildings,
Motivations, Synergies, and Competing Priorities
Climate change policies and programs do not exist in isolation. Both the policies themselves and the reasons for undertaking them exist in relationship to other local priorities and development goals. There is a large and growing literature in this area discussing the potential for synergies and co-benefits between mitigation and adaptation policies and other non-environmental urban development goals in areas such as economic development, health, and resilience (Gibbs et al. 2002, Robinson et al. 2006, Van Asselt et al. 2005). The advantages of these synergies are two-fold; they both increase efficiencies by accomplishing multiple policy objectives with fewer resources, and they increase the social and political attractiveness of climate change policies by clearly tying them to successes in other areas that already have supportive constituencies among the local population. To understand this broader context for local climate change efforts, respondents were asked a series of questions covering their motivations for undertaking climate mitigation planning, and whether in practice they have been able to realize synergies between their climate goals and other local development priorities.
Motivations for Mitigation Planning and Action
The top three motivations for initiating climate change mitigation planning where: to demonstrate leadership globally, nationally, or regionally (66%); to promote sustainable urban development more generally (57%); and to improve community quality of life (53%). A large number of respondents (40%) also reported that their local government had been motivated by an understanding of the
climate related risks and vulnerabilities that their city would face in the future (i.e. coastal erosion & storms, drought, flooding, crop failures, heat waves.) Rounding out the top 5 motivations were the desire to create a positive image for the community in the media, and to create green jobs and green economic development (both tied at 34%). These results were roughly stable across the different regions covered by the survey.
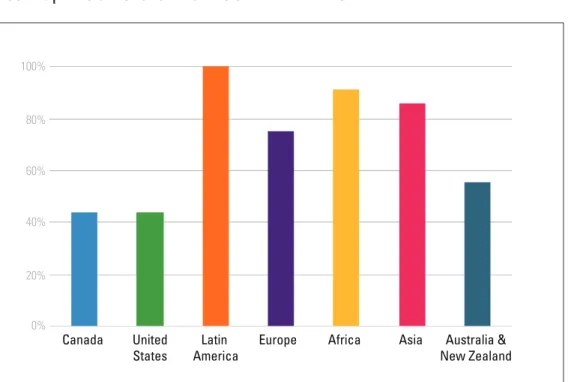
Complying with legal requirements to carry out climate change planning is another important motivation for some cities. Although only identified as a primary motivation by 20% of respondents, the influence of requirements enacted by higher levels of government is still quite widespread. In total 59% of respondents signal that national, state/province, or regional governments have laws or policies requiring them to undertake mitigation or adaptation planning. There is considerable regional variation here (see Figure 6), from 100% for Latin American respondents to 43% for US cities. For local governments with a legal requirement for their climate change work, 59% receive that mandate from their national government. Many local governments also report having multiple legal requirements from national, state, regional, and other sources.
Equally interesting are the least common motivations reported by cities. Synergies between mitigation planning and the broader (non-climate related) goals of the department leading mitigation planning efforts, or of other local government
departments were rarely mentioned (6% and 4% respectively). Cities very rarely reported that mitigation planning was undertaken to meet the requirements of funding agencies (23%), or to attract funding to pursue climate mitigation (12%) or adaptation (9%). While green economic development featured among the top five motivations, far fewer cities (11%) reported that mitigation was pursued as a way to attract talent and investment. Only 5% of respondents reported that meeting the needs of the poor was a main motivation for undertaking climate mitigation planning.
The importance of addressing the needs of the poor was comparatively higher in Latin America, the EU, Africa, and Asia. But even in these areas it did not rank among the top catalysts for mitigation planning. A more significant regional variation was the higher importance of attracting talent and investment as a motivation
for mitigation planning among Latin American cities (ranked 6th, compared to a global average rank of 14th). Cities in Australia and New Zealand also reported another key divergence from the global averages, ranking the desire to minimize the impacts of future carbon regulations and penalties on the local economy as their 4th most important motivator for undertaking climate planning (as compared to a rank of 10th globally).
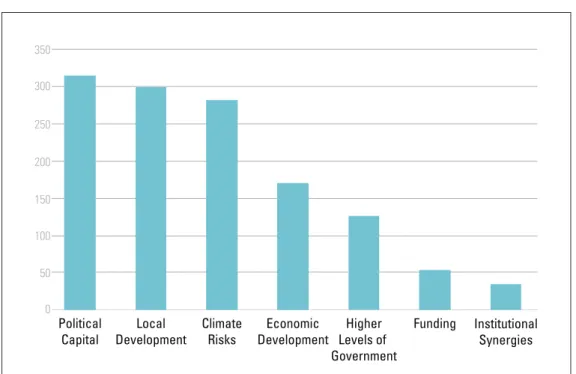
The multiple motivations that respondents could select from fall under 7 distinct thematic areas: generating political capital,
meeting local development goals, responding to risk, promoting economic development, responding to higher levels of government, attracting funding, and supporting existing institutional goals and mandates. Comparing the average ranking between these 7 themes reveals that cities so far have been predominantly motivated by the first three:
s
s s
FIGURE 6 | LAWS OR POLICIES REQUIRING CLIMATE PLANNING
0% 20% 40% 60% 80% 100% Canada United
The scoring in the four other areas is significantly lower, with the lowest ranked theme (supporting existing institutional goals and mandates) trailing the lead motivator by almost a factor of 10 (see Figure 7).
Synergies & Co-Benefits with Local Development Priorities
When asked, a majority of respondents (55%) reported that climate change related policies and programs were perceived to contribute to other local government objectives and goals. To explore these contributions in more detail, respondents were first asked to identify their top three overall (non climate change related) priorities from a list of common goals. Of these, a group a five emerged as strong favorites that were identified by a third or more of respondents as being among their local government’s top three overall priorities:
s s
s
libraries, parks, recreation centers, schools (39%); s
space, biodiversity (37%); and s
Respondents were then asked to rank the contribution that climate
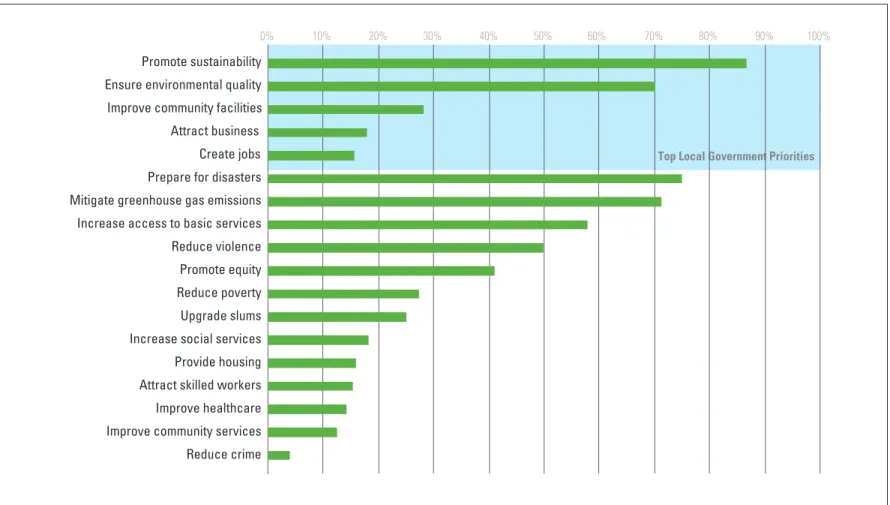
mitigation programs had made to the top priorities that they had identified on a spectrum ranging from 0 to 4, where 0 corresponded to “no contribution” and 4 to “significant contribution”. Figure 8 shows the percentage of cities that ranked this contribution as either a 3 or a 4.
FIGURE 7 | MOTIVATIONS FOR INITIATING MITIGATION PLANNING
0 50 100 150 200 250 300 350 Political Capital
Score is a weighted calculation. Items ranked first are valued higher than the following ranks. Displayed here are the average weighted scores across all items for each thematic area. NOTE:
Local
Development ClimateRisks DevelopmentEconomic Levels of Higher Government
Funding Institutional Synergies
Here the results show a sharp split. For priorities relating to economic development, climate mitigation programs were reported to have contributed little or not at all (rankings from
0-2) by 82% or more of respondents. For priorities that related directly to environmental quality and sustainability 70% or more report that mitigation programs had made some or significant
FIGURE 8 | CONTRIBUTIONS OF MITIGATION PLANNING AND ACTION TO OTHER LOCAL DEVELOPMENT PRIORITIES
Top Local Government Priorities
0% 10% 20% 30% 40% 50% 60% 70% 80% 90% 100%
Promote sustainability
Prepare for disasters Mitigate greenhouse gas emissions Ensure environmental quality
Increase access to basic services Reduce violence Promote equity Improve community facilities
Reduce poverty Upgrade slums Increase social services Attract business
Provide housing Create jobs
Attract skilled workers Improve healthcare Improve community services Reduce crime
contributions (ranking them a 3 or a 4). For the final priority area looking at community facilities the responses are less polarized, with a roughly balanced cluster of responses around the neutral point of the ranking scale.
Across a majority of the priorities identified by respondents (not simply those that ranked within the top 5) climate mitigation policies are seen to make little or no contribution. One interesting exception is in the area of providing increased access to basic services, which is seen to work in synergy with climate mitigation programs. Also two other priorities – reducing poverty, and increasing equity – received rankings more evenly distributed across the spectrum. It is important to signal that even in cases where the majority of cities report little or no contribution, on average 19% of cities report some or significant synergies (ranking them a 3 or a 4).
Looked at geographically there are some notable variations. The largest percentage of cities, reporting that their mitigation programs have made an important contribution to attracting business, come from Africa where 100% of respondents ranked this contribution as a 3 or a 4. Among participating African cities the contribution of mitigation policies to crime reduction efforts receives an identical ranking. Asian cities are the only respondents to signal that mitigation programs have made a significant contribution to improving healthcare (at 100%). Canadian cities are the only respondents to report that mitigation programs have made a significant contribution to increasing social services. Finally, Canadian, Latin American, and Asian cities are the only ones to report that mitigation programs have made a significant contribution to promoting equity (each at 100%).
Discussion
Overall the responses in this section show an important difference between the positive relationship reported between mitigation initiatives and other local priorities in general, and the more neutral to negative relationship reported between mitigation policies and concrete development goals. This is true of economic development goals, but also of broader developmental goals having to do with housing, health, community and social services, for example. This shows that the opportunities for synergies between climate mitigation and other local development priorities that have been discussed and documented in the literature on local responses to climate change have yet to be realized in most cities. However, the presence of positive examples in almost all cases shows that realizing synergies is possible and that there are potentially useful examples and best practices that can be opened up in future research.
Box 2: Key Findings
s mitigation planning are: demonstrating leadership, promoting sustainable urban development, improving
quality of life, understanding the expected local climate
related risks and vulnerabilities, creating green jobs and green economic development.
s are: attracting business, creating jobs, improving community facilities, ensuring environmental quality, and promoting sustainability.
s had contributed to their top priorities, local governments reported that they made little or no contribution to the top three, but contributed significantly to the final two (environmental quality and promoting sustainability). s
respondents (not simply those that ranked within the top 5) climate mitigation policies are seen to make little
or no contribution. One interesting exception is in the
area of providing increased access to basic services (water, sewage, electricity, solid waste collection), which is seen to work in synergy with climate mitigation programs.
s or no contribution, an average of 19% of cities report
Institutional Structures and Integration
Underlying discussions of synergies and co-benefits is the larger argument that for climate policy to be most effective it should be mainstreamed across municipal organizations and integrated into the multiple planning and operational procedures that govern urbanization. The ability of a municipality to design and implement integrated climate change plans is also a key contributor to its overall resilience, given that effective collaboration and coordinated action across sectors is an important aspect of overall institutional capacity. Who is responsible for climate change planning and how planning is conducted can therefore have a determining influence on the success of attempts to mainstream and integrate climate change at the city-level.
There are a variety of ways in which local governments assign and house responsibility for climate change planning within bureaucratic structures. Some have dedicated climate change or sustainability departments or teams; others have a single sustainability coordinator or rely extensively on consultants. Beyond these differences, there are also important variations in the extent to which other local government units participate in climate relevant planning or implementation.
To understand these issues, respondents were asked a series of questions covering the institutional structures that surround climate change planning, how various local government units are involved in climate change planning, and what tactics have been used to encourage the mainstreaming of climate change across
local government units.
Institutional Structures
Asked to describe the type of agency that is principally responsible for their climate change planning (covering both adaptation and mitigation), 40% of respondents reported that they had a small team of 1 to 5 employees. The second most common arrangement (23%) was having a single staff member, for example a Sustainability Coordinator, for the entire local government. A smaller proportion (15%) of respondents report that responsibility for the climate-planning portfolio had yet to be clearly assigned. Eight percent report having a large team (of 6 or more full time employees), and 4% have two distinct teams for adaptation and mitigation.
Looked at regionally, cities in Canada and the United States report an almost equal percentage of having either a small team or a single employee (roughly one third of respondents in each case). This makes North American cities the most likely to report that they only have a single staff member working on climate change. In all other regions, with the exception of Africa, the most common arrangement is for cities to have a small team. Having a large climate change planning team is most common in Latin America (21%), Asia (19%), and Canada (13%). At 21%, Latin American cities are also the most likely to report that responsibility for climate change planning is not clearly assigned. For African cities, the four most common responses were having
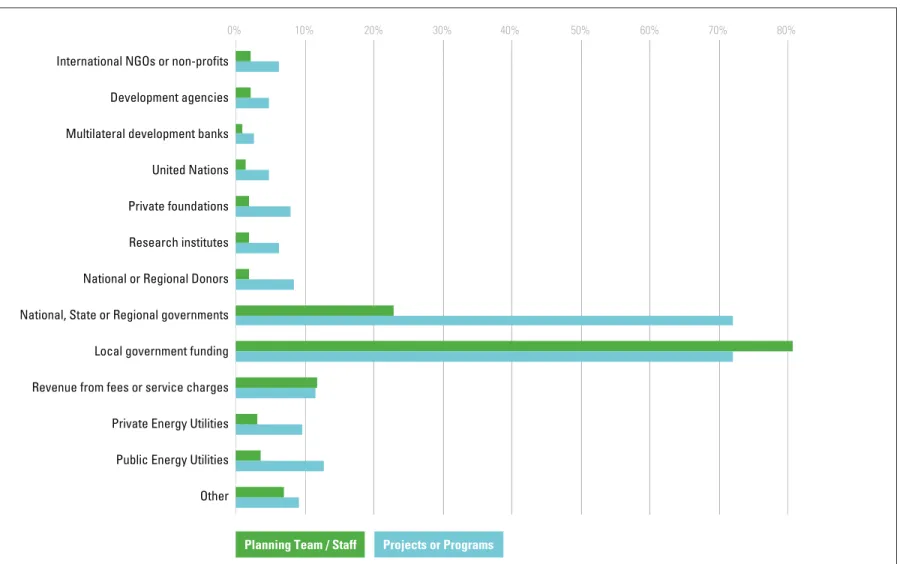
FIGURE 9 | SOURCES OF FUNDING: GLOBAL RESULTS
0% 10% 20% 30% 40% 50% 60% 70% 80%
International NGOs or non-profits Development agencies Multilateral development banks United Nations Private foundations Research institutes National or Regional Donors National, State or Regional governments Local government funding Revenue from fees or service charges Private Energy Utilities Public Energy Utilities Other
Projects or Programs Planning Team / Staff
a small team, having two teams, not having clearly assigned responsibility for climate planning, or employing a consultant to lead their climate change planning efforts (each at 18%). This makes Africa the only region where a significant percentage of cities report that the climate planning is being led by a consultant (the next closest, the United States, reports 4% of cities in this situation).
Where they exist, the majority of dedicated climate change mitigation teams are located in either the bureau/department responsible for Environmental issues (42%), Sustainability (17%), or Planning (12%). In the rare cases where they exist, dedicated adaptation teams are located in the bureau /department responsible for Planning (33%), Environmental Issues (25%), or the Mayor’s Office (17%). These figures change in cities where there is only a single staff member focusing on the climate change planning, where 28% are based in the bureau/department responsible for Environmental issues, 24% in Planning, and 21% in the Mayor’s Office.
A small numbers of cities (n=11) report establishing their mitigation teams or coordinators prior to the year 2000. The bulk of these are located in the United States, Canada, and Europe. But globally, the majority of cities created their mitigation positions far more recently. Just over three quarters of mitigation teams have been established since 2005, and just over 80% of sustainability coordinator-type positions were established during the same period. These results are generally stable across all the regions.
Funding
Respondents were asked to identify funding sources for their climate change work. They selected their answers from a list of various public, private, and non-profit sources. Figure 9 presents the percentage of cities that identified each of these as a principal source of funding for their climate change planning staff, or for specific local mitigation programs and projects. The most significant sources of funding for climate change staff were short-term and long-term funds provided by the local government itself (identified by 81% of respondents), funding from national or state/regional governments was the second most commonly identified source of funding (identified by 23%), followed by revenue from fees or service charges derived from areas under the climate agency’s jurisdiction, or under the jurisdiction of its parent department (i.e. fees charged for waste collection and recycling (12%).
For staff funding, no other source is reported as being significant. As can be seen in Figure 9 however, funding for projects and programs differs from this significantly. As with funding for staff, the two most common sources of funding for mitigation programs and projects are short-term and long-term funds provided by the local government itself, and funding from national and state/ regional governments. But rather than being separated by a large margin, both funding sources are here identified as a principal source of funding by 72% of respondents. This increased importance of funding from higher levels of government is one area where the financing of projects and programs differs significantly from the sources that fund climate change planning staff. There is also a greater diversity of funding sources for programs and projects. In addition to the top two sources of
funding, there are between 5% and 13% of cities identifying an additional 11 principal sources of funding for their mitigation projects and programs. These include national and international non-governmental organizations (NGOs), UN programs, national development agencies, public and private energy utilities, and private donors and foundations. These global results show that while a diversity of funding sources exists for funding for specific projects and programs, funding sources for staff are much more restricted.
Regional responses tended to follow these general results quite closely. Notable exceptions are African cities which, in addition to the staff funding sources covered above, are more likely to report receiving funding from international NGOs (14%), national or regional donors (14%), and development agencies such as DANIDA, DFID, USAID, or CIDA (29%). Higher numbers of African cities also report receiving funding from private energy utilities (14%), and having access to revenue streams that are under their control, or the control of their parent organization (29%). For project and program funding, African cities are the most likely to report receiving funding from international NGOs (43%), development agencies (71%), multilateral development banks such as the World Bank (29%), and United Nations organizations such as UN-Habitat (43%).
Cities in North America, Australia and New Zealand also display an interesting divergence from the global results. For both staff and program funding they are the most narrowly dependent on funds from higher levels of government. They are also the least likely to report that the principal source of funding for their climate change work comes from non-governmental sources.
Interdepartmental Collaboration and Mainstreaming of Mitigation
The ability to design and implement climate change plans is not limited to the agency directly tasked with climate planning. In fact, given the crosscutting nature of the climate challenge, effective responses require action at a government-wide level that goes beyond any one agency or jurisdiction. Key areas for action include transportation, land-use, waste, and energy policies and infrastructure. A key component in an understanding of urban climate governance is, therefore, an understanding of how different departments and agencies interact with the core climate planning team, and participate in the planning and implementation of a city’s climate mitigation strategy.
Attention to the interdepartmental dynamics is evident in the way in which cities report carrying out their mitigation plans. A majority of cities (61%) report that their plans are created with regular input by other municipal agencies throughout the planning process. More specifically, over a third of respondents (37%) report that the person/unit specifically tasked with climate planning oversees a collaborative planning process that extensively involves other multiple local government agencies/ departments. This leaves 24% of cities reporting that mitigation planning is conducted in a more isolated fashion either by core climate planning staff or among individual agencies/departments within their own silos. For the remainder, 8% report relying on a consultant to carry out their climate change planning, and 7% report carrying out their planning in other ways. These results show the general dominance of integrative and collaborative mitigation planning processes over more isolated and siloized approaches.
This pattern is seen across most regions, with the exceptions of Asia and Africa. African cities (at 64%) are most likely to report that their most important mitigation plans are created in a more isolated fashion, (with 46% reporting that they are created entirely by the person or unit specifically tasked with climate change planning). In Asia, 51% of cities report carrying out mitigation planning in an isolated fashion. In both cases, there are still a significant percentage of cities reporting a more integrated and collaborative approach to mitigation planning (27% for Africa,
and 43% for Asia). But overall results in each region invert the relationship between the different approaches to planning seen globally.
To understand the engagement of different local government agencies in greater detail, respondents were also asked to rank the degree to which specific agencies contributed to designing and/or implementing climate change adaptation and mitigation plans. Respondents were asked to rank each agency from 0
FIGURE 10 | CONTRIBUTIONS OF MUNICIPAL AGENCIES TO CLIMATE CHANGE PLANNING & IMPLEMENTATION: GLOBAL RESULTS
0% 10% 20% 30% 40% 50% 60% 70% 80% Land-use
Planning Water WasteWater WasteSolid Transpor-tation DevelopmentEconomic Health GovernmentLocal Operated Electrical Utility Zoning Building Codes Environment Adaptation Mitigation
“no contribution” to 4 “contributes heavily.” Figure 10 shows the percentage of cities ranking each agency as a 3 or a 4, with results displayed separately for their contributions to adaptation and to mitigation.
The agencies that contributed most heavily were those responsible for environmental planning, land-use planning, solid waste management, water, and transportation. Those that contributed the least were the locally operated electrical utility (where these existed), and the agencies responsible for health, and economic development. These rankings were generally stable across both adaptation and mitigation. Exceptions to this were solid waste, transportation, and locally operated utilities (which contributed more to mitigation); and water and health (which contributed more to adaptation).
Looked at geographically, we see that a higher percentage of cities in Asia (83%), Latin America (90%), and Africa (74%), report significant contributions from the solid waste sector. This is also true in the health sector where significant contributions are reported by 66% of Asian cities and 48% of African cities. Asia also distinguishes itself by being the only region where a high percentage of cities (54%) report that the agencies responsible for economic development contribute significantly to climate change planning.
Globally, the agencies which contributed the least to climate change planning and implementation (local electrical utility, health, and economic development) were also those where, elsewhere in the survey, respondents reported the least alignment between climate change mitigation plans and the existing objectives of the
government agencies responsible for those issues.
Tactics for Mainstreaming Climate Change and Encouraging Innovation
The subdivision of responsibility within municipal bureaucracies creates barriers to effective collaboration, information sharing, and coordinated action. These barriers need to be overcome if cities are going to present coherent and effective responses to climate change. To address this, cities often employ specific tactics and strategies to encourage the mainstreaming of climate change and the participation of multiple departments in the planning and implementation of policies, projects, and programs. Respondents were presented with a list of fourteen commonly employed strategies that covered educational outreach, network building, and formal institutional reforms and interventions. They were then asked to identify the strategies that their local governments had employed, and to rank their effectiveness on a scale from 0 “not effective” to 4 “highly effective”. Figure 11 shows these strategies ranked according to the percentage of cities who ranked them either a 3 or a 4.
Tactics for building internal networks between departments dominated the strategies that were identified as most effective. Among these were more formal interventions such as creating climate change or sustainability focused working groups that brought together staff from various agencies (ranked 4th), or “facilitating collaborative internal dialogues” to create a shared understanding and vision of what a sustainable future meant for their city (6th). But even more effective were informal interventions based on person-to-person exchanges and trust. Specifically, the
FIGURE 11 | TACTICS FOR ENCOURAGING ENGAGEMENT WITH CLIMATE CHANGE WITHIN LOCAL GOVERNMENTS: GLOBAL RESULTS
0% 10% 20% 30% 40% 50% 60% 70%
Creating informal channels of communication between the person/team responsible for climate planning and staff within other local government agencies Cultivating personal contacts and trust between the person/team responsible for climate planning and staff within other local government agencies Creating climate policies and programs that also help meet the existing (non-climate related) priorities, goals, and core mandates of local government agencies Creating climate change or sustainability focused working groups that bring together staff from multiple agencies Hiring or designating staff within local goernment agencies to coordinate that department / unit’s engagement with climate responses Facilitating collaborative internal dialogues within local government to create a vision and understanding of what a sustainable future means for your city Recognizing and celebrating green accomplishments in the local government Creating climate change or sustainability focused working groups within individual local government agencies Training sessions for local government employees dealing with specific issues related to climate General Climate Change education campaigns for local government agencies Integrating climate related metrics into the budgeting procedures of local government agencies Integrating climate related metrics into the performance management contracts of senior local government officials (department heads) Integrating climate related metrics into the procedures that local government agencies ues for budgeting infrastructure spending Integrating climate related metrics into the performance management contracts at multiple levels within local government agenices
Most Effective
Intermediate