Intra- and Inter-Hemispheric Interactions in
Somatosensory Processing of Pain: Dynamical Causal
Modeling Analysis of fMRI data
par
Mina Khoshnejad
Département de physiologie Faculté de médecine
Mémoire présenté à la Faculté des études supérieures et postdoctorales en vue de l’obtention du grade de Maîtrise
en sciences neurologiques
Octobre, 2009
Faculté des études supérieures
Ce mémoire intitulé :
Intra- and Inter-Hemispheric Interactions in Somatosensory Processing of Pain: Dynamical Causal Modeling Analysis of fMRI Data
présentée par : Mina Khoshnejad
a été évaluée par un jury composé des personnes suivantes :
Paul Cisek, président-rapporteur Pierre Rainville, directeur de recherche
Gary Duncan, co-directeur C. Elaine Chapman, membre du jury
Résumé
La douleur est une expérience perceptive comportant de nombreuses dimensions. Ces dimensions de douleur sont inter-reliées et recrutent des réseaux neuronaux qui traitent les informations correspondantes. L’élucidation de l'architecture fonctionnelle qui supporte les différents aspects perceptifs de l'expérience est donc une étape fondamentale pour notre compréhension du rôle fonctionnel des différentes régions de la matrice cérébrale de la douleur dans les circuits corticaux qui sous tendent l'expérience subjective de la douleur. Parmi les diverses régions du cerveau impliquées dans le traitement de l'information nociceptive, le cortex somatosensoriel primaire et secondaire (S1 et S2) sont les principales régions généralement associées au traitement de l'aspect sensori-discriminatif de la douleur. Toutefois, l'organisation fonctionnelle dans ces régions somato-sensorielles n’est pas complètement claire et relativement peu d'études ont examiné directement l'intégration de l'information entre les régions somatiques sensorielles. Ainsi, plusieurs questions demeurent concernant la relation hiérarchique entre S1 et S2, ainsi que le rôle fonctionnel des connexions inter-hémisphériques des régions somatiques sensorielles homologues. De même, le traitement en série ou en parallèle au sein du système somatosensoriel constitue un autre élément de questionnement qui nécessite un examen plus approfondi. Le but de la présente étude était de tester un certain nombre d'hypothèses sur la causalité dans les interactions fonctionnelle entre S1 et S2, alors que les sujets recevaient des chocs électriques douloureux. Nous avons mis en place une méthode de modélisation de la connectivité, qui utilise une description de causalité de la dynamique du système, afin d'étudier les interactions entre les sites d'activation définie par un ensemble de données provenant d'une étude d'imagerie fonctionnelle. Notre paradigme est constitué de 3 session expérimentales en utilisant des chocs électriques à trois différents niveaux d’intensité, soit modérément douloureux (niveau 3), soit légèrement douloureux (niveau 2), soit complètement non douloureux (niveau 1). Par conséquent, notre paradigme nous a permis
d'étudier comment l'intensité du stimulus est codé dans notre réseau d'intérêt, et comment la connectivité des différentes régions est modulée dans les conditions de stimulation différentes.
Nos résultats sont en faveur du mode sériel de traitement de l’information somatosensorielle nociceptive avec un apport prédominant de la voie thalamocorticale vers S1 controlatérale au site de stimulation. Nos résultats impliquent que l'information se propage de S1 controlatéral à travers notre réseau d'intérêt composé des cortex S1 bilatéraux et S2. Notre analyse indique que la connexion S1→S2 est renforcée par la douleur, ce qui suggère que S2 est plus élevé dans la hiérarchie du traitement de la douleur que S1, conformément aux conclusions précédentes neurophysiologiques et de magnétoencéphalographie. Enfin, notre analyse fournit des preuves de l'entrée de l'information somatosensorielle dans l'hémisphère controlatéral au côté de stimulation, avec des connexions inter-hémisphériques responsable du transfert de l'information à l'hémisphère ipsilatéral.
Abstract
Pain is a perceptual experience comprising many dimensions. These pain dimensions interrelate with each other and recruit neuronal networks that process the corresponding information. Elucidating the functional architecture that supports different perceptual aspects of the experience is thus, a fundamental step to our understanding of the functional role of different regions in the cerebral pain matrix that are involved in the cortical circuitry underlying the subjective experience of pain. Among various brain regions involved in the processing of nociceptive information, primary and secondary somatosensory cortices (S1 and S2) are the main areas generally associated with the processing of sensory-discriminative aspect of pain. However the functional organization in these somatosensory areas is not completely clear and relatively few studies have directly examined the integration of information among somatic sensory regions. Thus, several questions remain regarding the hierarchical relationship between S1 and S2, as well as the functional role of the inter-hemispheric connections of the homologous somatic sensory areas. Likewise, the question of serial or parallel processing within the somatosensory system is another questionable issue that requires further investigation. The purpose of the present study was to test a number of causal hypotheses regarding the functional interactions between S1 and S2, while subjects were receiving painful electric shocks. We implemented a connectivity modeling approach, which utilizes a causal description of system dynamics, in order to study the interactions among activation sites defined by a data set derived from a functional imaging study. Our paradigm consists of 3 experimental scans using electric shock stimuli, with the stimulus intensity changing from moderately painful (level 3), to slightly painful (level 2), and to completely non-painful (level 1) during the final scan. Therefore our paradigm allowed us to investigate how stimulus intensity is encoded within our network of interest, and how the connectivity of the different regions is modulated across the different stimulus conditions.
Our result is in favor of serial mode of somatosensory processing with thalamocortical input to S1 contralateral to stimulation site. Thus our results implicates that pain information is propogated from S1 contralateral through our network of interest comprising of bilateral S1 and S2. Our analysis indicates that S1→S2 connection is modulated by pain, which suggests that S2 is higher on the hierarchy of pain processing than S1, in accordance with previous neurophysiological and MEG findings. Lastly, our analysis provides evidence for the entrance of somatosensory information into the hemisphere contralateral to the stimulation side, with inter-hemispheric connections responsible for the transfer of information to the ipsilateral hemisphere.
Liste des abréviations
DCM: Dynamical Causal ModelingfMRI: Functional Magnetic Resonance Imaging BOLD: Blood Oxygen Level-Dependent
TR: Repetition Time TE: Echo Time BF: Bayes Factor GBF: Group Bayes Factor PER: Positive Evidence Ratio EM: Expectation Maximization BIC: Bayesian Information Criterion AIC: Akaike Information Criterion GLM: General Linear Model
ROI: Region of Interest CC: Corpus Callosum PCB: Posterior Callosal Body
Table des matières
Liste des tableaux... xi
Liste des figures ... xii
Remerciements... xiii
Chapter 1- Pain Processing ... 14
Section 1-1: Afferent Pain Pathways ... 15
Section 1-2: Involvement of Primary and Secondary Somatosensory areas in pain perception... 17
Section 1-3: Hierarchical organization of S1 and S2... 22
Section 1-3-1: Intra-hemispheric connections between S1 and S2... 23
Section 1-3-2: Inter-hemispheric callosal connections ... 30
Chapter 2- Dynamic Causal Modeling... 35
Section 2-1: Introduction ... 35
Section 2-2: A general introduction to System theory... 36
Section 2-3: Dynamic Causal Modeling ... 37
Section 2-3-1: Description of the neuronal dynamic model in DCM ... 38
Section 2-3-2: Hemodynamic model in DCM ... 42
Section 2-4: Rephrasing the problem in the Bayesian Inference Scheme ... 42
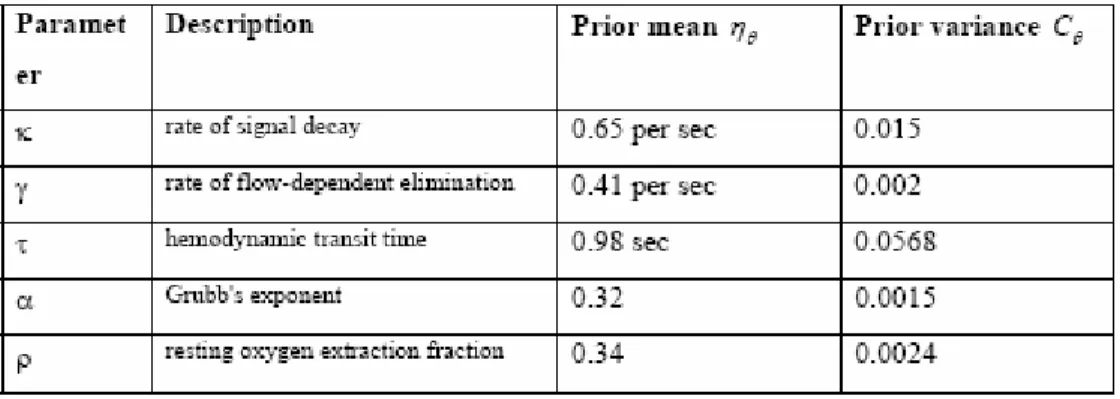
Section 2-4-1: Priors ... 43
Section 2-4-2: Estimation of the parameter posteriors... 45
Section 3-4-3: Hyper parameters of the error covariance ... 46
Section 2-4-4: Expectation Maximization Algorithm (EM) ... 46
Section 2-4-5: Interpretation of the result ... 47
Section 2-5: Comparison of different models ... 47
Chapter 3- Hypotheses ... 50
Section 3-1: Hypotheses for 4-Region network... 50
Section 3-1-1: Intrinsic Connectivity... 50
Section 3-1-3: Extrinsic connectivity... 52
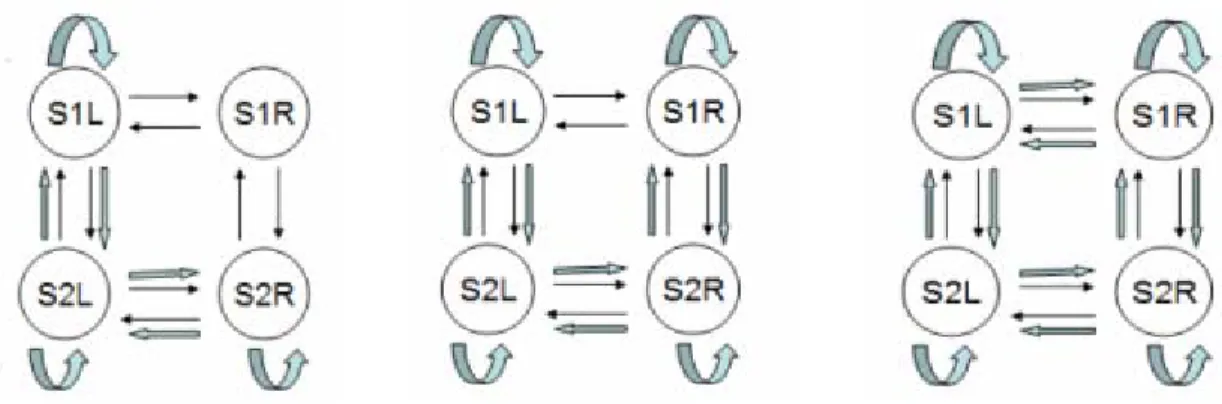
Section 3-2: All the Models Tested... 53
Series #1: 4-Region network... 53
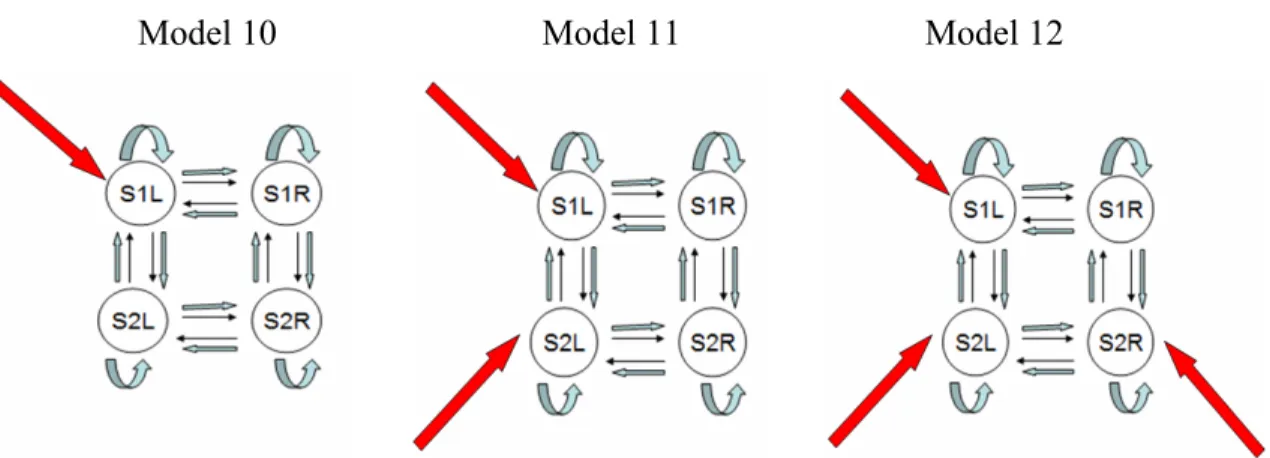
Series #2: 3-Region network... 53
Series #3: 2-Region network... 54
Chapter 4- Methods... 58
Section 4-1: Subjects... 58
Section 4-2: Stimulation Paradigm ... 59
Section 4-3: fMRI acquisition parameters ... 60
Section 4-4: GLM Analysis ... 60
Section 4-5: ROI definition... 61
Section 4-6: DCM Analysis ... 62
Chapter 5 – Results ... 64
Section 5-1: GLM results... 65
Section 5-2: Group Model Comparison ... 67
5-2-1- Level-3 condition ... 67
5-2-2- Level-2 condition ... 68
5-2-3- Level-1 condition ... 69
Section 5-3: Group results for the optimal model... 70
Section 5-4: Estimated BOLD signal... 72
Level-3 Condition ... 74
Level-2 Condition ... 74
Level-1 Condition ... 75
Section 5-5: Second Level analysis of model parameters... 75
4-Region models ... 75
3-Region models ... 76
2-Region models ... 77
Section 6-1-1: Serial versus parallel processing scheme ... 78
Section 6-1-2: Inter-hemispheric communication in somatosensory regions ... 80
Section 6-1-3: Increase in network complexity during pain ... 80
Section 6-2: Limitations... 82
Section 6-3: Future directions ... 84
Conclusion ... 86 Bibliographie... I Annexe ...V
Liste des tableaux
Table 2-1. Prior on biophysical parameters ... 45
Table 2-2. Interpretation of Bayes Factors... 48
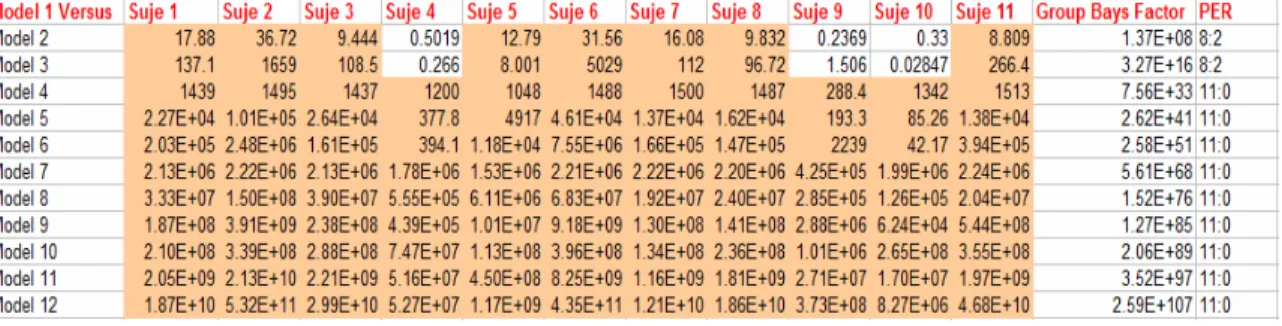
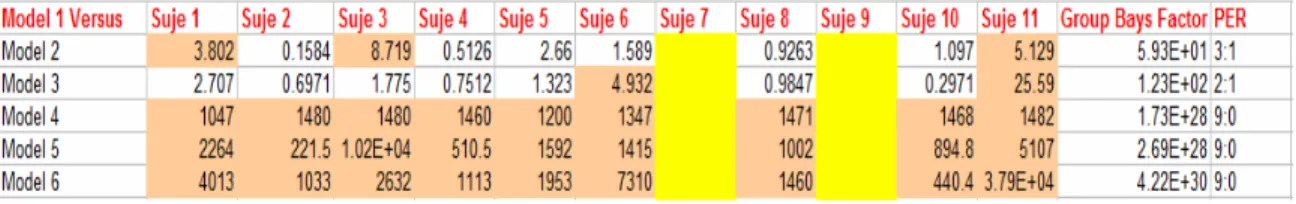
Table 5-1. Bayes Factors comparing Model 1 versus all the other 4-Region models, Level-3 condition... 68
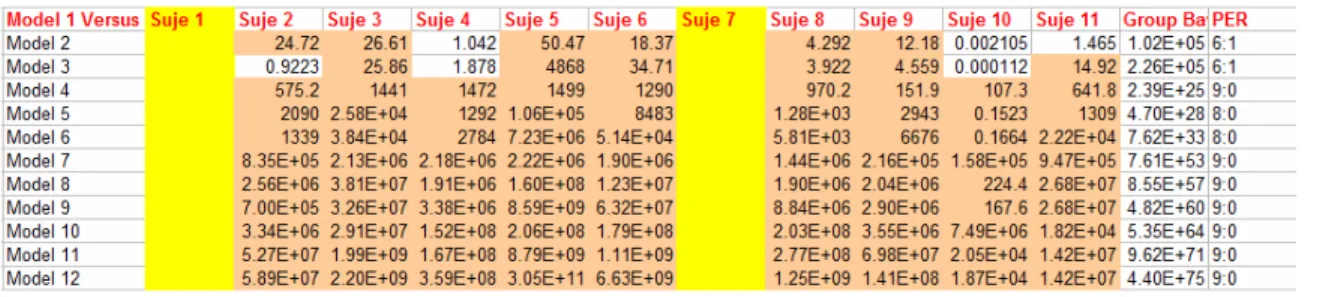
Table 5-2. Bayes Factors comparing Model 1 versus all the other 3-Region models, Level-3 condition... 68
Table 5-3. Bayes Factors comparing Model 1 versus all the other 4-Region models, Level-2 condition... 69
Table 5-4. Bayes Factors comparing Model 1 versus all the other 3-Region models, Level-2 condition... 69
Table 5-5. Bayes Factors comparing Model 1 versus all the other 3-Region models, Level-1 condition... 70
Table 5-6: Bayes Factors comparing Model 1 versus Model 2 (2 Regions models), Level-1 condition... 70
Table 5-7. Corr Coef- 4-Region models, Level-3 condition... 72
Table 5-8. Corr Coef- 3-Region models, Level-3 condition ... 72
Table 5-9. Corr Coef- 4-Region models, Level-2 condition... 72
Table 5-10. Corr Coef- 3-Region models, Level-2 condition... 72
Table 5-11. Corr Coef- 2-Region models, Level-1 condition... 75
Table 5-12. Intrinsic and Modulatory Connectivity Parameters (4-Region models)... 76
Table 5-13. Intrinsic and Modulatory Connectivity Parameters (3-Region models)... 77
Table 5-14. Intrinsic and Modulatory Connectivity Parameters (2-Region models)... 77 Table A-1. Bayes Factors comparing Model 1 versus all the other 4-Region models,
Level-3 condition...V Table A-2. ROI coordinates for each subject, Level-3 condition. ...V Table A-3. ROI coordinates for each subject, Level-2 condition ... VI Table A-4. ROI coordinates for each subject, Level-1 condition. . ... VI
Liste des figures
Figure 1-1. Intrinsic connection between S1 and S2... 23
Figure 2-1. Model of neural dynamic ... 41
Figure 2-2. Prior distribution of self connection... 44
Figure 2-3. Posterior probability density ... 47
Figure 2-4. Model complexity versus model fit... 49
Figure 3-1. Intrinsic Connectivity... 51
Figure 3-2. Category 1- Modulatory Connectivity ... 51
Figure 3-3. Modulatory connectivity: Category 2, Category 3, and Category 4 ... 52
Figure 3-4. Model 1 of Category 1 ... 53
Figure 3-5. Models 1 to 12 (left to right, top to bottom) in the 4-Regions modeling ... 56
Figure 3-6. Models 1 to 6 (left to right, top to bottom) in the 3-Regions modeling ... 57
Figure 3-7. Models 1 and 2 (left to right) in the 2-Region modeling ... 58
Figure 5-1. Group t map of GLM results for Level-3 stimulation ... 66
Figure 5-2. Group t map of GLM results for Level-2 stimulation... 66
Figure 5-3. Group t map of GLM results for Level-1 stimulation... 67
Figure 5-4. Optimal model for the 4-Region analysis for Level-3 and Level-2 ... 71
Figure 5-5. Optimal model for the 3-Region analysis for Level-3 and Level-2 ... 72
Figure 5-6. Optimal model for the 2-Region analysis for Level-1 ... 72
Figure 5-7. Observed (Blue) Vs Predicted (Red) time course for the 4-Region Model-1 in subject 1 (Level-1 dataset) ... 73
Remerciements
I would like to thank my research supervisors, Dr. Pierre Rainville and Dr. Gary Duncan. I am so grateful of all their invaluable help and support. And many thanks to my family for their support and love while I was away from home.
Chapter 1- Pain Processing
Pain is a complex phenomenon and is recognized as a multidimensional experience comprising sensory, affective, motivational and cognitive components. These pain dimensions and their interactions involve spinal pathways and brain networks that transmit and process nociceptive information (1). The sensory-discriminative aspect of pain perception consists of stimulus localization, recognition of its painful nature, evaluation of its temporal features as well as quantification of its intensity. Psychophysical studies often distinguish between pain sensation and pain unpleasantness (pain affect), and these components are represented at least partly in separate regions of the brain. The affective-motivational component includes the emotional aspect of the experience, such as fear and annoyance, and it has a key role in the behavioral response to potential tissue damage. Another characteristic that subserves pain affect, aside from the immediate unpleasantness, is called the secondary pain affect and relates to emotional feelings concerning long-term implications of having pain (1). The meaning of these sensory and affective dimensions of pain is dependent upon the contextual and psychological factors, and various studies show that activation in pain areas can be highly modulated by cognitive factors like attention and previous exposure to the painful stimulus ((1) , (2)). At the cortical level, growing evidence from the physiological and imaging literature shows an extended network of pain-processing areas among which the most commonly observed sites includes primary (S1) and secondary somatosensory cortices (S2), anterior cingulate cortex (ACC), as well as insula, frontal and prefrontal cortices (3). It is a widely held idea that S1 and S2 contribute to the sensory aspects of nociceptive processing, however the relative contribution of each and their functional organization have been in dispute. In this chapter, Section 1-1 presents a brief review of the literature on the main ascending pathway of the nociceptive system from the spinal cord to the various cortical areas that receive and process noxious information; section 1-2 reviews supporting evidence from clinical, neurophysiological and imaging studies for the involvement of S1 and S2 in pain perception. Section 1-3 consists of a short discussion on the functional organization and interactions between S1 and S2 and
a short review of the assumption in our hypothesis, which is discussed in detail in section 1-4 and section 1-5.
Section 1-1: Afferent Pain Pathways
Propagation of pain is initiated with a peripheral stimulus (mechanical, electrical, thermal, or chemical) activating specific receptors called nociceptors, which are widely found in the skin, visceral organs, and muscles. These first-order afferent fibers consist of small-diameter thinly mylinated A-Delta or unmylinated C fibers that have their cell bodies within the dorsal root ganglia and their axon terminals in the dorsal horn of the spinal cord. These first-order neurons form synapses with second-order neurons distributed within the dorsal horn of the spinal cord. The second-order neurons in the dorsal horn are classified into 3 distinct categories, and the organization of the ascending pathways depends upon them (4).
Group 1- Nociceptive Specific (NS) neurons respond exclusively to noxious stimuli and are located in superficial layers of the dorsal horn, especially in lamina I. They receive inputs from A-Delta and C fibers, and their receptive fields show somatotopic organization mostly in Lamina I (4).
Group 2- Wide Dynamic Range (WDR) neurons respond to both noxious and innocuous stimuli and are located in deep dorsal horn (Laminae IV-V) (4). They are activated by A-Delta, A-Beta, and C fibers and code for stimulus intensity across the entire range of sensation.
Group 3- Non-Nociceptive neurons (NN) respond to innocuous stimuli and are activated by A-Delta, and A-Beta fibers.
The axons of the second-order neurons decussate and form afferent bundles that ascend through the anterolateral and dorsolateral funiculus, relaying nociceptive
information to structures of the brain stem (reticular formation of medulla, PAG, etc) and thalamus. This pathway, called the spinothalamic tract (STT), is one of the principal ascending tracts of the spinal cord. The dorsolateral STT carries information mainly from Lamina I of the dorsal horn (as well as V-VI (1)) and terminates in the medial nuclei of thalamus, whereas axons from anterolateral STT originate from deep layers of the dorsal horn and project to lateral nuclei of thalamus (5). The terminations of the spinothalamic tracts in different thalamic nuclei (and the cortical projections from these nuclei to the cortex) form different circuits for pain processing. The projections to cortex from cells in medial and lateral thalamic nuclei are known as the medial and lateral pain systems, respectively, which operate in a parallel manner.
The lateral system which is believed to be primarily involved in the sensory discriminative aspect of pain processing, includes the lateral nuclear complex of thalamus, consisting of lateral (VPL), medial (VPM) and ventropostero-inferior (VPI) nuclei that project collectively to S1 and S2 cortex (4). VPL and VPM mainly consist of WDR type neurons, while NS neurons predominate in VPI nuclei. Animal studies have shown that VPI projects to S2 cortex while VPL projects to S1 cortex (5). These neurophysiological data show that stimulus characteristics are evaluated in the lateral system by WDR neurons of S1, which encode for the intensity of the stimulus, and by NS neurons of S1, which code for the spatial and temporal properties of the stimulus. Nociceptive neurons in S2 have been reported to mainly code for the temporal structure of the stimulus (4).
The medial nociceptive system consists of projections from medial thalamic nuclei to limbic structures like the insula and the anterior cingulate cortex. The cingulate cortex has been implicated in the attribution of emotional significance to the painful stimulus, in the regulation of emotional responses to noxious stimuli, and in the integration of cognitive, affective, and attentional responses (4). In brief, the medial pain system relates to affective-motivational dimensions of pain perception and is involved in processing cognitive,
behavioral and autonomic reactions to noxious stimulation. Apart from the specific research articles cited above, the reader may consult a general review of this literature by Kandel et al (6) for additional information.
Section 1-2: Involvement of Primary and Secondary
Somatosensory areas in pain perception
Somatosensory areas S1 and S2 are the two principal cortical areas that are thought to be implicated in the processing of both noxious and innocuous tactile stimuli. S1 in monkeys consists of 4 separate cytoarchitectonically defined areas; areas 3a, 3b, 1 and 2, with a somatotopic representation of the contralateral body surface in each architectonic field (6). S2 is located in parietal operculum in the upper bank of Sylvain fissure just inferior and lateral to S1. Converging lines of evidence from clinical and experimental studies indicate that S1 and S2 are involved in nociception and especially in sensory-discriminative aspects of pain perception; this evidence is discussed below.
Neurophysiological evidence from non-human primates shows that neurons in S1 receive input evoked by noxious stimuli. These nociceptive neurons encode for stimulus intensity by their firing rates (7), and their peak discharge frequency is significantly correlated with the monkey’s speed for detecting increases in the noxious level of thermal stimulation (7). The intensity-encoding property has also been observed for WDR neurons of VPL that project to S1 (8). Various studies demonstrated a detailed somatotopic organization within S1, which implicates the role of this region in encoding the spatial localization of the pain stimulus. Localization is important for sensory processing as well as for the quick orientation of attention to, and withdrawal of the body part from, the source of nociceptive stimulation – processes needed to prevent or limit potential tissue damage.
In contrast to S1, animal studies show that only small populations of S2 neurons are responsive to noxious stimuli, while the majority of neurons in S2 respond to innocuous
somatic stimuli. Some evidence from animal and human studies suggests separate representations of pain and touch in the parietal operculum (9). It has been demonstrated in primates that S2 nociceptive neurons have large receptive fields and are not capable of a precise encoding of stimulus intensity. They are responsive to bilateral as well as contralateral stimulation of the body and receive their inputs from NS neurons of VPI, which show the same response characteristics. It has been argued that because S2 projects to limbic areas via the insula, it might have a role in pain learning and memory (5). It has been discussed by Schnitzler (5) that, for the tactile system S2 is involved in feature extraction such as roughness discrimination (6) and detection of object size. Also lesion studies show that ablation of the S2 region impairs recognition of object shape (10). Additionally evidence suggesting that S1 and S2 are reciprocally connected to each other ((11), (12)) implies a functional interdependence between the two in pain processing. However, the role of S1-S2 interactions in pain has not yet been explored specifically.
Aside from neurophysiological studies, multiple case reports in clinical and lesion studies demonstrate an essential role of S1 and particularly S2 in normal pain perception. Potagas et al (13) reported a case of a woman who had episodic pain in the right side of her body, which was associated with a lesion in the white matter of the parietal operculum. Pain disappeared, after the surgical removal of the tumor. Greenspan et al (14), report a patient whose impairments in both pain and tactile perceptions (higher mechanical and heat thresholds and poor ability to discriminate roughness on the hand) were associated with a tumor located near the posterior insula and parietal operculum contralateral to the perceptual deficits. After surgery, the patient’s somatic deficits disappeared, which again suggest the essential role of S2 in the normal experience of pain and tactile perception. Ploner et al (15) report a case of a patient who described an unpleasant feeling following noxious stimulation but could neither localize the stimulus nor recognize its noxious nature; association of these symptoms with an ischemic lesion that included S1 and S2 implicates these areas in sensory-discriminative processing of noxious information and suggests that affective pain processing, which remained at least partly intact, likely involves regions
outside the somatosensory cortices. In a recent study by Greenspan et al (16), 6 patients with lesions in the parasylvain cortex (parietal operculum, and posterior insula) were tested for their pain sensitivity. Their results show that the 4 patients with lesions involving the posterior parietal operculum showed elevated thresholds for mechanical- and heat-evoked pain on the contralateral side, whereas the 2 subjects with lesions in posterior insula showed no pain threshold alterations. However these 2 patients exhibited deficits in motivational and affective response to pain (as indicated by a cold pain tolerance test), which suggests a role of posterior insula in pain affect. Another observation in this line of investigation is an experiment by Dong et al (17), involving awake monkeys, which showed that damage induced in the left posterior parietal cortex changes the monkey’s pain sensibility on the contralateral face. Thus, lesion studies generally provide at least some support for a role of parietal cortices, including S1 and S2, in pain processes.
Some studies have proposed that nociceptive input into S1 may have more to do with modulation of tactile sensation. The information that is being conveyed by the different somatosensory sub-modalities of touch, thermal sensation and pain interrelate with each other to some extent. The influence of touch on pain perception has been addressed in 1965 by Melzac and Wall in their “Gate Control Theory of Pain”, which asserts that the fibers conveying innocuous touch information can interfere with nociceptive signals and therefore inhibit pain perception. Apkarian et al (18) described the opposite interaction, the effect of pain on touch perception, which they called the “Touch Gate”, arguing that the presence of heat-induced pain can significantly diminish tactile sensation. In their study, they compared the simultaneous presentation of noxious heat and vibrotactile stimulus on the right hand with the presentation of the vibrotactile stimulus alone, measuring the vibrotactile thresholds before, during and after application of the painful heat. The results show increased vibratory thresholds and decreased tactile sensitivity, during and after painful thermal stimulation. Increases in vibratory thresholds occurred around subject’s pain thresholds, which indicated that activation of nociceptors indeed diminish the encoding of vibrotactile inputs. It has been argued that this effect might be
cognitive in nature, that attentional mechanisms might interfere with the perception of tactile sensation; however, this can be possibly ruled out by the observation that the tactile and painful stimulus must be within the same ipsilateral sites for the heat-induced pain to inhibit vibrotactile sensation (19).
Imaging studies generally report significant increases of cereberal blood flow (CBF) in the parietal operculum associated with painful stimulation. But early imaging studies reported inconsistent results on the role of S1 in pain perception. In a PET study by Talbot et al (20), a noxious heat stimulus applied sequentially to 6 spots on the forearm was associated with significant activation in the contralateral S1, presumably in response to the evoked pain. In a similar experiment by Jones et al (21), a heat stimulus presented to a single spot on the dorsal hand failed to produce significant activation in S1. In a subsequent PET study by Apkarian et al (22), putting the subject’s fingers in hot water led to decreased activity in S1. More recently, Timmerman et al (23) used fMRI to demonstrate a high correlation between S1 activity and both the intensity of noxious stimulation and the pain ratings evoked by that noxious stimulation; these results are in line with many of the more recent studies, which further support the involvement of S1 for intensity encoding of noxious stimuli.
Various arguments have been proposed by Bushnell and colleagues (2) to explain inconsistencies in the early imaging studies, most notably the uncontrolled but significant modulation of S1 activity by cognitive factors like attention and suggestions. They note that when attention is directed away from a painful stimulus, the activity in S1 is significantly reduced. Carrier et al (24)scanned subjects while they performed psychophysical tasks in which they had to attend to, and detect, small changes in either the noxious thermal intensity or the auditory tonal frequency of simultaneously presented stimuli. Pain intensity was rated lower and SI activity was reduced during the auditory, compared to the thermal, task. In studies from the same research group, Hofbauer et al ((25),(26)) observed that changes in the perceived intensity of pain, produced through hypnotic suggestions (a
cognitive manipulation), are directly correlated with activity in S1; however, suggestion-induced changes in pain unpleasantness, performed in a second hypnosis experiment by Rainville et al (27), were correlated with activity in ACC, but not in the activity of S1. Altogether these results suggest that the activation in S1 is highly dependent on cognitive factors like attention or suggestion, and changes in S1 activity are associated with changes in the subject’s perception of pain intensity.
If S1 and S2 are indeed involved in pain and tactile perception, the time course of pain-evoked and tactile-evoked activity in the somatosensory cortices should reflect the ongoing perception of those stimuli. Chen et al (28), tested this hypothesis in an experiment consisted of the presentation of noxious heat and innocuous brush stimuli of the same duration (9 sec). Analyses of the time course of activation in S1 and S2, revealed remarkable differences in the temporal domain with tactile-related activity peaks immediately upon stimulation and then habituates whereas the pain evoked activity has a slower onset, and keeps rising towards an eventual peak that occurs 8 sec after the stimulus offset. Thus the study confirms the hypothesis that activity in S1, evoked by noxious stimuli, is temporally correlated with the continuing perception of pain that follows stimulus offset, whereas tactile perception occurs around the stimulus offset.
Altogether the experimental data from neurophysiological studies, clinical observations of brain lesions, and evidence from the brain imaging literature, implies an important role of the somatosensory cortices in the experience of pain. This evidence for a contribution of both S1 and S2 in pain, motivated us to study the interactions between these areas in the processing of noxious information. Our hypothesis and the assumption underlying it, is discussed in the following section.
Section 1-3: Hierarchical organization of S1 and S2
Anatomical studies show that S1 is linked with S2 via intracortical reciprocal connections ((11), (12)). Pain and tactile information may therefore be conveyed to S2 through an indirect or serial path from the thalamus via S1. However as discussed in the previous sections, various studies of non-human primates suggest that S1 and S2 both receive direct projections from the thalamus, and it is likely that they are hierarchically organized in a parallel thalamocortical processing network. But as discussed in the previous section there are segregated nociceptive pathways from the spinal cord to S1 and S2, and the different thalamic nuclei that project to S1 and S2 have different response characteristics. Therefore they convey different information to S1 and S2. Since the response characteristics of nociceptive neurons of S1 and S2 are quite different, it is possible that input to S1 would be sufficient for the processing of one aspect of pain (ex; sensory discriminative aspect). Though if the stimulation paradigm triggers dimensions of pain other than intensity encoding, then the parallel thalamocortical input to S2 may perhaps be essential for the perception of pain that results from the interactions of various dimensions. This is one of the ideas that we wanted to address in this study through causal modeling of regional interactions.
Thus, functional organization in the somatosensory cortex is a matter of dispute, and relatively few studies directly examined integration of information between somatic sensory regions; this includes the hierarchical relationship between S1 and S2, as well as inter-hemispheric connections of the homologous somatic sensory areas. The purpose of this study was to test some causal hypotheses on the interactions between S1 and S2, while subjects were receiving painful electric shocks. We systematically tested a set of models of integration between S1 and S2 including intra-and inter-hemispheric connections in the context of pain.
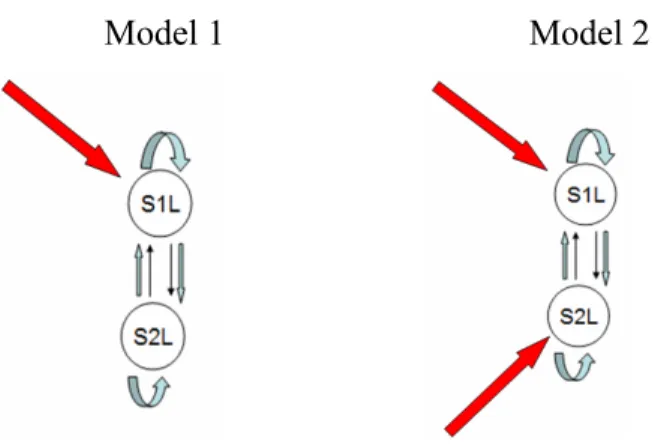
Figure 1-1. Intrinsic connection between S1 and S2
Based on the organization of the cortical somatosensory system, we postulated intrinsic connections among these sensory areas as shown in Figure 1-1. Then we tested a set of hypotheses based on: 1) which connections in this intrinsic network are modulated by the painful stimulus and 2) where the direct effect of noxious stimulus is most likely to occur and thus cause a change in the activity of the somatosensory regions by propagating its effect throughout the network. The complete description of the operational hypotheses is provided in chapter 2. As depicted in Figure 1-1, we assumed intra-cortical connections between S1 and S2 in both hemispheres as well as inter-hemispheric connections between homologous areas of S1 and S2. This section provides background from anatomical, neurophysiological, imaging, MEG and sensory evoked potential studies in support of such assumptions. The rest of this section is organized into sub-section 1-3-1 (describing intra-hemispheric connections) and sub-section 1-3-2 (which describes the inter-intra-hemispheric connections).
Section 1-3-1: Intra-hemispheric connections between S1 and S2
1-3-1-1: Increase in the complexity of Receptive Fields
The notion of sequential sensory processing implies the processing of gradually more complex sensory features of the stimulus in a hierarchical order of cortical areas. This
implies neurons with more complex receptive field characteristics in the hierarchy of processing flow.
Various single-cell recording studies in the somatosensory cortex have confirmed that there is a systematic increase in the complexity of neuronal receptive field’s (RF) properties along the rostro-caudal axis of the post-central gyrus ((29), (30)). Iwamura et al (31) observed that the complexity of RF of the hand region increases from area 3b to area 1 and 2 and towards the upper bank of intraparietal sulcus. Likewise, Duffy and Burchfiel (32) demonstrated in extracellular recordings from area 5 of monkeys, performed while manipulating multiple joints of one or more limbs, that the RF of cells in area 5 are sensitive to multi-joint limb manipulation, while neurons in the lower order processing regions only show sensitivity to single-joint manipulations. The number of bilateral RF neurons also increases towards the caudal part of the post central gyrus (33).
Also various studies had shown that the RF properties of bilateral neurons in S2 are even more complex than S1 ((34), (33)). In a study by Fitzgerald et al (35), it has been demonstrated that most S2 hand-region neurons have multidigit RFs, suggesting that S2 is of a higher order than area 3b (which primarily has single-digit RFs) and therefore that S2 has a role in integrating information across separate digits.
All together these data imply a sequential mode for sensory processing, with S2 at a higher order of the hierarchy for the processing of more complex details of stimulus features. However this notion has not been tested in the pain system, and although earlier studies show nociceptive neurons in S1 and S2, they did not test for a possible increase in the complexity of nociceptive neurons across these areas.
1-3-1-2: Ablation studies
Anatomical studies in monkeys ((11), (12)) reveal that architectonic fields in S1 are interconnected and that S1 and S2 are connected to each other in a reciprocal organized
manner. The question of whether tactile or noxious input to S2 comes via an anatomical pathway from S1 or from direct projections from thalamus can be tested through inactivation of S1 or S2 by surgical ablation methods or reversible cooling procedures; specifically, one can test whether inactivation of S1 affects S2 responsiveness or vice versa. Localized cooling provides a method for selective and reversible block of synaptic transmission within particular regions of the cerebral cortex (36). A summary of such ablation studies using both methods is discussed below.
Various cooling-induced ablation experiments on cats provide evidence for a parallel processing scheme. In anesthetized cats, Turman et al (37), investigated whether the inactivation of the distal forelimb region within S1 effect S2 responsiveness. The results indicate 20% of S2 neurons showed a reduction in their activation level, but that the majority of S2 neurons (80%) revealed no change at all in their response level. Although the observed reduction in the minority of the population can be attributed to the removal of facilitatory influences exerted via the intra-cortical connections between S1 and S2, the majority survived the inactivation, which implies a parallel mode of processing as the main mechanism. The reverse procedure was employed in another study by Turman et al (38), who examined the responsiveness of neurons in the distal forelimb region of S1 after the inactivation of the corresponding region of S2 through a cooling-induced procedure. Approximately 60% of S1 neurons were unaffected by S2 inactivation but the remaining 40% displayed some reduction in their response level. A similar study by Murray et al (36), in rabbits tested the effect of S1 inactivation on the neuronal activity in S2 (within the distal forelimb and hindlimb region) evoked in response to tactile stimulation. The vast majority (93%) of S2 neurons were unaffected by S1 inactivation, while only 7% showed a reduction in their response level. Thus, the ablation studies conducted in lower mammals, like cats and rabbits, provide similar results in favour of parallel processing of somatosensory information.
In contrast, studies in monkeys provide evidence for a serial processing scheme. Garaghaty et al (39) partially ablated the hand representation in area 3a and 3b of marmoset monkeys, and then recorded from S2 regions after the lesion. Their results showed that the somatotopically corresponding areas in S2 were no longer responsive to cutaneous stimulation of hand but other areas of S2, representing other body parts, remained responsive to tactile stimulation. In a similar study, Burton et al (40) ablated the hand representation in primary somatosensory cortex (S1) of Macaca monkeys and recorded in ipsilateral second somatosensory cortex (S2) a year later. They found that significant portions of the S2 hand area were unresponsive to cutaneous stimulation of the hand, which suggests that S2 responses depend heavily on inputs from S1 for its activation even after such a long period following S1 ablation.
As discussed in section 1-2, S1 comprises of 4 cytoarchitectonic subdivisions; areas 3a, 3b, 1, and 2, with each area responsible for processing different components of somatosensory information. Areas 3b and 1 process mainly cutaneous inputs, whereas the other two process information from afferents coming from “deep” body tissues such as muscle (area 3a) and joints (area 2) (6). Pons et al (41) investigated the relative influence of each of these S1 areas on the responsiveness of neurons in the hand representation in S2 of macaques, using ablations of the hand representations in areas 3a, 3b, 1, and 2 in different combinations. Their results show that ablation of areas 3b and 1 resulted in S2 responsivity to only deep stimulation because only deep input were provided for S2, whereas ablation of 3a and 2 yeilded strong S2 responses only to cutaneous inputs as the result of the absence of deep inputs. Combined ablation of cortical areas 1 and 2 only altered the ratio of cutaneous to deep receptive fields, but S2 neurons were still responsive to both cutaneous and deep input because area 3a and 3b relay the corresponding information to S2 hand region. The same was true for the combined ablation of 3a and 3b. It is interesting to reflect that other than the hand representation in S2, other areas remained intact in their responsivity to either cutaneous or deep stimulation.
Since several studies showed that in simian primates S2 responsiveness was abolished by surgical ablation of S1 and that S1 responses were significantly diminished following S2 lesions, these results seem to be in favour of hierarchical processing of somatosensory information in the parietal cortex. However results from studies in cats and rabbits are more in favour of parallel processing, suggesting that there may be fundamental differences between simian primates and other mammalian species in the organization of thalamo-cortical systems. It has been hypothesized by Pons et al (41) that there might have been an evolutionary shift from parallel processing in general mammals to serial organization in higher primates. In humans, evoked potential studies provide further information on this issue as discussed in the following subsection.
1-3-1-3: Evoked Potential Studies
If the flow of somatosensory processing is serially organized, cortical responses in S1 and S2 should perhaps show considerable differences in their response latency to somatic stimulation. Various studies have used magnetoencephalography (MEG) or electroencephalography (EEG) to record sensory evoked potentials in an attempt to elucidate temporal relationships among the various cortical areas in the post-central gyrus in response to noxious and innocuous stimulation. These methods allow the localization of cortical sources as well as measurement of the time taken for the signal transfer in the brain.
Although some MEG studies show simultaneous activation of S1 and S2 (implicating a parallel mode of sensory information processing in S1 and S2), other studies contradict this idea. The reason for this controversy across studies may reflect the weak activation magnitude of S1 and thus the difficulty to find early S1 activity (42). It has been further argued by Inui et al (42) that the weakness of S1 activity might be explained by the weaker stimulus intensity of noxious stimulation used in some studies. Since the level of activity of S1 nociceptive neurons has been shown to encode stimulus intensity, activation
by low intensity stimuli may be more difficult to detect with this method. In contrast, since S2 neurons may play roles other than intensity encoding, S2 responses may be easier to detect at lower stimulus intensity.
Activation latencies of the various somatosensory areas following application of transcutaneous non-painful electrical stimulation has also been studied using MEG by Inui et al (30). The results show a significant shift of onset latency from area 3b to areas 1, 5 and S2 respectively. Although these results may imply a sequential mode of processing, one possible alternative explanation is that all these activations come directly from the thalamus and the observed response latency can be attributable to the different conduction velocities from the thalamus (as discussed by Inui et al in (30)). However, it has been shown in animals by Salami et al (43) that the latencies of thalamocortical afferents that convey information from the thalamus to multiple cortical areas are almost the same, irrespective of the distance.
MEG recordings following application of painful and non-painful electrical stimulation to the hand have been analyzed to identify the source location and activation latencies within S1 and S2. Using this technique, Inui et al (42) found that the source locations for activation sites evoked by noxious and innocuous stimulation were relatively similar in S1 and S2, except that innocuous stimulation activated 2 sources in S1. Those 2 sources in S1 had a short latency (<40 msec) and originated in area 3b and in area 1. Early activity following noxious stimulation was localized only in area 1, and in this case, the latency was longer than 85 msec (longer latencies for pain-evoked cortical activation are explained by the slower conduction velocities of peripheral nociceptive afferents, rather than differences in cortical interconnections). S2 activation always followed S1 activity. Relative to S1 peaks, the onset latency of S2 responses were delayed by 29 ms and 35 ms following noxious and innocuous stimulation, respectively. Because of the significant difference in onset latency between S1 and S2, these results strongly favor serial processing for both nociceptive and tactile information. The response delays from S1 to S2 were
almost the same between innocuous (35 ms) and noxious stimulation (29 ms), which suggests that information from S1 to S2 is being transmitted through similar pathways, consistent with the dynamics of cortico-cortical connections.
In another study by Kitamura et al (44), which focused on cortical responses to noxious stimulation, MEG was used to record somatosensory evoked magnetic fields (SEF) associated with ‘weak’ and ‘strong’ painful transcutaneous electrical stimulation delivered to the left sural nerve at the ankle. Early deflections (< 100 ms in latency) were located in S1 contralateral to the stimulated nerve, which was identified in both weak and strong stimulation sessions. A middle latency component (> than 100 ms) was also found in bilateral S2 and cingulate cortex – but only in the strong stimulation condition (two sources were described, one with a latency of 150 msec and the second with a latency of 250 msec). Following in this line of study, Kakigi et al (45) investigated SEF after stimulation applied to various body parts in five normal subjects. In agreement with the results from lower limb stimulation (44), stimulation of the right and left posterior tibial nerves at the ankle in all subjects resulted in early activation in the foot area of S1. Small middle-latency deflections were clearly identified in two subjects in the second somatosensory cortex (S2) in both hemispheres with 100 ms latency. The same temporal order of activation was also found following upper limb stimulation of the median nerve at the wrist or fingers. In conclusion, all these studies indicate that, following a painful stimulation, S1 is initially activated, and then S2 is activated with a delay of 30-50 msec, depending on the stimulation site.
In brief, section 1-3-1 addressed the issue of intra-hemispheric connections of S1 and S2. Section 1-3-1-1, discussed the increase in the complexity of neuronal RFs from S1 to S2, consistent with the notion that S2 is a higher order processing unit. In section 1-3-1-2, some ablation studies have been reviewed, which show that in higher order primates normal S1 and S2 activity is dependent upon their reciprocal interactions. And lastly the evoked potential studies described in subsection 1-3-1-3 showed that S2 is activated later than S1, which suggests that the dominant flow of information is from S1 to S2, in favour
of a serial processing scheme. In what follows (section 1-3-2), the inter-hemispheric connections in the somatosensory cortex are discussed.
Section 1-3-2: Inter-hemispheric callosal connections
1-3-2-1: Anatomical studies
The Corpus Callosum (CC) is the main fiber tract that mediates communication between homotopic regions of somatosensory cortex. Anatomical investigations reveal that the macaque’s homologues of human S1 and S2 have dense callosal connections ((46),(47)) .These early studies found that the distribution of callosal fibers is not uniform, with midline structures of body representation (head, trunk, tail and proximal limb regions) having dense callosal connection and the distal limb regions having fewer commissural fibers (46). As discussed in previous sections, S1 contains multiple somatotopic representations of the body surface, which are defined by individual architectonic fields, and these early studies also report that even within the connected zones, the density of callosal connections varies, with increasing density across areas 3b, 1 and 2 (46). Likewise, even within each architectonic field, the representations of hand and foot have fewer callosal connections than face and trunk (46).
Recent studies, perhaps with the benefit of more sensitive anatomical techniques, describe callosal connections for peripheral body parts, in addition to those for midline structures, which were emphasized in the initial reports. In a study by Iwamura et al (31), a large number of neurons with bilateral RF have been found in the digit regions within the upper bank of the intraparietal sulcus. The RF of these neurons show very complex characteristic compare to neurons in the anterior part of post central gyrus that projects to them (31), which implicates the hierarchical processing of somatosensory information. These bilateral neurons could not be found after lesioning the postcentral gyrus in the opposite hemisphere. This suggests that bilaterality is the result of a transfer of
somatosensory signals from the contralateral hemisphere via callosal connections. In a more recent study, Iwamura and colleagues ((33),(48)) describe a significant number of neurons with bilateral RFs in the hand, digits and lower extremity areas within the caudal part of post central gyrus in the awake monkey. Likewise, Taoka et al (49) found bilateral RFs in the hindlimb region of postcentral somatosensory cortex mostly in areas 2 and 5. The ipsilateral input for these bilateral receptive fields possibly reaches the cortex via callosal fibers from the contralateral site. Iwamura et al (48) also demonstrate that callosal connections are more dense and bilateral activity becomes more widespread and complex in S2 and in the caudal parietal areas. This finding again supports the notion that these areas are involved in higher-order stages of processing of somatosensory information.
In general, data from experiments on non-human primates ((46),(47)) strongly support the hypothesis that callosal connections are responsible for sensory activation of ipsilateral cortical sites after sensory afferent activity is relayed from the homologous somatic sensory area. In human subjects, latency studies have shown that ipsilateral activation that is elicited by tactile stimulation is delayed relative to the homototopic contralateral activation by a time lag corresponding to the interhemispheric transmission time (50). Therefore it is quite probable that anatomical and functional organization of the human and non-human primate somatosensory cortices would be similar.
1-3-2-3: Studies on Callosotomized and Acallosal patients
The idea that peripheral sensory information from ipsilateral body sites reaches the ipsilateral hemisphere through commissural fibers of the corpus callosum can be investigated by studying the callosotomized patients (surgical section of some part or all of the corpus callosum) and acallosal individuals (individuals born without corpus callosum). Studying the patterns of cortical activation by imaging modalities as well as examining the performance of these patients in tasks that require interhemispheric integration of sensory inputs allows testing the contribution of the CC to this function.
Fabri et al (51) described a fMRI study in which 6 healthy and 3 callosotomized patients (complete callosotomy) were tested for their cortical responses to tactile and mechanical painful stimulation (pricking the palm with a sharp probe). The results show contralateral S1 and bilateral S2 activation in response to noxious stimuli in both patients and normal controls. The ipsilateral S2 response in the patients may implicate ipsilateral pathways or extra-callosal fibers conveying nociceptive information across hemispheres. The tactile condition only evoked contralateral activation in S1 and S2 in the patients but bilateral activation in S2 and contralateral S1 in the control group. This demonstrates that the inter-hemispheric transfer of non-nociceptive information depends more heavily on the integrity of the CC.
In another study Fabri et al (50) reported an fMRI experiment conducted on 12 callosotomized and 12 control subjects. Subjects received unilateral tactile stimulation, which consisted of brushing the subject’s palm and finger with a rough sponge. Three callosotomized subjects had a total resection of CC and nine had a partial resection only. Consistent with their late study, discussed above, results showed that unilateral tactile stimulation provoked contralateral activation in S1 and bilateral activation in S2 cortices in normal subjects. In the 3 split-brain patients and 7 of the partial callosotomy subgroup, there was a complete absence of S1 and S2 activation in the ipsilateral hemisphere, but contralateral activation was similar to those obtained in normal subjects. Activation in S2 of the ipsilateral hemisphere was observed only in two patients with intact splenium and posterior body of the CC.
In a very recent study, Duquette et al. (52) tested two acallosal, one callosotomized, and six healthy control subjects in an fMRI study investigating cortical responses to both tactile and painful stimulation. Their paradigm consisted of 3 experimental runs of tactile stimulation (brushing of the subject’s calf) and 3 runs of thermal stimulation (noxious heat and innocuous warm stimuli). Bilateral tactile activation was found in S1 and S2 in some control and acallosal subjects but ipsilateral activation was not observed in the
callosotomized subject. This result suggests a reorganization of the touch system in acallosal subjects and the existence of compensatory mechanisms that may be responsible for the bilateral activation in these patients with a compromised CC. But consistent with previous reports, in the pain condition, all subjects including the callosotomized patient showed bilateral activation in at least 2 pain areas (S2, ACC, and/or in Insula). Bilateral activation in the callosotomized patient may indicate the potential independence of the pain system from callosal connections; however, since the study only included one callosotomized patient, their result cannot be generalized to normal subjects, as this could also reflect plasticity in the callosotomized patient.
Fabri et al (53) recently investigated the relative contributions of different portions of CC for the transfer of tactile information. Anatomical studies on non-human primates had previously indicated that the CC is topographically organized with anterior fibers connecting the frontal lobes and the posterior fibers connecting temporal, parietal and occipital lobes (54). Consequently patients with a lesion at different locations of the CC should show deficits reflecting this organization. Consistently, Fabri et al (53) reported that callosotomized patients with resection in the posterior part of CC show tactile-evoked activations only in the contralateral hemisphere while patients with an intact posterior callosal body (PCB) show bilateral tactile-related activation like normal subjects. Aside from the imaging results, their neuropsychological data are also interesting. The “Tactile Naming Test” evaluates the participant’s ability to name tactile stimuli that are presented only to the left hand – i.e. evaluates the ability of tactile-related processing to transfer from the hemisphere contralateral to stimulation to the opposite hemisphere where it can be accessed by left-lateralized language areas. The results show that only the patients with intact PBC performed well, obtaining high scores in this test. This provides support for the notion that the interhemispheric fibers running through the posterior portion of CC are necessary to convey tactual information to the left hemisphere where its description can be verbalized
In section 1-3-2, we have provided a brief overview of the inter-hemispheric communication between homologous somatosensory cortices. Section 1-3-2-1 discussed some of the anatomical studies in support of callosal connections, and Section 1-3-2-2, reviewed imaging studies on callosotomized and acallosal patients. In brief these studies show the absolute absence of tactile-related activation or partial lack of pain-related activation in the ipsilateral S1 and S2 for callosotomized, while for normal subjects bilateral S2 activation has been observed. These results emphasize the role of CC for conveying the noxious and innocuous information to the ipsilateral regions. However, since in the pain condition, ipisilateral activation has been observed in some regions within the pain matrix in callosotomized patients, one other possibility would be that thalamocortical projections directly relay nociceptive input to the ipsilateral sites in these patients. But this possibility must be treated with caution, since it is based on very limited lesion data, therefore more conclusive evidence awaits additional studies of callosotomized patients and a more detailed analysis of neuronal networks of nociceptive processing. Causal modeling which we implemented in this study to investigate the nociceptive processing within the somatosensory cortex in normal subjects, tries to address the question of callosal transfer of information from a causal perspective. The mathematical detail of this modeling is discussed in the next chapter.
Chapter 2- Dynamic Causal Modeling
Section 2-1: Introduction
Usually the main focus of neuroimaging studies is functional localization, in which a particular brain region is associated with a specific function. However this definition of functional localization is incomplete, since a cortical area does not work in isolation but is related to a particular cortical circuitry involved in achieving a specific sensory, perceptual, affective, cognitive or executive function. Recent approaches to functional integration model interactions among various specialized areas in order to study functional architecture.
The numerous approaches that have been developed to study functional integration can be categorized into two main groups: functional connectivity and effective connectivity. The approaches grouped under the term functional connectivity attempt to explain the activity in one area in relation to activity elsewhere by looking at correlations between the two. However a correlation between the two regions does not necessarily constitute direct evidence for integration between the two, since the correlation might be due to the involvement of a third structure which feeds into the two regions of interest, thus causing the correlation between them.
The other group of approaches to the study of functional integration, effective connectivity, is focused on the causal influence that one neuronal population applies over the other. Integration among various regions is usually better explained and defined conceptually in terms of effective connectivity. The approach being described and used here; “Dynamical Causal Modelling” (DCM) belongs to this class of modelling. DCM is a method proposed by Friston et al (55) to test causal hypotheses about integration among specialized brain regions using functional imaging data. DCM models interactions among neuronal populations at a regional cortical level using fMRI time series. The aim of this kind of modeling is to estimate the parameters associated with the strength of the connections among brain regions and to examine how that coupling is influenced by
changes in an experimental context (56). In general, by using DCM, one can hypothesize which pathway has been activated by experimental manipulation, as opposed to a cortical region that might be identified using a conventional General Linear Model (GLM) analysis (56).
The following Section 2-2, provides a general introduction to system theory. Section 2-3 contains a complete description of the methodology together with a discussion of the assumptions and limitations of DCM. Section 2-4 describes the Bayesian scheme for the estimation of model parameters. The chapter finishes with a discussion of the different criteria used for model selection (Section 2-5).
Section 2-2: A general introduction to System theory
The dynamics of the brain and the interactions among its various regions can be framed from a “System” Perspective. In general, a system is a set of elements that interact with each other in a temporal manner (57). Assume a system that has n elements with a time-varient property x associated with each element. Each of these constituent elements i
i
x (1<i<n) is called a state variable. The state vector of the system is a vector of all state variables: xt =[x1(t),...,xn(t)]. The change in any state vector in time can be predicted from the current and past causal interactions among system’s elements. This can be defined by a set of ordinary differential equations.
) ,..., , ( ... ) ,..., , ( 2 1 2 1 1 1 n n n n x x x f dt dx x x x f dt dx = = ( ) ) ( ... ) ( 1 x F x f x f dt dx n = = (2-1) (57)
In order to specify the f in the formula above, a set of parameter i θ is needed. The
function f also depends upon the input to the system. Therefore the changes in the state i
variables caused by these inputs ( u ) evolve temporally depending upon the pattern of interaction among system’s elements (57). The equation above should therefore be modified as follows: ) , , ( ) , , ,..., ( ... ) , , ,..., ( 1 1 1 1 θ θ θ u x F u x x f u x x f dt dx n n n n = = (2-2) (57)
The model provided by this equation describes the causal interactions of the system elements and external inputs of a dynamic system in time. One assumption in the model above is that the inputs ( u ) are independent from each other; otherwise, the relation among inputs should be further explained by a differential equation like equation 2-1 (57).
If the brain is considered as a system, the different cortical regions can be regarded as system elements, whose causal interactions we wish to understand. The input vector u would then be the experimental manipulations, such as sensory inputs or changes in instructions (e.g., attention). DCM, which is a system-based hypothesis-driven application, is described in the next section.
Section 2-3: Dynamic Causal Modeling
In this approach the brain is described as a multiple input - multiple output system where the inputs correspond to experimental manipulations and outputs are the regional brain responses measured by neuroimaging techniques such as the fMRI-derived regional blood oxygenation-dependent (BOLD) signal. The causal interactions among cortical areas are parameterized in order to explain the regional BOLD measurements obtained by the scanner. DCM utilizes a causal model by which neuronal activity in a given region causes
changes in neuronal activity in other regions in the model (via a pattern of interregional connections) and in its own activity by local self-regulatory connections (58). Additionally, any of these connections can be modulated by sensory inputs and contextual variables, such as a cognitive set (e.g. attention) implemented in the experimental design (58). The system’s parameters are not known, thus in brief DCM is a system identification procedure using a Bayesian scheme to estimate the parameters associated with each connection in the hypothesized model.
DCM implements two models to test a causal hypothesis. The first is a model of
neural dynamics that takes into account the intrinsic connectivity among various regions and the modulation in connectivity in response to experimental manipulations.This model constitutes the hypothesis. The second model is a hemodynamic model, which translates neural activity to hemodynamic response. The algorithm starts with a prior range that the parameters are likely to lie within and the aim of DCM is to adjust both the dynamic and hemodynamic parameters of the model in an iterative manner such that the estimated BOLD signals are maximally similar to the experimentally measured BOLD signals. The estimated parameters are then used to infer the strength of connection among the modeled regions.
Details of the Dynamic Causal Technique are reviewed in greater depth below, in sections that discuss the neuronal dynamic model (Section 2-3-1) and the hemodynamic model that relates neuronal activity to BOLD signal (Section 2-3-2).
Section 2-3-1: Description of the neuronal dynamic model in DCM
DCM implements a differential equation to describe the neural dynamics in a system of
L
interacting cortical regions. The neural state vectorZ =[Z1...ZL] describes the neuronal states at each region. The neuronal states are not direct neurophysiologicalmeasurements but they characterize the mean activity of a region’s entire neuronal population (57).
The “hidden” neural dynamics can then be defined by any differential equation: ) , , ( . θ u z F z = (2-3) (55)
F is a nonlinear function that expresses the influence induced upon each region by activity z in all
L
brain regions and by external input u . θ , is the parameter set of the model, which has to be estimated and whose value is required to infer the strength of coupling among regions.The Taylor expansion of Equation 2-3 would be:
... ) 0 , ( ) , ( 2 0 + ∂ ∂ ∂ + ∂ ∂ + ∂ ∂ + ≈ = ux u x f u u f x x f x f u x f dt dx (2-4)
If we neglect the higher order terms, equation 2-4 would be simplified as:
= + + = m j j jB z Cu u A dt dz 1 ) ( ) ( (2-5) (55) z z A ∂ ∂ = . z z u B j j ∂ ∂ ∂ ∂ = . ) ( u z C ∂ ∂ = .Whereu is the j j input (either stimulus or cognitive set) that enters the system th and propagates through interregional connections. Matrix A contains fixed connectivity among the modeled regions, which is intrinsic to the network of areas and exists in the baseline condition of the experimental design. However, since it is a state that is changed as a function of the experimental manipulations, this intrinsic coupling may be specific to each experiment (55) and dependent on the context of experimental design. B ,...,1 Bm
parameterize the modulation of intrinsic connections by any experimental manipulations. Lastly matrix C depicts the strength of direct driving inputs to the modeled system (e.g., sensory stimulus). The units of all parameters are in hertz (HZ), and thus the inference for strong connection relates to an influence that is expressed quickly in time (55).
] , , [A Bj C
C =
θ is the connectivity or coupling matrix that constitute the hypothesis and we wish to identify.
A main conceptual aspect of DCM concerns the ways experimental inputs should enter the model and cause neuronal responses. Based on the description of dynamics of the interacting regions, the inputs can cause responses in one of two ways (56):
1) They can act directly on some specific anatomical regions, as specified in matrix C. 2) They can evoke a response through modulation of coupling among different anatomical regions, as specified in matrix B.
It is interesting to note that conventional analysis of fMRI data (e.g., GLM) supposes that all inputs have direct access to all brain regions. Thus, conventional analysis assumes that activations observed in all regions are caused directly by experimental inputs, whereas in DCM analysis the modeler specifies the regions in which the inputs might apply their direct effect and how that effect might be propagated by modulation in the intrinsic connectivity pattern.
To further demonstrate how the underlying neuronal response in each region (z ) is
estimated according to this model, an example is given in Figure 2-1. This figure shows an hypothesis of a network comprising of 5 regions (z1 toz5) with 2 inputs (u1and u2). Input 1, is a stimulus acting directly on region 1, while the 2nd input which is a cognitive set, modulates the connection from region 2 to 4 as well as region 3 to 2.
Figure 2-1. Model of neural dynamic (55) (figure is taken with permission)
Therefore in Equation 2-6 below (written in a matrix format) the non-zero elements in matrix A, B, and C specify the modeler’s hypothesis about the structure of the neural network involved. In this way the modeler decides which connections are likely to be present, where the modulation is expected to act, and where it is probable for the direct effect of inputs to exert an effect. After estimation of the parameters, which is discussed in section 2-4, a statistical method is used to determine which of the modeled connections (parameters) are necessary and sufficient to evoke the observed BOLD response.
+ + = 2 1 11 5 1 2 42 2 23 2 55 54 53 45 44 42 35 33 23 22 21 11 5 1 .... 0 . . . 0 . . . . . . . . 0 .. ... 0 ... ... ... ... .. ... 0 .. ... 0 ... 0 ... ... ... ... ... 0 ... ... . . . . . . . u u c z z b b u a a a a a a a a a a a a z z (2-6)