• Aucun résultat trouvé

Développement du modèle de spécificité clinique chez les personnes atteintes de troubles mentaux graves associés à des problèmes de violence et de comportements antisociaux

N/A
N/A
Protected

Academic year: 2021

Partager "Développement du modèle de spécificité clinique chez les personnes atteintes de troubles mentaux graves associés à des problèmes de violence et de comportements antisociaux"

Copied!
235
0
0

Texte intégral

Loading

Figure

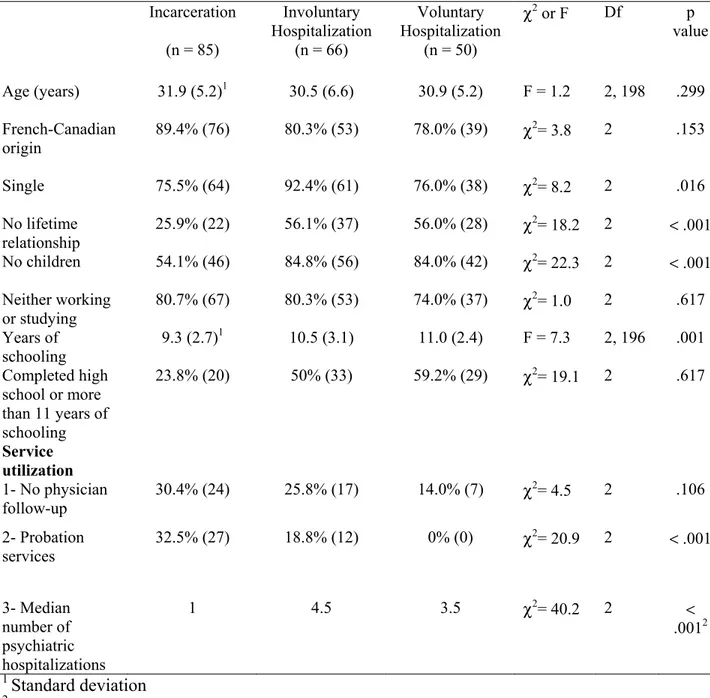
Table 1: Sociodemographics and service utilization at time of incarceration/hospitalization   Incarceration  (n = 85)  Involuntary  Hospitalization (n = 66)  Voluntary  Hospitalization (n = 50)  χ 2  or F Df p value  Age (years)  31.9 (5.2) 1  30.5 (6.6)  30.9 (5.2)  F = 1.2  2, 198  .299  French-Canadian  origin  89.4% (76)  80.3% (53)  78.0% (39)  χ 2 = 3.8  2 .153  Single  75.5% (64)  92.4% (61)  76.0% (38)  χ 2 = 8.2  2 .016  No lifetime  relationship  25.9% (22)  56.1% (37)  56.0% (28)  χ 2 = 18.2  2  < .001  No children  54.1% (46)  84.8% (56)  84.0% (42)  χ 2 = 22.3  2  < .001  Neither working  or studying  80.7% (67)  80.3% (53)  74.0% (37)  χ 2 = 1.0  2 .617  Years of  schooling  9.3 (2.7) 1 10.5 (3.1)  11.0 (2.4)  F = 7.3  2, 196  .001  Completed high  school or more  than 11 years of  schooling  23.8% (20)  50% (33)  59.2% (29)  χ 2 = 19.1  2 .617  Service  utilization  1- No physician  follow-up  30.4% (24)  25.8% (17)  14.0% (7)  χ 2 = 4.5  2 .106  2- Probation  services  32.5% (27)  18.8% (12)  0% (0)  χ 2 = 20.9  2  < .001  3- Median  number of  psychiatric  hospitalizations  1 4.5 3.5 χ2 = 40.2  2  <  .001 2  1  Standard deviation  2  Kruskal-Wallis Test
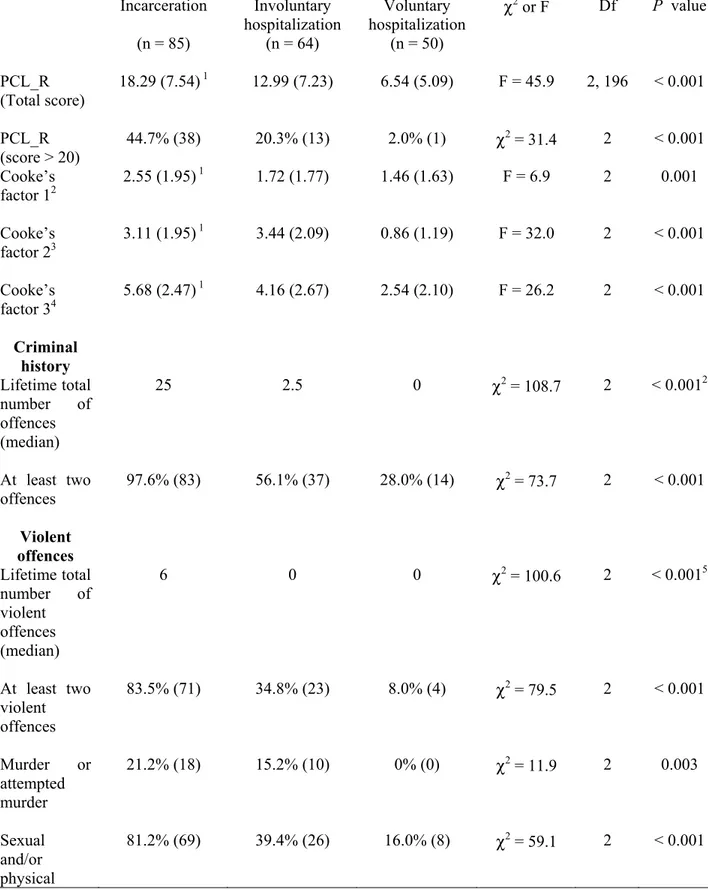
Table 3: Psychopathy and criminal record   Incarceration  (n = 85)  Involuntary  hospitalization (n = 64)  Voluntary  hospitalization (n = 50)  χ 2  or F Df  P  value   PCL_R  (Total score)   18.29 (7.54) 1 12.99 (7.23)  6.54 (5.09)  F = 45.9  2, 196  < 0.001  PCL_R  (score > 20)   44.7% (38)  20.3% (13)  2.0% (1)  χ 2  = 31.4  2  < 0.001  Cooke’s  factor 1 2    2.55 (1.95)  1 1.72 (1.77)  1.46 (1.63)  F = 6.9  2  0.001  Cooke’s  factor 2 3 3.11 (1.95)  1 3.44 (2.09)  0.86 (1.19)  F = 32.0  2  < 0.001  Cooke’s  factor 3 4 5.68 (2.47)  1 4.16 (2.67)  2.54 (2.10)  F = 26.2  2  < 0.001  Criminal  history  Lifetime total  number of  offences  (median)  25 2.5 0 χ2  = 108.7  2 <  0.001 2 At least two  offences   97.6% (83)  56.1% (37)  28.0% (14)  χ 2  = 73.7  2 <  0.001  Violent  offences  Lifetime total  number of  violent  offences  (median)  6 0 0 χ2  = 100.6  2 <  0.001 5 At least two  violent  offences   83.5% (71)  34.8% (23)  8.0% (4)  χ 2  = 79.5  2 <  0.001  Murder or  attempted  murder   21.2% (18)  15.2% (10)  0% (0)  χ 2  = 11.9  2 0.003  Sexual  and/or  physical  81.2% (69)  39.4% (26)  16.0% (8)  χ 2  = 59.1  2 <  0.001
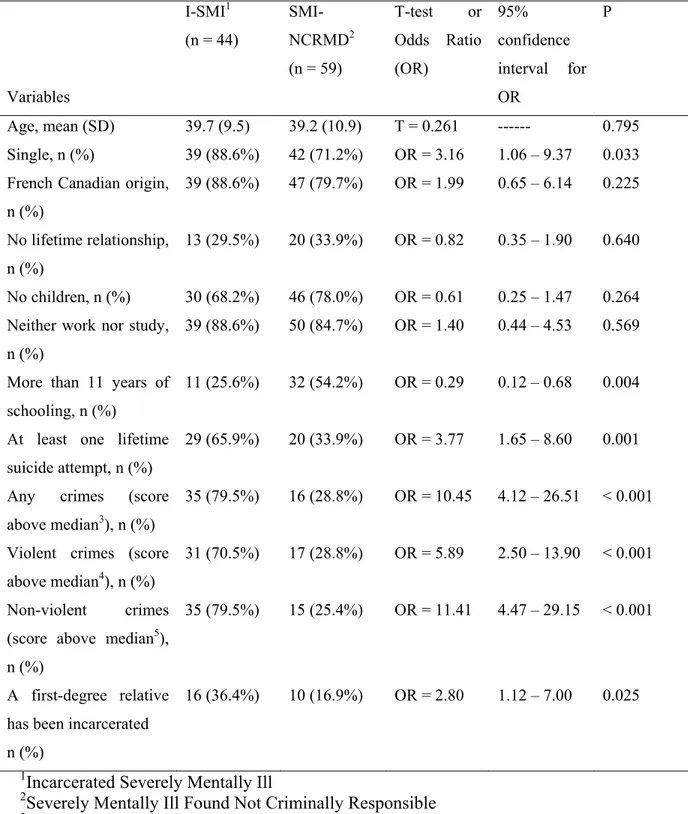
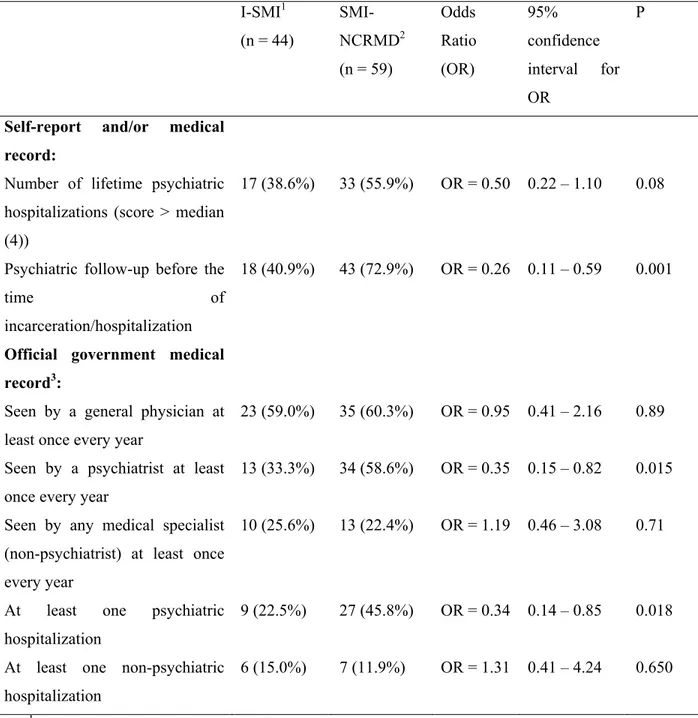
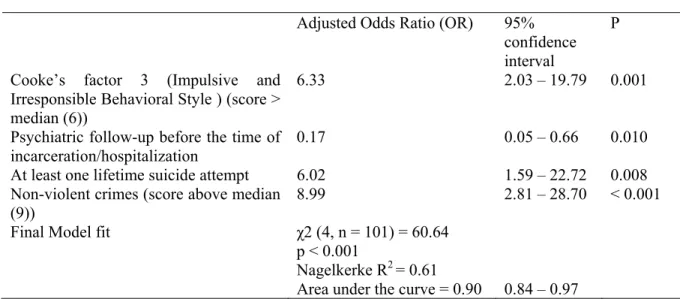
Table 1 : Sociodemographics and criminal history at time of incarceration/hospitalization  Variables  I-SMI 1 (n = 44)   SMI-NCRMD 2 (n = 59)  T-test or Odds Ratio (OR)  95%  confidence  interval for OR   P  Age, mean (SD)  39.7 (9.5)  39.2 (10.9)  T = 0.261  ------  0.795  Single, n (%)  39 (88.6%)  42 (71.2%)  OR = 3.16  1.06 – 9.37  0.033  French Canadian origin,
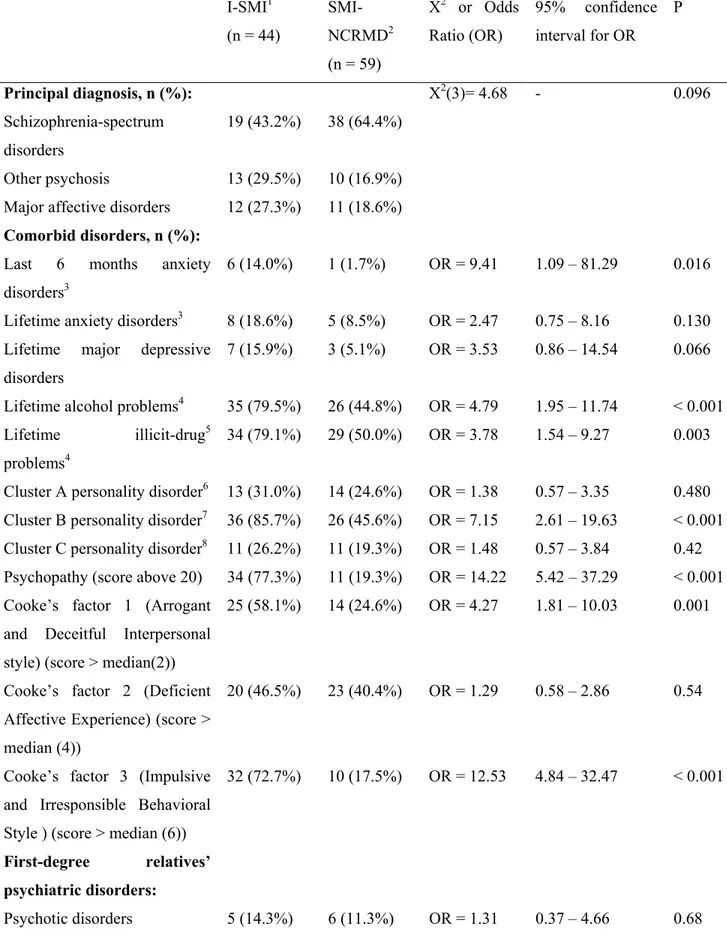
Table 2: Axis I and personality disorders   I-SMI 1 (n = 44)   SMI-NCRMD 2  (n = 59)  Χ 2  or Odds Ratio (OR)  95% confidence interval for OR   P  Principal diagnosis, n (%):  Schizophrenia-spectrum  disorders  Other psychosis
+7

Références

Documents relatifs

68 Graphique 13 : Répartition des enquêtés selon la formation sur le risque biologique 68 Graphique 14 : Répartition du personnel selon l‟utilisation des gants et masques ... 69

Dans notre contexte, devant l’absence de dossier informatisé et de base de donnée (registre), de tous les patients traités par chimiothérapie, exploitable afin de

Dans cette section nous explorons la possibilité de réaliser l’ensemble de la détection d’intention avec des méthodes d’apprentissage profond, c’est à dire, à la fois

C'est lors de cette séance de formation que j'ai pu me rendre compte de l'apport que constitue une formation scientifique dans l'exercice de la fonction de documentaliste à l'INRA,

Later on, Kemmler and co‐workers suggested that the production of ‐Rydberg‐state populations for the collision system O 2+ ( = 9 a.u.) on a carbon foil of 20 µg/cm²

صﺧﻠﻣ وﻛﻧوﺷﻣﯾﺗو ﻲﻟوﻧ رﺎﺑ روﻟوا ﺔﯾرظﻧ ﻰﻠﻋ ادﺎﻣﺗﻋا , ﺔmﻧرﻣﻟا ﺔﯾدﺎﺣﻷا ﺔﻣزﺣﻟا جذوﻣﻧ نإ , ﺔmﻧورﻣﻟا لﺎﻣﻌﺗmﺳﺎﺑ نوﺑرﻛﻟا بﯾﺗ وﻧﺎﻧﻟا ﻲﻓ جاوﻣﻷا رﺎﺷﺗﻧا ﺔﺳاردﻟ

• OPAC and HPAC algorithms: They are respectively the implementation of the optimization algorithms in small and large scale network that optimize the vCDN placement and migration

Furthermore, the file systems specialized for data- intensive workloads target the storage of a limited number of large datasets, in contrast to parallel file systems, which strived