PHASE TRANSITIONS IN DOPED AND UNDOPED LEAD ZIRCONATE TITANATE
PIEZOELECTRIC MATERIALS
A.BOUZID
1,*, Z. ROUABAH
1, M. GABBAY
2and G. FANTOZZI
21
Materials and Electronic Systems Laboratory, MESL, Universityof B. B. Arréridj, Algeria.
2
Laboratoire MATEIS, INSA de Lyon, France.
E-mail : a_bouzid@hotmail.com
Abstract
The study of the anelastic behaviour versus temperature at medium and low frequencies for undoped and doped lead zirconatetitanate –PZT- reveals the presence of two peaks P1 and P2.
According to the phase diagrams established for PZT materials, P1 peak could be related to the Curie
transition between tetragonal ferroelectric phase and the cubic paraelectric phase, whereas the P2
peak could be related to the morphotropic phase transition between rhombohedral and tetragonal ferroelectric phases. Both P1and P2 peaks evolutions are in accordance with several existing literature
models for explaining the first order phase transition. The introduction of potassium and niobium dopants changes the nature of the phase transition process.
Keywords:PZT ceramics, Mechanical losses, Phase transition, Potassium doping, Niobium doping.
Résumé
L’étude du comportement anélastique en fonction de la température aux moyennes et basses fréquences pour des Zircono-titanates de plomb –PZT non dopées et dopées révèlent la présence de deux pics P1 et P2. En se basant sur le diagramme de phase des PZT, le pic P1 peut être relié à la
transition de Curie entre la phase ferroélectrique quadratique et la phase cubique paraélectrique, cependant le pic P2 peut être relié à la transition morphotropique entre les phases ferroélectriques
rhomboédrique et quadratique. Les évolutions des deux pics P1 et P2sont en bon accord avec les
différents modèles existant dans la littérature et expliquant les transitions de phase du premier ordre. L’introduction des dopants potassium et niobium change la nature du processus de la transition de phase.
Mots clés : Céramiques PZT, Pertes mécaniques, Transition de Phase, Dopage au potassium,
Dopage au niobium.
I. INTRODUCTION
Lead zirconatetitanate piezoelectric materials are widely used as sensors and actuators in several daily applications but seldom in their simple chemical formulation. They are rather modified by the introduction of substitutionals in the A or B sites of the perovskite structure ABO3. The role of these
doping agents is generally the improvement of the materials properties for their adaptation to quite specific applications. PZT phase diagrams1-3 show a zone where the rhombohedral and tetragonal ferroelectric phases coexist which is commonly called morphotropic phase boundary (MPB). Noheda et al.4,5, Ragini et al.6 have reported the coexistence of also a monoclinic phase with the tetragonal phase in the MPB.
Most industrial applications are within this zone, because the majority of piezoelectric and dielectric properties present optimal values 7,8.
Previous studies of the anelastic behaviour of PZT near the MPB by mechanical spectroscopy in the Hz frequency range showed relaxation phenomena due to the interaction between ferroelectric domain walls and point defects such as oxygen vacancies9,10 and the presence of phase transitions11,12.
The introduction of dopant such as K1+ in
the A-sites of the perovskite structure as a substitute for Pb2+ increases the oxygen vacancies concentration when oxygen ions leave their sites to maintain the electro-neutrality disturbed by the deficit charge in the A-sites. The PZT doped with an acceptor element (of lower valence) are called hard piezoelectric materials.
While the introduction of Nb5+ in substitution of the (Zr,Ti)4+ couple in the B-sites of the
perovskite structure decreases the oxygen vacancies concentration. The PZT doped with a donor element (of higher valence) are called soft piezoelectric materials.
In the present paper, mechanical losses and associated Young/ Shear moduli are studied at low and medium frequencies for undoped PZT 54/46, PKZT 0.5/54/46 and PKZT 1/54/46 doped respectively with 0.5 at. % and 1 at. % of potassium, PNZT 1/54/46 and PNZT 2/54/46 doped respectively with 1 at. % and2 at.% of niobium.
II. MATERIALS PROCESSING AND EXPERIMENTAL PROCEDURE
By the solid reaction method undoped, potassium doped and niobium doped materials with a chemical formulation (Zr/Ti = 0.54/0.46) close to the morphotropic phase boundary (MPB) were processed. The starting powders of PbO, ZrO2, TiO2and (K2CO3 or Nb2O5) are
mixed and calcined at 900 °C, the obtained powder is isostatically compacted and sintered at 1250 °C for four hours in the presence of lead zirconate as an atmosphere powder13 in order to avoid the PbO loss at high
temperatures during the sintering.
The mechanical losses Q-1 and Young's
modulus M as function of temperature have been measured by an experimental system at medium (kilohertz range) frequencies by the transversal flexion vibration.
The mechanical losses Q-1 and associated shear modulus G versus temperature were measured in the Hz frequency range respectively at 1; 0.3; 0.1 Hz by using a torsion inverted pendulum, under vacuum between 25 and 500 °C at a heating rate of 1 °C/min. The samples for both medium and low frequencies experiments were rectangular bars with dimensions of 40*5*1 mm3. More details on the measurement method could be found in our previous publications 14,15.
III. RESULTS III.1 Materials characterisation
The relative density and the average grain size for both processed materials are showed in
Table.1. Both potassium and niobium have an
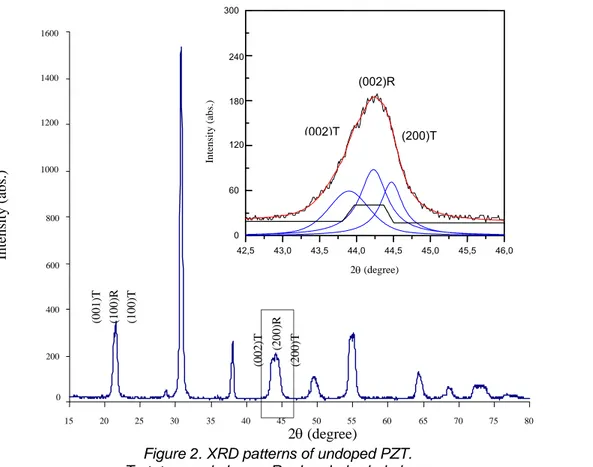
inhibitory effect on the grain size growth (Fig.1). X-ray patterns were carried out at room temperature with a step of 0.05° and a scanning speed of 2°/min from 2θ equal 20° to 70°. The
PKZT 1/54/46 (φmoy: 5µm) PZT 54/46 (φmoy: 10µm)
PNZT 2/54/46 (φmoy: 2µm)
diffraction lines were split into triplets indicating the coexistence of both tetragonal and rhombohedral ferroelectric phases for both compositions as expected from the phase diagram.16,17(see Fig.2 for undoped PZT).
Table1. Relative density and average grain size for processed materials.
Materials Relative Density (%) Average grain size (µm) PZT 54/46 94.7 10 PKZT0.5/54/46 94.2 7 PKZT1/54/46 93.5 5 PNZT1/54/46 95.2 4 PNZT2/54/46 95.8 2
III.2 Anelastic behaviour at medium frequencies
The mechanical losses Q-1(T) and
associated Young's modulus M(T) for both materials (Fig.3), show a sharp peak P1 and a
corresponding Young’s modulus sharp M1
minimum. The P1 peak is preceded by a PR
shoulder. No peak on the Q-1(T) curve corresponds to the smooth Young's modulus M2
minimum.
According to the minima temperatures on one part and to the Jaffe phase diagram3 and its revisited version14,16 on the other part, the M1
minimum could be related to the Curie transition between cubic paraelectric phase and
2θ (degree) 0 200 400 600 800 1000 1200 1400 1600 15 20 25 30 35 40 45 50 55 60 65 70 75 80 In ten sity (ab s.) (002) T (200) R (200) T (001) T (100) R (100) T 42,5 43,0 43,5 44,0 44,5 45,0 45,5 46,0 0 60 120 180 240 300 (200)T (002)R (002)T In tens ity (ab s.) 2θ (degree)
Figure 2. XRD patterns of undoped PZT. T : tetragonal phase ; R : rhombohedral phase
Materials
T
(C-T)(°C)
T
(T-R)(°C)
(∆ T
Tetr) = T
C-T-T
T-R(°C)
PZT 54/46
380
175
205
PKZT 0.5/54/46
370
153
217
PKZT 1/54/46
373
125
248
PNZT 1/54/46
360
200
160
PNZT 2/54/46
345
210
135
Table 2. Phase transition temperatures deduced from M(T) curves and tetragonal
t t idth(
∆T
tetragonal ferroelectric phase, whereas, the M2
minimum could be related to the morphotropic phase transition between tetragonal and rhombohedral ferroelectric phases. (Table.2)
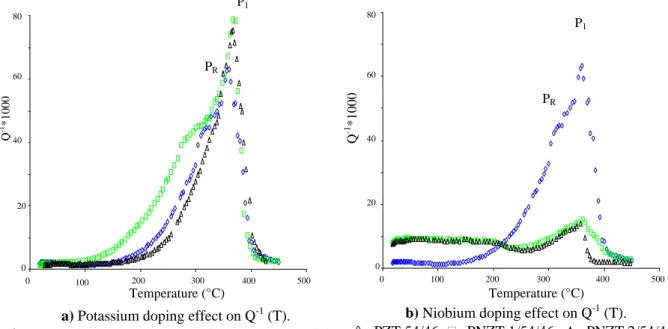
III.2.1 Potassium doping effect
The introduction of potassium increases slightly the height of the P1 peak while the peak
temperature remains stable. The PR shoulder
remains stable in height, but it shifts towards the low temperatures by doping with 0.5 at. % and shifts towards high temperatures by few degrees when the potassium doping with 1 at. %. (Fig.3).
The introduction of potassium increases the width of the tetragonal ferroelectric phase range.
III.2.2 Niobium doping effect
Niobium introduction decreases strongly the level of both P1 peak and PR shoulder.
Whereas, at temperature under 200 °C the mechanical losses of niobium doped materials are more important than those of undoped materials. (Fig.3)
The introduction of niobium decreases the width of the tetragonal ferroelectric phase range.
III.3 Anelastic behaviour at low frequencies 0 20 40 60 80 0 100 200 300 400 500 Temperature (°C) Q -1*10 00 P1 PR
a) Potassium doping effect on Q-1 (T).
◊ : PZT 54/46 ; : PKZT 0.5/54/46; ∆ : PKZT 1/54/46. Temperature (°C) M (GPa) M1 M2 50 70 90 110 130 0 100 200 300 400 500
b) Niobium doping effect on Q-1 (T).
◊ : PZT 54/46 ; : PNZT 1/54/46 ; ∆ : PNZT 2/54/46. 0 20 40 60 80 0 100 200 300 400 500 Temperature (°C) Q -1 *1000 P1 PR
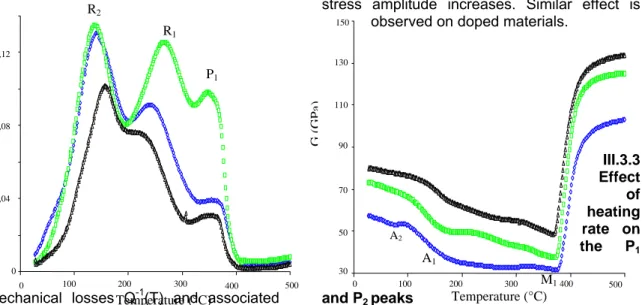
c) Young modulus for PZT 54/46
Mechanical losses Q-1(T) and associated shear modulus G(T) for undoped PZT and potassium doped (Fig.4), show the Curie transition peak P1 and its correlated modulus
minimum M1, and two other peaks R1 and R2
with two associated modulus anomalies A1 and
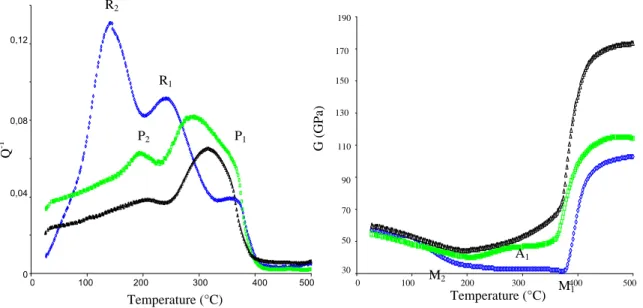
A2. Fig.5 for undoped PZT and niobium doped
materials, shows the P1 peak and its correlated
modulus minimum M1, the R1 peak and its
associated modulus anomalies A1, and the
morphotropic phase transition P2 peak –
between tetragonal and rhombohedral ferroelectric phases- and its correlated modulus minimum M2. R1 and R2 peaks are relaxation
phenomena due to the interaction between ferroelectric domain walls and point defects such as oxygen vacancies9,10,15. In the present study we are interested only by the evolution of P1 and P2 peaks.
III.3.1 Effect of frequency on the P1 and P2
peaks
When the solicitation frequency increases, the height of both peaks decreases and they remain stable in temperature. Fig.6 shows the evolution of Q-1
max.(P1) and Q-1max.(P2) as a
function of the frequency inverse (1/f) for the undoped PZT. Similar effect is observed on doped materials.
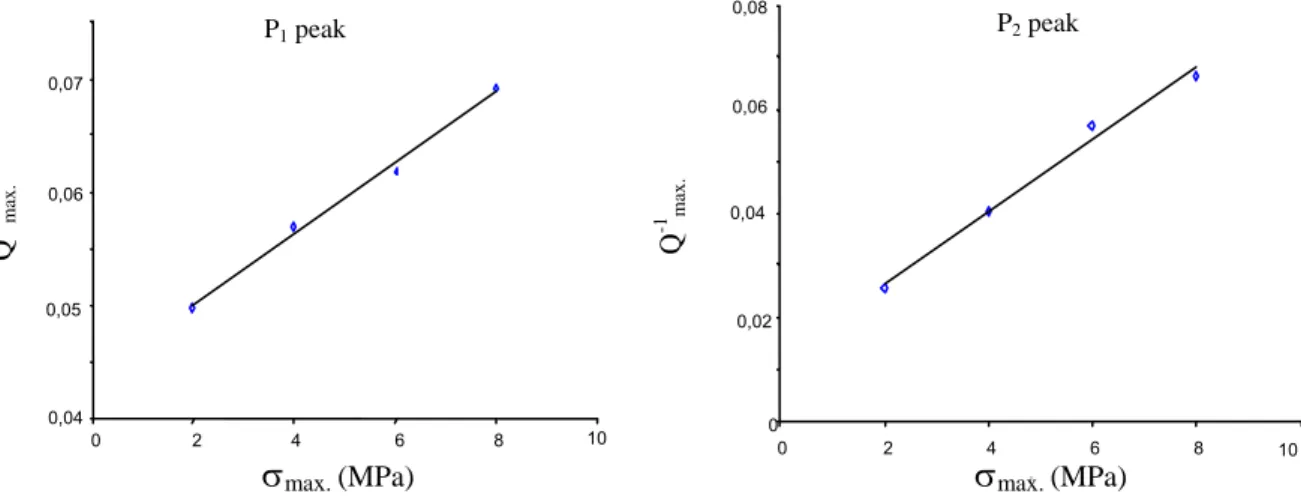
III.3.2 Effect of stress amplitude on the P1
and P2 peaks
Fig.7 represents the evolution of Q-1max.(P1)
and Q-1
max.(P2) as a function of the applied
stress amplitude σmax.for the undoped PZT. The
height of both P1 and P2 peaksincreases when
stress amplitude increases. Similar effect is observed on doped materials.
III.3.3 Effect of heating rate on the P1 and P2 peaks
When the heating rate increases, the height of both P1 and P2 peaksincreases.Fig.8 shows
the evolution of Q-1max.(P1) and Q-1max.(P2) as a
function of heating rate (
T&
) for the undoped PZT. Similar effect is observed on doped materials.IV. DISCUSSION
Our discussion will treat only the phase transition peaks P1 and P2.
The height of both P1 and P2 peaksis
directly proportional to stress amplitude and heating rate but inversely proportional to frequency. Such evolution is very similar to that of the first order phase transition.
Among the several theoretical models existing in literature to describe the first order phase transition reviewed by Fantozziet al.18, one can notice a qualitative agreement of the evolution of our P1 and P2 peaks with the
theoretical models of Zhang et al.19, De Jonghe et al.20
Zhang et al., proposed a model for explaining the transition peak in BaTiO3
semi-conducting materials and in which it is suggested that the mechanical losses are the result of two components:
- A transitory component, measured during heating and cooling, Qt-1. This component
depends on frequency and heating rate and associated to the phase mobile interfaces. - An equilibrium (or stationary) component Qs-1,
measured at a fixed temperature (
T&
= 0) and associated to the phase immobile interfaces. The total internal friction is given by the following relation: 0 0,04 0,08 0,12 0 100 200 300 400 500 30 50 70 90 110 130 150 0 100 200 300 400 500Figure 4.Potassium doping effect at 1Hz
.
◊ : PZT 54/46 ; : PKZT 0.5/54/46 ; ∆ : PKZT 1/54/46. Temperature (°C) Temperature (°C) G( G P a) Q -1 P1 R1 R2 M1 A2 A1Q-1 = Qt -1 + Qs -1 = A’(F) α2 (ω)(
T&
/ω)n + B’(F) α2 (ω) ω (1)Where F is the volume fraction of the produced phase,
andα (ω) could be written like following: α (ω) = (2ε0Q
-1
)/ (∆M/M) = α’ω-P (2) With (0 < P <1)
α’ is a constant,
ε0 represents the transitory phase deformation,
∆M/M is the change in modulus. In our case, the evolution of Q-1
max.(P1) and Q -1
max.(P2) function of (
T&
/ω)is in agreement withthe proposed formulation (Fig.8).
So the Zhang et al. model takes into account frequency and heating rate but not stress amplitude.
De Jonghe et al. proposed a model in which the quantity of transformed phase per unit of time
take into account both heating rate
T
.
and applied stress amplitudeσ, however the stress contribution is not available before a critical stress σC.The quantity of transformed phase per unit of time (
m
.
= f(T
.
,σ)) is given by the relation :t
m
t
T
T
m
dt
dm
∂
∂σ
∂σ
∂
∂
∂
∂
∂
+
=
The following relation is proposed to assess the internal friction:
⎥
⎥
⎦
⎤
⎢
⎢
⎣
⎡
⎪⎭
⎪
⎬
⎫
⎪⎩
⎪
⎨
⎧
⎟⎟
⎠
⎞
⎜⎜
⎝
⎛
−
⋅
⋅
⋅
+
⋅
⋅
=
− 3 0 c 0 11
3
4
f
1
2
σ
σ
∂σ
∂
σ
∂
∂
∂
∂
π
m
t
T
T
m
A
Q
30 50 70 90 110 130 150 170 190 0 100 200 300 400 500 0 0,04 0,08 0,12 0 100 200 300 400 500Figure 5.Niobium doping effect at 1Hz.
◊ : PZT 54/46 ; : PNZT 1/54/46 ; ∆ : PNZT 2/54/46 Temperature (°C) Temperature (°C) G (GPa) Q -1 R2 R1 P1 M1 M2 A1 P2 0,02 0,025 0,03 0,035 0,04 0,045 0,05 0 2 4 6 8 10 12 1/f (1/Hz) P1 peak 0,02 0,025 0,03 0,035 0,04 0,045 0,05 0 2 4 6 8 10 12 1/f (1/Hz) P2 peak
Figure 6.Q-1max.evolution versus (1/f) for P1 and P2 peaks for undoped PZT.
Q -1 ma x. Q -1 ma x.
Where: A is a material constant,
T
m
∂
∂
Represents the relative transformed phase variation per unit of time,
t
T
∂
∂
is the heating rate,
fis the frequency,
σ0is the applied stress amplitude,
∂σ
∂
m
Represents the relative transformed phase variation per unit of stress; this term is rather related to the interfaces mobility.
Accordingly to the above models, the effect of potassium and niobium doping could be interpreted by the change of the nature of the transformed phase when doping. The change in the chemical composition of the starting transformed phase unit (or cell) by the introduction of aliovalent dopants could have as
a result the change of the kinetic and the strength of the phase transition process.
The presence of the PR shoulder is not clearly
understand, we thought that it could be related to the anelastic phenomena represented at low frequencies by one or both R1 and R2 peaks.
Further investigations are needed to better understand the PR shoulder.
V. CONCLUSION
According to the P1 and P2 peaks
temperatures and to the phase diagrams established for PZT solid solutions, one can notice the following considerations:
- The P1 peak is attributed to the Curie
transition –between cubic paraelectric phase and tetragonal ferroelectric phase- accompanied losses.
- The P2 peak is attributed to the losses
occurring during the phase transition between tetragonal and rhombohedral ferroelectric phases or to a more complex transition where
0 0,02 0,04 0,06 0,08 0 2 4 6 8 10 .
Figure 7.Q-1max.evolution versus stress amplitude (
σmax.
) for P1 and P2 peaks for undoped PZT.σ
max. (MPa) 10 0,04 0,05 0,06 0,07 0 2 4 6 8 . P1 peak Q -1 max. P2 peak Q -1 max.σ
max. (MPa) 0,06 0,064 0,068 0,072 0 1 2 3 4 5 Q -1 max.T&
(°C/min)Figure 8.Q-1max.evolution versus heating rate (
T&
)for P1and P2peaks for undoped PZT.P1 peak 0,01 0,02 0,03 0,04 0 1 2 3 4 5
T&
(°C/min) Q -1 max. P2 peakthe monoclinic phase coexist with the tetragonal phase as shown by Noheda et al.4,5 and ,Ragini et al6.
- Both P1 and P2 peaks present a great
similitude with a first order phase transition internal friction peak.
The introduction of potassium and niobium dopants changes the chemical composition of the starting transformed phase unit (or cell) and induces as a result the change of the nature of the phase transition process but the transition remains of first order.
REFERENCES
[1] A. Babulescu, Eva Barbulescu, D. Darb, Phase transition in PZT solid solutions, Ferroelectrics, Vol. 47, (1983), pp. 221-230. [2] S.K. Mishra, A.P. Singhi, D. Pandey, Thermodynamic nature of phase transitions in Pb(ZrxTi1−x)O3 ceramics near the morphotrpic phase boundary. II. Dielectric and piezoelectric studies, Philos. Mag., Vol. 76, N°2, (1997), pp. 213-226.
[3] B. Jaffe, W.R. Cook, H. Jaffe, Piezoelectric ceramics, London, Academic press (1971), p. 317.
[4] Noheda, B., Cox, D.E., Shirane, G., Gonzalo, J.A., Cross, L.E. and Park, S-E., A monoclinic ferroelectric phase in the Pb(Zr1−x Tix)O3 solid solution, Appl. Phys. Lett. Vol. 74 (14), 1999, pp. 2059-2061.
[5] Noheda, B., Gonzalo, J.A., Cross, L.E., Guo, R., Park, S-E., Cox, D.E. and Shirane, G., Tetragonal-to-monoclinic phase transition in a ferroelectric perovskite: the structure of Pb(Zr0.52Ti0.48)O3, Phys. Rev. B, Vol. 61 (13), 2000, pp. 8687-8695.
[6] Ragini, Rajeev Ranjan, Mishra, S.K. and Pandey, D., Room temperatre structure of Pb(ZrxTi1−x)O3 around the morphotropic phase boundary region: a Rietveld study, J. Appl. Phys., Vol. 92(6), 2002, pp. 3266-3274. [7]M.R. Soares, A. M. R. Senos, P.Q. Mantas, Phasecoexistenceregionanddielectricproperties of PZT ceramics, J. Euro. Ceram. Soc., Vol. 20, (2000), pp.321-334.
[8] B. Jaffe, R.S. Roth, S. Marzullo, Piezoelectric properties of lead zirconate–lead titanate solid solution ceramic ware, J. Res. Nat. Bur. Stand, Vol. 55, N °5, (1955), pp.239-254.
[9] V.S. Postnikov, V.S. Pavlov, S.K. Turkov, Internal friction in ferroelectrics due to interaction of domain boundaries and point defects, J. Phys. Chem. Solids, Vol. 31, (1970), pp. 1785-1791.
[10] C. Wang, Q.F. Fang, Y. Shi, Z.G. Zhu, Internal friction study on oxygen vacancies and domain walls in Pb(Zr, Ti)O3,Mater. Res. Bull., vol. 36, (2001), pp. 2657-2665.
[11] E.M. Bourim, H. Tanaka, M. Gabbay, G. Fantozzi, Internal friction and dielectric measurements in lead zirconatetitanate ferroelectric ceramics, Jpn. J. Appl. Phy., Vol. 39, (2000), pp. 5542-5547.
[12]A.Bouzid, M. Gabbay, G. Fantozzi, Potassium doping effect on the anelastic behaviour of lead zirconate-titanate -PZT- near the morphotropic phase boundary Defects and Diffusion in Ceramics, Vol. 206, (2002), pp. 147-150.
[13] A.I. Kingon, J.B. Clark, Sintering of PZT ceramics. I. Atmosphere controlling, J. Am. Ceram. Soc., Vol. 66, N° 4, (1983), pp. 253-260.
[14] A. Bouzid, E.M. Bourim, M. Gabbay, G. Fantozzi, PZT phase diagram determination by measurement of elastic moduli, J. Euro.Ceram.Soc., Vol 25, (2005), p.3213-3221. [15] A. Bouzid, M. Gabbay, G. Fantozzi, Contribution to the comprehension of dissipation phenomena in lead zirconatetitanate :aliovalent doping effect, Mat. Sci. and Engineering A, Vol 370, (2004), p.123-126. [16] M.R. Soares, A. M. R. Senos, P.Q. Mantas, Phase coexistence region and dielectric properties of PZT ceramics, J. Euro. Ceram. Soc., Vol. 20, (2000), pp. 321-334.
[17] A. Boutarfaia, S. E. Boudaren, A. Mousser, E. Bouaoud, Study of phase transition line of PZT ceramics by X-ray diffraction, Ceram. Int., Vol. 21, (1995), pp. 391-394,
[18] G. Fantozzi, R. Schaller, G. Gremaud, Mechanical Spectroscopy Q-1 2001, Trans Tech
Publication (2001), p.361-381.
[19] J.X. Zhang, W. Zheng, , P.C.W. Fung, K.F. Liang, Internal friction study of transformation dynamics in BaTiO3 ceramics, J. of Alloys and Compounds, Vol. 211/212, (1994), pp.378-380.
[20] W. DeJonge, , R. De Batist, , L. Delaey,Factors affecting the internal friction peak due to thermoelastic martensitic
transformation,Scripta Metal., Vol. 10, N° 2, (1976), pp. 1125-1128.