O
pen
A
rchive
T
OULOUSE
A
rchive
O
uverte (
OATAO
)
OATAO is an open access repository that collects the work of Toulouse researchers and
makes it freely available over the web where possible.
This is an author-deposited version published in :
http://oatao.univ-toulouse.fr/
Eprints ID : 10198
To link to this article : DOI:10.1051/kmae/2013036
URL :
http://dx.doi.org/10.1051/kmae/2013036
To cite this version : Bernadet, Caroline and Touron-Poncet, Heliott and Desrosiers, C. and Compin,
Arthur and Bargier, Nicolas and Céréghino, Régis. Invertebrate distribution patterns and river
typology for the implementation of the water framework directive in Martinique, French Lesser
Antilles. (2013) Knowledge and Management of Aquatic Ecosystems (n° 408). pp. 1-15. ISSN
1961-9502
Any correspondance concerning this service should be sent to the repository
administrator:
[email protected]
lnvertebrate distribution patterns and river typology
for the implementation of the water framework directive
in Martinique, French Lesser Antilles
C. Bernadet{
1L{2),{3),H. Touron-Poncet{
1L{2),{3),C. Desrosiers{
1L{2),{3),A. Compin{
1L{2),N. Bargier
3),{4),R. Céréghino{
1L{2)*Key-words:
biological indicators, overseas regions, reference conditions, river classification, tropical riversABSTRACT
Over the past decade, Europe's Water Framework Directive provided com-pelling reasons for developing tools for the biological assessment of fresh-water ecosystem health in member States. Yet, the lack of published study for Europe's overseas regions reflects minimal knowledge of the distribu-tion patterns of aquatic species in Community's outermost areas. Benthic invertebrates {84 taxa) and land-cover, physical habitat and water chem-istry descriptors {26 variables) were recorded at fifty-one stations in Mar-tinique, French Lesser Antilles. Canonical Correspondance Analysis and Ward's algorithm were used to bring out patterns in community structure in relation to environ mental conditions, and variation partitioning was used to specify the influence of geomorphology and anthropogenic disturbance on invertebrate communities. Species richness decreased from headwa-ter to lowland streams, and species composition changed from northern to southern areas. The proportion of variation explained by geomorpho-logical variables was globally higher than that explained by anthropogenic variables. Geomorphology and land cover played key roles in delineating ecological sub-regions for the freshwater biota. Despite this and the small surface area of Martinique {1 080 km2), invertebrate communities showed a clear spatial turnover in composition and biological traits {e.g., insects, crustaceans and molluscs) in relation to natural conditions.
RÉSUMÉ
Patrons de distribution des invertébrés et typologie des rivières pour la mise en œuvre de la Directive Cadre Européenne sur l'Eau en Martinique, Antilles Françaises
Mots-clés:
indicateurs biologiques, outre-mer,Au cours de la dernière décennie, la Directive Cadre Européenne sur l'Eau a promu le développement d'outils de bioindication de la qualité des eaux douces au sein des états membres. L'absence de travaux sur l'Outre-Mer révèle une connais-sance minimale de la distribution des espèces aquatiques dans ces régions de l'Europe. Les invertébrés benthiques (84 taxons), ainsi que des variables décrivant l'utilisation des terres, l'habitat physique et la chimie de l'eau (26 variables) ont été
(1) Université de Toulouse, /NP, UPS EcoLab (Laboratoire Ecologie Fonctionnelle et Environnement), 118 Route de Narbonne, 31062 Toulouse, France
(2) CNRS, EcoLab, 31062 Toulouse, France
(3) Asconit Consultants Caraibes, Zl Champigny, 97224 Ducos, Martinique, France
(4) Asconit Consultants, Parc Scientifique Tony Garnier 6-8 espace Henry Vallée, 69366 Lyon Cedex 07, France
conditions de référence, classification, rivières tropicales
quantifiés sur 51 stations en Martinique (Antilles Françaises). Des analyses cano-niques et l'algorithme de Ward ont permis de dégager des patrons d'organisation des communautés en relation avec les conditions environnementales, puis une partition de variance a permis de préciser l'influence de la géomorphologie et des perturbations anthropiques sur ces patrons. La richesse spécifique décroît des cours d'eau de tête de bassin à la plaine, et la composition des communautés change du nord au sud de l'île. La proportion de variance expliquée par les va-riables géomorphologiques est globalement supérieure à celle expliquée par les variables anthropiques. La géomorphologie et la couverture végétale définissent les sous-régions écologiques pour la faune aquatique. Les îles des Caraïbes ont des pools d'espèces pauvres; pourtant, et malgré la petite surface de la Marti-nique (1 080 km2), les communautés d'invertébrés montrent une variabilité spatiale en terme de composition et de traits (insectes, crustacés, mollusques) en relation avec les conditions locales.
INTRODUCTION
lntended to protect al/ surface waters in Member States, Europe's Water Framework Direc-tive {WFD, 2000/60/EC) has provided compelling reasons for developing practical tools for the biological assessment of freshwater ecosystem health. According to the WFD guidel ines, ecological health must be defined in terms of similarity to an undisturbed ("reference") state. The Reference Condition Approach (RCA, Bai ley et al., 2003) notably implies the characteriza-tion of biological communities (fish, invertebrates, diatoms, phytoplankton, plants) expected to occur where there is (al most) no anthropogenic disturbance (Chaves et al., 2011 ; Wall in et al., 2003). Geomorphological, physical, and chemical attributes of freshwater systems have to be associated with biological features too when defining undisturbed conditions. Recent examples of RCA-based works in continental Europe can be fou nd in Gabriels et al. (201 0) (Belgium), Delgado et al. (201 0) (Spain), Kelly et al. (2012) (lreland), and Mondy et al. (2012) (France).
The European Union (EU) has 34 overseas territories which belong to six member states (Denmark, France, the Netherlands, Portugal, Spain, and the United Kingdom). Although they occur across a range of biogeographie areas from polar to tropical latitudes, these territories are subjected to EU's water legislation too. ln other words, overseas regions have the same water policy objectives as the continental ones, and must fulfil WFD's goals. To date however, there has been no published WFD-compliant method for river bioassessment in any European overseas region, and even preliminary work (i.e., stream classifications based on river biota, identification of reference conditions) is lacking. Reference conditions and metrics designed for the European continent cannot be transposed to overseas regions, at least for two ma-jor reasons. Firstly, biogeographie differences in community composition/structure preclude the adaptation of current metrics. For instance, entire indicator groups are absent from sorne biogeographie areas, e.g., stoneflies (a particularly sensitive group of taxa in Europe) are ab-sent in the Lesser Antilles (Caribbean Sea), Macaronesia (Atlantic Ocean) and the Reunion (lndian Ocean), and are scarce in French Guiana (South-America) (ENSAT, 1995; Hughes,
2005; Stark, 2000; Starmühlner, 1977). Secondly, and perhaps more importantly, limited sci-entific effort has been directed at characterizing how rivers in overseas Europe differ in terms of biological communities, and how these communities respond to changes in abiotic con-ditions. As a consequence, tolerance to water pollution and Ecological Quality Ratios (ratios between observed biological parameters and the expected values under reference conditions (Anonymous, 2003)) cannot be defined yet.
The present study takes a step towards the development of WFD-compliant bioassess-ment tools in overseas Europe. lt was conducted in Martinique (French Lesser Antilles, Caribbean), one of France's eleven inhabited overseas territories. Martinique freshwaters suffer from chemical-physical degradation due to human population growth on a cramped territory (400 000 inhabitants in 2009, 1100 km2; INSEE, 2009). Routine surveys conducted
by local consultancies and environmental agencies revealed changes in river invertebrate communities in relation to local physical and chemical conditions {Asconit Consultants, Un-published data). However, we still don't know how geomorphological variables influence in-vertebrate distribution patterns in Carribean islands, and to what extent anthropogenic distur-bance overrides geomorphological contrais on the distribution patterns of macroinvertebrates at the local {station) to regional {island) scale {Huryn and Wallace, 1987 ; Sand in and Johnson,
2000; Wu and Legg, 2007). To address this question, we sampled invertebrate communities at 51 stations distributed across Martinique's stream systems, and we used an a posteriori inductive approach to bring out patterns of macroinvertebrate communities in relation to a set of physical, chemical and land-caver variables. Variance partitioning was used to tease out the affects of geomorphology {e.g., elevation, riverbed substrate) and anthropogenic impacts {land-caver, water chemistry). We discuss freshwater invertebrate diversity and distribution in the context of water policy and make suggestions for future directions.
MATERIAL AND METHODS
STUDYAREA
Martinique is a volcanic island of the French Lesser Antilles {surface area
=
1 080 km2). The North of the island is mountainous ("Montagne Pelée" volcano, elevation=
1397 m a.s.l.) and covered by wet forest, the South area consists in plains and hills {maximum eleva-tion=
507 m a.s.l.) mainly covered by agricultural and urban lands {Fort-de-France capital city, tourist resorts). Running waters consist in 70 streams, mostly concentrated in the North area. Watersheds are 15 km2 on average {maximum area=
116 km2). The climate is tropical moist, the mean annual air temperature is 27oc.
Rainfalls range from <1 000 mm per year in the South to > 1 0 000 mm per year on the northern mountaintops. A dry season {"Carême") occurs between December and April.ENV/RONMENTAL VARIABLES
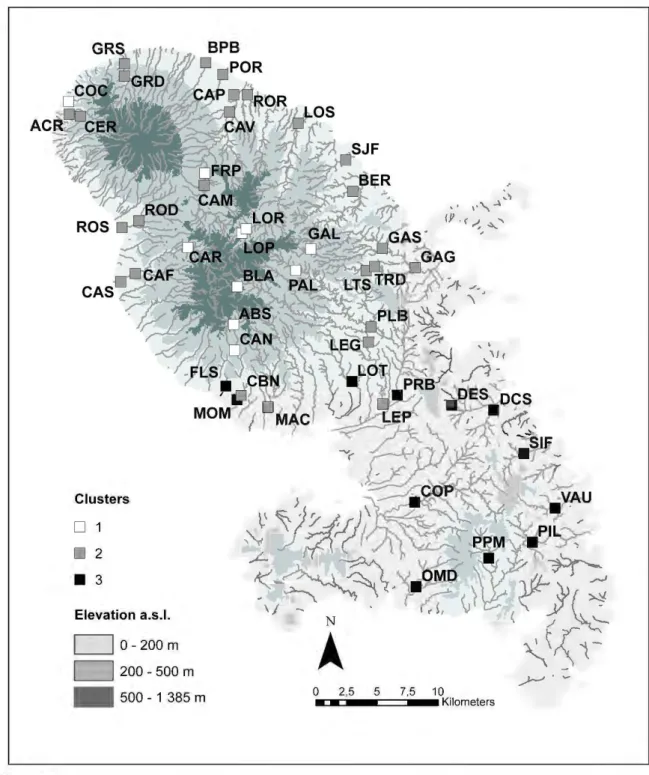
Fifty-one stations were sampled during the dry season in April2010 {Figure 1). These stations were evenly distributed and represented 45 rivers {the island has a total of 70 referenced rivers). Ali unimpacted {reference) stations belonged to the network of reference stations for-mally defined by the regional Environmental Administration (Direction de l'Environnement, de l'Aménagement et du Logement, Martinique) as per WFD ru les. Stations subjected to anthro-pogenic impacts {urban, industrial or agricultural runoff, wastewater treatment plants) were selected based on field observation and on water chemistry analyses provided to us by the above-mentioned Administration.
Each station was characterized using fourteen chemical variables, nine physical variables and three land-caver variables. Three physical-chemical variables were directly measured in the field using a multiparametric Hydrolab Quanta probe: conductivity {f.tS·cm-\ pH, and dis-solved oxygen {mg·L -1). Water sam pies were also collected at the same ti me of invertebrate sampling, transported to the laboratory on ice and frozen to be analyzed by the Laboratoire Départemental de la Drôme, France. The following chemical variables were measured fol-lowing standard methods summarized in ASCONIT {2012): turbidity {NTU), suspended solids, ammonium, nitrate, sulfate, bicarbonate, chloride, silice, total phosphorus and potassium, and biological oxygen demand {mg·L-1).
The percentage composition of substrate types was determined at each sampling station as: %1itter, %submerged vegetation, %submerged roots, %sand {particle size <2 mm), %gravels {2-25 mm), %pebbles {25-250 mm), %boulders {>250 mm), and %rocky outcrops. Together with elevation above sea level {m a.s.l.), these physical variables relate the location of sam-pling stations along the upstream-downstream river continuum.
Figure 1
Clusters
D
CJ 2
• 3
Elevation a.s.l.
c=J
0-200 mc=J
200 -500 m . . 500-1385m NÀ
,,
.
.
''"
...\ IP ·( ~ ...._"' , ' 1 ...."
( 0 2,5 5 7,5 10••:::~~•.::::ill-c:::::::ill-Kilometers
Distribution of sampling stations in the Martinique rivers. Different markers are used to assign stations to
clusters 1-3 derived from the CCA analysis and Ward's algorithm (see a/so Figure 2).
Finally, land caver was quantified at each station using a Geographie Information Sys-tem {GIS, ESRI ArcGis 1 0). The 3 land-caver variables extracted were the percent ar-eas covered by forest {arar-eas occupied by broad-leaved forest, shrubs and herbaceous vegetation associations), urbanization {industriel, commercial and transport units; artifi-ciel and non-agricultural vegetated areas), and agriculture (arable lands, permanent crops and pasture). These percentages were estimated on 1 000 rn-long x 100 rn-large ri-parian corridor {buffer zone) located immediately upstream from the sampling station (see Campin and Céréghino (2007) for methodological and theoretical details). Digi-tal land-caver information was extracted from the CORINE land-caver database for Martinique (French Ministry of Ecology, http://www.statistiques.developpement-durable. gouv.fr/donnees-ligne/t/telechargement-donnees-sig-corine-land-cover-dom.html; see also
Cruiskshank and Tom lison (1996)). This database was generated from orthorectified satellites images and provides thematic GIS map layers including up ta 24 land-caver classes with a mapping scale of 1 :100 000.
INVERTEBRATE SAMPLING
Macroinvertebrate sampling was carried out du ring the dry season in April 201 0, during law flow, using the Multi-Habitat Sampling normalized protocol (norm XP T 90-333 in AFNOR,
2009). Twelve sample units were taken from the various habitat types, according their caver-age area. Sample units are distributed as follows: four sample units were taken from marginal habitats (i.e. habitats which caver less than 5% of the sampling station) (group A), four sam-pies units were taken from major habitats (habitats which caver at least 5% of the sampling station) and potentially have a high carrying capacity for invertebrates (group 8), and the last four sample units were taken from major habitats tao but in proportion ta their relative caver-age within the sampling station (group C), taking into account those habitats already sam pied in group B. Ali sam pies were taken with a standard Surber sampler (sampling area 0.05 m2, mesh size 500 ~-tm), and preserved in formalin (4% final concentration). ln the laboratory, in-vertebrates were sorted, identified ta species or genus (except for Oligochaeta and Diptera), and counted, in arder ta calculate the density of each taxon (individuels per m2).
DATA ANALYSIS
Multivariate ordination was used ta examine the relationships between 26 environ mental vari-ables, sampling stations, and density data for 84 invertebrate taxa. The densities were log (n
+
1)-transformed prior ta analysis. An initial Detrended Correspondance Analysis (DCA) in CANOCO v4.5 (Ter Braak and Smilauer, 1998) showed high species turnover (gradient=
2.629) along Axis 1; thereafter, a Canonical Correspondance Analysis (CCA) was used ta ex-amine invertebrate relationships with sampling stations and with the environmental variables (Leps and Smilauer, 2003). Forward selection was employed ta test which of the environmen-tal variables explained a significant (P<
0.05) proportion of the species variance. The sig-nificance of explanatory variables was tested against 500 Monte-Carlo permutations. Ward's algorithm was applied ta the scores of sampling stations on the CCA axes, in arder ta divide the scatterplot into clusters. Ta ease interpretations, these clusters were plotted on a geo-graphie map of the island. The adequacy of invertebrate sampling was assessed by plotting the cumulative frequency of species against sampling effort (sample-rarefaction curve with 500 randomizations) for each cluster (Colwell et al., 2004).ln arder ta further specify the relative influence of geomorphological contrais and anthro-pogenic disturbance on the general patterns of invertebrate community structure, variation partitioning was applied as follows: (1) partial CCA of the species matrix constrained by significant geomorphological variables (elevation, %boulders, %rocky outcrops, conductiv-ity, see results) and significant "anthropogenic" variables as covariate (%agricultural lands, suspended solids, dissolved oxygen, ammonium); (2) partial CCA of the species matrix con-strained by significant anthropogenic variables and significant geomorphological variables as covariate, and (3) CCA of the species matrix constrained by a matrix of each group of vari-ables one at a time. We estimated the pure affects of geomorphology and anthropogenic disturbance as the sum of eigenvalues of canonical axes in analyses (1) and (2), respectively. The effect shared by bath groups of variables (shared variance fraction) was obtained by sub-tracting the sum of variability of (1) and (2) from the amou nt of variability explained by (3) (Leps and Smilauer, 2003). Variation partitioning was first applied ta the entire dataset (51 sampling stations), and then ta each cluster individually.
Finally, in arder ta provide further indication of invertebrate community responses, the distri-butions of species richness, community evenness (Simpson index) and entropy (Shannon in-dex) were compared among Ward clusters using Kruskaii-Wallis tests. These statistical tests were performed using the Past software (version 2.15).
a.
b.
,.,.2
0 D Clusterl ~ D Cluster2 • Cluster 3 Elevation...
BLA LOP,.
<0 %boulder,.
0
Oxygon 1'=!
...
6!1 22. 2.4 35. 58· ABS CAR FRP lOR GAL coc Conductivity ~ pcs FLS Suspended o;s •PPM r sollds .OMO• •vAU CO!' PAl J-EP ,.LOT ~fB •MOM •PRB Ammoniu~GAG .. ..CAP!IAG •POR%rocky outcrop %agricultural
AC TPRo§BER GRD*,. 0 • ROR GRSCAS SJF •LEG LOS._ CAP .01 49 o5 ·70 81 .J9 82 79 23 •
9!
21 7:6· 49 "48 ;19 •54 ·12 c.o0
31 • 62 77 "37- 34· 89 41 • 59 ·9" 50 26 84 • 66 '68 57 '13·6s 3 55 • 1< • "74 29 ~6. il4 • •4• 25 • 28 • ~~ 61 -~8 6~0 13. 5671." . 15 20 ~5 673Ô .14.
63 1. 16 11 27 8. 78 32 "18 72 7 1L---~
-1
.
0
1.
0
Canonlcs/ Cotrespondenœ AnaJysl& ~ bJplots. (a) StJmpJing stations and envftonments/ 'lllllllbles.
EnviiOilmMtll
llltrit!blu a.~~~p~asanledas
\IIICtOn; di~Wtctions show fhfl gradientt, 6ttiOW /ength ,.__Sflllts the sbangfhs of the Wll'fablea
on
the ordination spaœ. ln orderto
IJghi'Bn the flgurB. on/y lllll'fllbi&Bexpltining
a
significant (P<
0.05) pmpt:II'Ü(Ifl of thé~ Vllllilnœ IW111pj13SS1ll8d. Diff8181lf madao.nare
ut1«1
to
aWgrl $tation1Sto
~ 1--(J(see
text
for
a
descrlptlon). (b)dlrtrlbutlon
of~ talœin
cWinetionspece.
lnll'lltfllbl1lf8S..,. idèntified by numbers ain
Ttlbl& 1.RESULTS
CLASSIFICA110N OF SAMPUNO STATIONS
Axes
1 and 2
of the OCA accounted for
19.9%
of ttle 1otal species variance and 29.8%
of the speclœ-envfronment I'Gia11onshlp. Elgenvalueos for axes 1 and 2 were 0.31
and
022,
respectlllet;(.
Specle!Hinvfronment
correlations
were
0.963
for mds
1 and 0.977 for axis 2.
Forward selection and Monte-Cerlo pennutallons
allowus
to
ldentlfy
efghtvariables as
explaining a llignfficant amount of ttle species variance
(arrowsin Figure
2a):elevalion,
%agricultural lands and dissolved oxygen (P
=
0.002), suspended solids and ammonium (P=
0.018), %boulders and conductivity (P=
0.022), %rocky outcrops (0.024).Ward's algorithm helped to identify three clusters of stations (Figure 2). When clusters were plotted on a geographie map (Figure 1), stations in clusters 1, 2 and 3 delineated three major sub-regions, i.e., northern area at high elevations, northern area at mid- to law-elevations, and southern area, respectively. Stations in cluster 1 were surrounded by dense forest, and overall, the area was deprived of permanent human presence. Based on our analyses and on field observations, most of these stations were supposedly unimpacted, reference stations. Conversely, stations in clusters 2 and 3 were located in agricultural or urban areas. Stations in cluster 2 were characterized by coarse rocky substrate and were weil oxygenated, but showed high ammonium concentrations. Stations in cluster 3 were typical of rivers flowing through agriculturallands and showed high concentrations of suspended solids. Higher con-ductivity values in these areas are related to well-known geochemical anomalies due to the lithology (Lions et al. (2008); high concentrations of Na, Ca, Mg, Cl) rather than to anthro-pogenic impacts.
COMPOSITIONAL STRUCTURE OF INVERTEBRATE COMMUNITIES
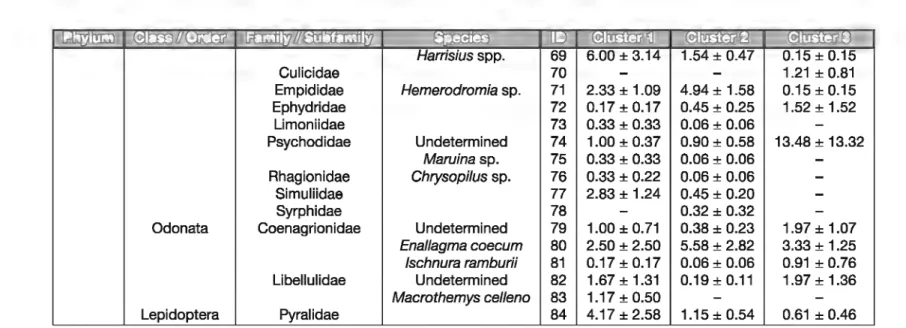
Eighty-four taxa were identified from 51 stations (Table
1
,
Figure 2b). Based on asymptote val-ues of rarefaction curves, we estimate that we sampled 93%, 98% and 100% of the estimated richness in clusters 1, 2, and 3, respectively. lnvertebrate communities of stations in cluster 1 were mainly composed of insects (>90% of the taxa, Figure 3), especially Trichoptera (mostly Hydropsychidae), Ephemeroptera (Baetidae and Leptohyphidae) and Coleoptera (Eimidae). Stations in cluster 2 showed high density for insect orders/families (Trichoptera Philopotami-dae and HydroptiliPhilopotami-dae, and Diptera ChironomiPhilopotami-dae), but also had higher density for Mol-lusca (Thiaridae, Physidae) and Crustacea (Atyidae and Palaemonidae). Stations in cluster 3, which were located in southern part of the island, were characterized by high densities of Mollusca (Thiaridae, Planorbidae and Hydrobiidae), Crustacea (Atyidae and Palaemonidae), and Ephemeroptera (Baetidae and Caenidae). Trichoptera (Helicopsychidae, Hydroptilidae, philopotamidae and Hydroptilidae) and Coleoptera (Psephenidae) were also present, but remained scarce.VARIATION PARTITIONING
Among the eight significant explanatory variables previously identified by means of forward selection, four were associated to anthropogenic pressure (oxygen, ammonium and sus-pended solids, %agricultural lands). The others (elevation, %boulders, %rocky outcrop and conductivity) were related to geomorphology sensu lato. The proportions of pure anthro-pogenic variation and pure geomorphological variation for the 51 stations were 20.0% and 28.7%, respectively. The effect shared by both groups of variables was 11.6%. Finally, the unexplained fraction of the overall variation in invertebrate communities was 39.7%.
When variation partitioning applied to each cluster, the total explained variation was higher for clusters 1 and 3 than for the 51 sites (Table Il; >87% in clusters 1 and 3). The propor-tion of pure geomorphological variapropor-tion (56.6%) was higher than the proporpropor-tion of pure an-thropogenic variation (31.7%) in cluster 1. However, proportions of pure geomorphological variation and pure anthropogenic variation were similar in cluster 2 (18.1 and 17.9%, respec-tively) and in cluster 3 (43.2 and 41.1 %, respecrespec-tively). Finally, it should be noted that cluster 2 showed the highest proportion of unexplained variance (61.8%), suggesting that the most relevant determinants of invertebrate diversity for this specifie subset of stations were not included in our analyses.
Table 1
Distribution of the various invertebrate taxa among clusters 1-3. Numbers indicate density (individuals per m2) ± SE. Taxa ID as in Figure 2.
l.im'l[!]jj] ~ ~ ~~œ
l1!J
~!H!EH[i1'il ~ ~Nemertea 1
-
1.15 ± 0.49 0.15 ± 0.15Hydracarina 2
-
0.26 ± 0.12 0.61 ± 0.34Annelida Achaeta Dugesiidae 3 2.67 ± 1.39 7.76 ± 4.93 0.91 ± 0.52
Oligochaeta 4 9.00 ± 3.99 273.01 ± 161.32 29.09 ± 5.02
Polychaeta 5
-
-
0.45 ± 0.45Molluscs Gastropods Ancylidae 6
-
0.32 ± 0.32 3.64 ± 1.92Ampullariidae Pomacea glauca 7
-
0.19±0.19 0.15 ± 0.15Bulinidae Pleiophysal granulata 8
-
2.44 ± 1.63-Hydrobiidae 9 0.33 ± 0.22
-
19.39 ± 18.56 Neritidae Neritina sp. 10 0.17 ± 0.17 81.86 ± 70.91 13.94 ± 13.28 Physidae Physa sp. 11-
48.97 ± 28.95 1.52 ± 0.76 Planorbidae 12 0.17 ± 0.17 0.06 ± 0.06 438.03 ± 437.86 Thiaridae 13 4.50 ± 2.46 962.24 ± 397.07 305.00 ± 136.39 Sphaeriidae Pisidium sp. 14 0.17 ± 0.17 1.79 ± 1.41 0.15 ± 0.15 Crustacea Ostracoda 15 0.17 ± 0.17 2.18 ± 0.92 1.06 ± 0.75Decapoda Atyidae Atya sp. 16 0.17 ± 0.17 6.73 ± 1.98 0.30 ± 0.20
Micratya poeyi 17 10.83 ± 4.72 32.44 ± 11.56 5.76 ± 2.23
Jonga serrei 18
-
1.22 ± 1.15 0.61 ± 0.41Xiphocaridae Xiphocaris elongata 19
-
0.26 ± 0.20 0.91 ± 0.35Palaemonidae Macrobrachium sp. 20
-
8.40 ± 2.56 3.64 ± 0.97Grapsidae Sesarmasp. 21 0.33 ± 0.33 0.06 ± 0.06
-Pseudothelphusidae Guinotia sp. 22 1.00 ± 0.67
-
-lnsecta Trichoptera Calamoceratidae Phylloicus sp. 23 0.50 ± 0.25
-
-Ecnomidae Austrotinodes sp. 24 1.00 ± 0.83
-
-Helicopsychidae Helicopsyche sp. 25 5.50 ± 2.61 2.18 ± 0.99 -Hydropsychidae Smicridea sp. 26 162.50 ± 60.74 34.17 ± 13.45 1.52 ± 1.52 Hydroptilidae Alisorichia sp. 27-
0.23 ± 0.19 -Hydroptila sp. 28 2.50 ± 1.80 2.95 ± 1.89 -Metrichia sp. 29 0.33 ± 0.33 0.13 ± 0.09 -Neotrichia sp. 30 6.00 ± 4.58 4.81 ± 1.54 4.24 ± 2.19 Oxyethira sp. 31-
0.32 ± 0.32 -Zumatrichia sp. 32-
2.05 ± 0.78 -Philopotamidae Chimarra sp. 33 39.67 ± 12.40 11.35 ± 5.13 0.15 ± 0.15 Polycentropodidae Cernotina sp. 34 0.50 ± 0.50 0.26 ± 0.26 0.15 ± 0.15 Polyplectropus sp. 35 8.33 ± 4.98-
-Table 1 Continued. l:.lit'lrrriil [13~J~ Ephemeroptera Heteroptera Coleoptera Diptera ~i11m"i11~ Baetidae Caenidae Leptohyphidae Leptophlebiidae Gerridae Mesoveliidae Veliidae Elmidae Psephenidae Staphylinidae Blephariceridae sF/ Ceratopogoninae sF/ Forcypomyinae Chironomidae sF/ Chironominae sF/ Orthocladinae sF/ Tanypodinae lt:.l~ Unidentified Americabaetis spinosus Callibaetis sp. Cloedes caraibensis Fallceon ater Caenis sp. Caenis femina Caenis catherinae Undetermined Leptohyphes sp. Tricorythodes griseus Undetermined Hagenulopsis guadeloupensis Terpides sp. Undetermined Limnogonus sp. Trepobates sp. Mesovelia sp. Rhagovelia sp. Elsianus sp. Hexanchorus sp. Psephenops sp. Atrigopogon sp. Undetermined Undetermined Chironomini Tanytarsini lill L"lfm.Wi] L"lm:l~ L"l~ 37 2.67 ± 2.49 0.51 ± 0.30 0.30 ± 0.30 38 143.83 ± 82.34 135.19 ± 22.54 148.18 ± 85.42 39
-
-
0.45 ± 0.32 40 5.17 ± 2.97 0.13 ± 0.09 1.36 ± 0.92 41 42.33 ± 17.47 5.64 ± 1.83 4.70 ± 2.78 42 0.17 ± 0.17 1.09 ± 0.46 6.67 ± 2.64 43 0.17 ± 0.17 2.56 ± 0.83 78.94 ± 46.80 44-
1.79 ± 0.62 15.91 ± 6.13 45 19.67 ± 1 0.80 18.08 ± 6.42 0.91 ± 0.91 46 139.17 ± 54.21 135.51 ± 37.07 3.64 ± 2.50 47 98.17 ± 29.33 60.64 ± 14.77 5.45 ± 3.86 48 2.50 ± 1.81 0.13 ± 0.13 1.52 ± 1.22 49 10.50 ± 4.57 0.13 ± 0.09 1.06 ± 0.91 50 1.00 ± 0.83 1.67 ± 0.68 23.03 ± 19.03 51-
0.06 ± 0.06 1.36 ± 0.54 52-
-
-53-
-
-54-
0.32 ± 0.19 0.61 ± 0.46 55 14.00 ± 8.69 12.44 ± 3.23 4.24 ± 2.53 56 4.50 ± 1.83 2.88 ± 1.02 -57 26.17 ± 14.89 5.32 ± 1.34 -58 9.67 ± 3.16 0.06 ± 0.06 0.15 ± 0.15 59 0.50 ± 0.25 0.58 ± 0.58 0.30 ± 0.30 60 2.30 ± 1.99-
-61 0.67 ± 0.37 3.33 ± 1.84 0.76 ± 0.47 62 4.67 ± 1.95 0.58 ± 0.23 0.30 ± 0.20 63 0.33 ± 0.22 0.96 ± 0.55 -64 0.83 ± 0.57 0.19 ± 0.19 -65 20.67 ± 9.73 11 0.38 ± 70.33 53.64 ± 12.24 66 21.00 ± 14.07 23.08 ± 10.17 21 0.00 ± 170.32 67 41.83 ± 30.20 166.92 ± 69.11 9.70 ± 5.15 68 18.50 ± 8.15 16.99 ± 4.49 21.67 ± 4.09Table 1 Continued. ~
EIDliliJœ
[!) Harrisius spp. 69 Culicidae 70 Empididae Hemerodromia sp. 71 2.33 ± 1.09 4.94 ± 1.58 Ephydridae 72 0.17 ± 0.17 0.45 ± 0.25 Limoniidae 73 0.33 ± 0.33 0.06 ± 0.06 Psychodidae Undetermined 74 1.00 ± 0.37 0.90 ± 0.58 1 13.48 ± 13.32 Maruina sp. 75 0.33 ± 0.33 0.06 ± 0.06 Rhagionidae Chrysopilus sp. 76 0.33 ± 0.22 0.06 ± 0.06 Simuliidae 77 2.83 ± 1.24 0.45 ± 0.20 Syrphidae 78-
0.32 ± 0.32Odonata 1 Coenagrionidae Undetermined 79 1.00 ± 0.71 0.38 ± 0.23 1.97 ± 1.07
Enal/agma caecum 80 2.50 ± 2.50 5.58 ± 2.82 3.33 ± 1.25
Jschnura ramburii 81 0.17 ± 0.17 0.06 ± 0.06 0.91 ± 0.76
Libellulidae 1 Undetermined 82 1.67 ± 1.31 0.19±0.11 1.97 ± 1.36
Macrothemys celleno 83 1.17 ± 0.50
T.,_H
c
0 100 90 80 :;:; 70 'iii 0a.
60E
0 0 50 Q) 0 ) .!!! 40c
Q)e
3o Q)a..
20 10 • OthertaxaD
Mollusca • CrustaceaD
lnsecta o +---'---'--..---'---'--..---'---'----, Cluster 1 Cluster 2 Cluster 3VBri6tion parli1ioning Bl!8fysss for the entil9 dai1J!Jet (8H statiom) and for esch cJwtar considered
sepe-tately.
\'i:fc·:ll~·::•:~ t•!!:lll ~·~~) ~Jlr~. ·~~.~ (..rtrj '11[) (~ . ·•: l<l
Pan
geomorphaiDglcal wufltlan 28.7 56.6 18.1 43.2Pan
anthrQpogenJç Wllaflon 20 31.7 17.9 41.1Shllrederrect 11.6 2.2 2.2 3.2
Unupllllned 39.7
9.5
81.8 12.8MACROINVERTEBRATE DIVERSITY
Overall, box-plots showed a trend
for
increasing within-dustef variability in communily
di-versity from cluster 1 to clusters 2 and 3 (F"tgure
4
). No significant difference in community
diversity
indicaton~was
fou
nd between
dustera
2 and 3. However.1he Shannon and Simpson
Indices showed a slgnHicant decrease from clus1er 1
to
clusters 2 and 3 (Kruskall-wallla
tas1:8,
P< 0.05).
DISCUSSION
Throughout
the
Wor1d, river management
effortsrely
on explicit spatial distribution schemas
{Tateand Heiny,
1995
). Specifically, both river typology and reference conditions
need
to
be agreed upon
before
consldering further practlcal developments such as blologlcal
qual-lty Indices(Van
de Bund and Sollmlnl,
2006
; Mondy et al.,
2012
). Numerlcal pattemlng 18
1herefore
needed
to provide 1heoretical backgrounds, and, more specifically, dis1ribution
pat-tems
offreshwater organisms must
be
derived from environ mental conditions with emphasis
on 1he influence of natural conditions and antlntlpogenic impacts. This sludy 1hus provides
new quantitative information on the distribution and environmental preferences
offmshwater
lnvertebratesln 1he French l.ésser Antilles.
Ordination and cluster analyaes are fmquently
uaed
ln 1he exploratory phase of river
typolo-gies (Jor.gman
6t
81.,
1995
; Céréghlno and
Park.
2009
)
. Oierall, our results hlghllght the
lm-portance of gecmorphology (pe.rticle size, river oompetenœ and erosive
forces
in relation
36
"'
32"'
(Il 2 c: .r:. u 24 ·;::: u 20.
Ë
0 16 c: 0 12 xr:.
8 4 0.9 0.8 x (Il 0.7 "C c: 0.6 c: 0 0.5"'
a..ê
0.4 Vl 0.3 0.2 0.1 0 3 2.7 2.4 x 2.1 (Il "C c: 1.8 c: 1.5 0 c: c: 1.2 ro .r:. 0.9 Vl 0.6 0.3 0 Flgura4a
~
0a
9
b
b - ' --N ~ (Il....
"'
:::1u
b
b r=--'
--~ (Il....
"'
:::1u
Boxplots of diversity metrfcs distributions (taxonomie richness, Simpson's evenness, Shannon's Entropy)
frJr the thtee cluster.s detlved from the OCA and Ward's algorlthm, wtth comparlson of pairs of clusters.
Significant diffemnces between cfustenl W9l9 t&stsd with Kruskai-Wallis tssœ; fow91C8S9 Jettera abow
boxes indicate significant differences at P
<
0.05.
to
elevation, conductivity from headwaters to seashore) and land cover (e.g., agriculturallands and related alterations of water chemistry) in delineating ecological sub-regions for
the freshwater biota. lt should
be
noted however that the unexplained variation for the entiredataset (ali stations) was quite important (39.7%); therefore, important variables that were not
included in our analysis would deserve further investigation. Most stations that formed
clus-ters were geographlcally adJacent and there
was no major spatial dlscontlnu
lty ln lnvertebratedistribution. Sampling stations were included in our multivariate analysis regardless of
a
prioriconsideration
of
disturbance. Thus,we
expected
that geographically adjacent stationsrepresent differences among stations in biological quality. anly four spatial discontinuities were noted among our 51 stations. Station cac (see Figure 1) is close ta the northernmost seashore, where it is surrounded by stations typical of cluster 2. However, this station was assigned ta cluster 1 in the ordination space. Field observations as weil as our data support that cac is a station of higher biological quality in the area, and could thus form a reference (34 taxa while the maximum local richness is 38 taxa). Conversely, station CAM which is lo-cated below vegetable cultivations occurs in a mountainous area typical of cluster 1 , but was assigned ta cluster 2. Stations FLS and MaM (Fort-de-France capital city) were expected ta belong ta cluster 2 based on their geographie location, but were assigned ta cluster 3. These three stations being subjected ta important anthropogenic pressure, their distribution in the ordination space was certainly due ta the impoverishment of their invertebrate fauna and/or ta shifts in species composition from species known as pollution sensitive (e.g., many Trichoptera and Ephemeroptera) ta pollution resistant species (e.g., most Mollusca).
The proportion of pure variation explained by geomorphological variables was higher than that explained by anthropogenic variables, however, within a given sub-region (cluster), an-thropogenic disturbance affected macroinvertebrate diversity (Shannon and Simpson in-dices) through physical-chemical alterations of freshwaters (ammonium, suspended solids). lt should be noted that the downstream areas (clusters 2 and 3) concentrate most human activities in general, sa that here, the relative influences of natural conditions and anthro-pogenic impacts remain difficult ta tease out (see Table Il). More specifically, reference sta-tions obviously lack in cluster 3. Conversely, is likely that cluster 1 was mostly generated through geomorphological drivers. ln the north of the island, mountain streams along the volcano slopes represent dynamic environments which are physically heterogeneous (higher river competence generated through the combination of slope with other variables such as water depth and current velocity, higher substrate heterogeneity), thus promoting a high di-versity of benthic invertebrates. For example, Diptera Blephariceridae (net-winged midges), which are typical of torrential streams, were only found at stations from cluster 1. The caddis-fly Smicridea sp. (Trichoptera Hydropsychidae), a common taxa in our dataset, showed high ta moderate densities in clusters 1 and 2, but was absent in plain rivers from cluster 3. Although some taxa were specifie of a given cluster, such invertebrates usually occurred in very law densities (<1 individual per m2). ln fact, most taxa were common; 24 and 42 taxa out of 84 occurred in two and three clusters, respectively. Despite this general trend for ubiq-uity, individual stations only contained 9 ta 38 taxa. This situation raise concerns as ta how ta define water quality classes in the later phase of applied research, and how ta identify sensitive indicator species when (i) local communities are rather poor (insular context, Smith
et al., 2003 ; Hughes, 2005 ; Gonçalves et al., 2008), (ii) mean or median values for struc-tural indices (e.g., community entropy and eveness) do not differ greatly in space. However, although many species were widespread, the quantitative structure of invertebrate communi-ties varied markedly among clusters (see results). We thus suggest that future developments should consider quantitative approaches ta invertebrate communities, because qualitative metrics related ta the loss or a gain of species are not expected ta evaluate disturbance efficiently within a given sub-region (cluster).
lnsular freshwater invertebrate assemblages are distinct from their continental counterparts in that there are shaped by more complex biogeographical, historical and geomorpholog-ical factors (Bou Iton et al., 2008). Caribbean islands in particular have naturally depauper-ate species pools that contain endemie species of conservation value (Bass, 2003). At the same time, they harbor spatially-concentrated human populations with important demands for freshwater resource. Despite the small surface area of an island such as Martinique, inver-tebrate communities show a clear spatial turnover in composition and biological traits (e.g., insects in cluster 1 , crustaceans and molluscs in cluster 2) in relation ta local natural condi-tions. If the sensitivity of the biota ta disturbance in a given area must be assessed in terms of similarity ta an undisturbed state, this study shows that confounding affects of natural and anthropogenic factors (e.g., lack of reference stations in southern Martinique) may li mit our ability ta estimate deviation from expected patterns when considering the compositional
structure of communities. Hence, metrics that aggregate taxa into fewer categories than the species list do {percentage composition of upper taxa or a combination of those, trophic or habit measures, Barbour et al. 2009), could be more efficient at predicting a priori responses of communities to environmental conditions, especially if these metrics reflect adaptations to river environments along the downstream gradient and/or along gradients of surrounding landscapes {e.g., Functional Feeding Groups, see Compin and Céréghino {2007)). ln these conditions, we would expect reference stations to be less geography-dependent, e.g., estu-arine or plain stations of high biological quality could serve as a reference throughout Mar-tinique. Subsequently, a combination of metrics able to detect a wide range of anthropogenic pressures should be selected to set up multimetric indices, as required within the WFD {Hering et al., 2006; Lücke and Johnson, 2009).
ACKNOWLEDGEMENTS
This study was funded by the French Direction de l'Environnement, de l'Aménagement et du Logement de Martinique {Ministère de l'Ecologie, du Développement Durable, des Transports et du Logement/ DEAL Martinique), the Office de l'Eau Martinique and the Office National de l'Eau et des Milieux Aquatiques {ONEMA). CB is supported by an ANRT-CIFRE grant No. 460/2010; HTP is supported by an ANRT-CIFRE grant No. 912/2010. Two anonymous reviewers provided helpful comments on an earlier version of this paper.
REFERENCES
AFNOR, 2009. Qualité de l'eau. Prélèvement des macro-invertébrés aquatiques en rivières peu pro-fondes. XP T 90-333. Afnor, 1-15.
Anonymous, 2003. Rivers and Lakes - Typology, Reference Conditions and Classification Systems. Common Implementation Strategy for the Water Framework Directive Guidance. Document No.10.
ASCONIT, 2012. Mise au point d'un indice de bio-indication de la qualité de l'eau à partir des macro-invertébrés benthiques. An nuai Report year 2011. Direction Régionale de l'Environnement et Office de l'Eau Guadeloupe, 1-95.
Bai leyR., Norris R. and Reynoldson T., 2003. Bioassessment of freshwater ecosystems using the refer-ence condition approach. Kluwer Academie Publishers, New York, USA.
Barbour M.T., Gerritsen J., Snyder B. and Stribling J.B., 2009. Biological Data Analysis. ln: A Rapid Bioassessment Protocols for Use in Streams and Wadeable Rivers: Periphyton, Benthic Macroinvertebrates, and Fish. Second Edition. Rep. EPA/841-B-99-002, US EPA, Off. Water, Washington, DC.
Bass D., 2003. A comparison of freshwater macroinvertebrate communities on small Caribbean islands.
BioScience, 53, 1 094-11 00.
Boulton A.J., Boyero L., Covich A.P., Dobson M., Lake S. and Pearson R.G., 2008. Are tropicalstreams ecologically different from temperate streams? ln: Dudgeon D. (ed.), Tropical Stream Ecology, Academie Press, San Diego, 257-284.
Céréghino R. and Park Y.S., 2009. Review of the self-organizing map (SOM) approach in water re-sources: commentary. Environ. Mode//. Softw., 24, 945-947.
Chaves M.L., Costa J.L., Chainho P., Costa M.J. and Prat N., 2011. Are Water Framework Directive stream types biologically relevant? The case of the Mondego river, Portugal. Ann. Limnol. /nt. J. Lim., 47,119-131.
Colwell R.K., Mao C.X. and Chang J., 2004. lnterpolating, extrapolating, and compared incidence-based species accumulation curves. Eco/ogy, 85, 2717-2727.
Compin A and Céréghino R., 2007. Spatial patterns of macroinvertebrate functional feeding groups in streams in relation to physical variables and land-cover in Southwestern France. Landscape Eco/., 22, 1215-1225.
Cruiskshank M.M. and Tomlison R.W., 1996. Application of CORINE land cover methodology to the UK. Some issues raised from Northern lreland. Global Eco/. Biogeogr., 4/5, 235-248.
Delgado C., Pardo 1. and Garcfa L., 201 O. A multimetric diatom index ta assess the ecological status of coastal Galician rivers (NW Spain). Hydrobio/ogia, 644, 371-384.
ENSAT (Ecole Nationale Supérieure d'Agronomie de Toulouse), 1995. Étude faunistique des rivières martiniquaises. ENSA-Toulouse Technical Report, 1-216.
European Council, 2000. Directive 2000/60/EC of the European Parliament and of the Council of 23 October 2000 establishing a framework for community action in the field of water policy, 1-72. Gabriels W., Lock K., De Pauw N. and Goethals P.L.M., 201 O. Multimetric Macroinvertebrate Index
Flanders (MMIF) for biological assessment of rivers and lakes in Flanders (Belgium). Limnologica, 40, 199-207.
Gonçalves V., Raposeiro P. and Costa A.C., 2008. Benthic diatoms and macroinvertebrates in the as-sessment of the ecological status of Azorean stream. Limnetica, 27, 317-328.
Hering D., Feld C.K., Moog O. and Ofenbëck T., 2006. Cook book for the development of a Multimetric Index for biological condition of aquatic ecosystems: experiences from the European AQEM and STAR projects and related initiatives. Hydrobiologia, 566, 311-324.
Huryn A.D. and Wallace J.B., 1987. Local geomorphology as a determinant of macrofaunal production in a mountain stream. Eco/ogy, 68, 1932-1942.
Hughes S.J., 2005. Application of the Water Framework Directive ta Macaronesian freshwater systems. Biol. Environ., 105, 185-193.
INSEE (Institut National de la Statistique et des Etudes Economiques), 2009. Populations lé-gales 2009 des Départements d'Outre-Mer (DOM). http://www.insee.fr/fr/ppp/bases-de-donnees/ recensement/populations-legales/france-regions.asp?annee=2009.
Jongman R.H.G., Ter Braak C.J.F. and van Tongerenm O.F.R., 1995. Data analysis in community and landscape ecology. Cambridge University Press, UK.
Kelly F.L., Harrison A.J., Allen M., Connor L. and Rosell R., 2012. Development and application of an ecological classification tool for fish in lakes in lreland. Eco/. Indic., 18, 608--619.
Leps J. and Smilauer P., 2003. Multivariate Analysis of Ecological Data using CANOCO. Cambridge University Press, Cambridge, 1-282.
Lions J., Allier D., Pinson S. and Vittecoq B., 2008. Identification des zones à risque de fond géochimique élevé dans les cours d'eau et les eaux souterraines en Martinique. Technical Report BRGM RP-567 48-FR, 124 p.
Lücke J.D. and Johnson J., 2009. Detection of ecological change in stream macroinvertebrate assem-blages using single metric, multimetric or multivariate approaches. Eco/. Indic., 9, 659--669. Mandy C.P., Villeneuve B., Archaimbault V. and Usseglio-Polatera P., 2012. A new
macroinvertebrate-based multimetric index (12M2) ta evaluate ecological quality of French wadeable streams fulfilling the WFD demands: A taxonomical and trait approach. Eco/. Indic., 18, 452-467.
Sandin L. and Johnson R.K., 2000. Ecoregions and benthic macroinvertebrate assemblages of Swedish streams. J. N. Am. Benthol. Soc., 19,462-474.
Smith G.C., Covich A.P. and Brasher A.M.D., 2003. An ecological perspective on the biodiversity of tropical island streams. BioScience, 53,1048-1051.
Stark B. P., 2000. Notes on the Anacroneuria (Piecoptera: Perlidae) of Guyana with the description of a new species. Aquat. lnsect, 22, 305-31 O.
Starmühlner F., 1977. Contribution ta the knowledge of the freshwater fau na of La Reunion (Mascarene). Cah ORSTOM, Ser. Hydrobiol., 11, 239-250.
Tate C.M. and Heiny J.S., 1995. The ordination of benthic invertebrate communities in the South Platte River Basin in relation ta environmental factors. Fresh. Biol., 33, 439-454.
Ter Braak C.J. and Smilauer F.P., 1998. Reference manual and user's guide ta Canoco for Windows: software for canonical community ordination (version 4), lthaca, NY, USA.
van de Sund W. and Solimini A., 2006. Ecological Quality Ratios for ecological quality assessment in inland and marine waters. EU project REBECCA Deliverable 10, 1-22.
Wallin M., Wiederholm T. and Johnson R.K., 2003. Guidance on establishing reference conditions and ecological status class boundaries for inland surface waters. Final Report ta the European Commission from CIS Working Group 2.3- REFCOND.
Wu D. and Legg D., 2007. Structures of benthic insect communities in two southeastern Wyoming (USA) streams: similarities and differences among spatial units at different local scales. Hydrobiologia, 579, 279-289.