A Multi-Modal Miniature Surface Forces Apparatus
(µSFA) for Interfacial Science Measurements
Kai Kristiansen‡,*, Stephen Donaldson†, Zachariah J. Berkson‡,ֆ, Jeffrey Scott§, Rongxin Su┴, Xavier Banquy¶, Dong Woog Lee#, Hilton B. de Aguiar†, Joshua McGraw‖, George D. Degen‡, and Jacob N. Israelachvili‡.
‡Department of Chemical Engineering, University of California Santa Barbara, Santa Barbara, CA93106, United States
†Département de Physique, Ecole Normale Supérieure, 75005 Paris, France
§SurForce LLC, Goleta, CA93117, United States
┴School of Chemical Engineering and Technology, Tianjin University, Tianjin 300072, China
¶Faculty of Pharmacy, Université de Montréal, Succursale Centre Ville, Montréal Quebec H3C 3J7, Canada
#School of Energy and Chemical Engineering, Ulsan National Institute of Science and Technology, Ulsan 44919, Republic of Korea
ABSTRACT
Advances in the research of intermolecular and surface interactions result from the development of new and improved measurement techniques and combinations of existing techniques. Here, we present a new miniature version of the Surface Force Apparatus – the micro-SFA (µSFA) – that has been designed for ease of use and multi-modal capabilities with retention of the capabilities of other SFA models including accurate measurement of surface separation distance and physical characterization of dynamic and static physical forces (i.e., normal, shear, and friction) and interactions (e.g., van der Waals, electrostatic, hydrophobic, steric, bio-specific). The small physical size of the µSFA makes it portable and suitable for integration into commercially available optical and fluorescence light microscopes, as demonstrated here. The large white-light optical path entry and exit ports make it ideal for concurrent force measurements and spectroscopy studies. Examples of the use of the µSFA in combination with surface plasmon resonance (SPR) and Raman spectroscopy measurements are presented. Due to the short working distance constraints associated with Raman spectroscopy, a new interferometric technique was developed and applied for calculating the inter-surface separation distance based on Newton’s Rings. The introduction of the µSFA will mark a transition in SFA usage from primarily physical characterization to physical characterization with combined and concurrent in situ chemical and biological characterization, including (but not limited to) adsorption of selected molecules, determination of surface species and morphology, and (bio-)molecular binding kinetics.
INTRODUCTION
Interfaces are ubiquitous in nature and pursuits to control, understand, and modify interactions across interfaces have spanned millenia.1 Recent advances in fundamental and applied nanoscience and surface science research2-3 in recent years have profoundly impacted technology, medicine,4 and our fundamental insight into the physical world.
To gain a better fundamental understanding of intermolecular and inter-particle interactions at surfaces there has been a many efforts to combine multiple measurement techniques into single instruments, including Atomic Force Microscopy with Electrochemistry5, tip-enhanced Raman spectroscopy6, Quartz Crystal Microbalance – Dissipation with Reflectometry7, Surface Plasmon Resonance with Electrochemistry8, Magnetic Resonance Imaging-Photoacoustic Imaging-Raman Imaging9, and Surface Forces Apparatus with X-ray spectroscopy10 and electrochemistry11. Combined techniques allow concurrent in situ measurements– a requirement for sensitive systems in which small variations can have a huge impact on the physical and chemical properties. An example is the interaction between exterior cell membranes. The average distance between exterior cell membranes in the human body is on average no more than 10 nm. At such short separation distances between two objects, the mutual interaction energies (e.g., electrostatic attraction or repulsion, van der Waals and hydrophobic attraction, and complementary (bio-)specific interactions) induce rearrangements of constituent species within each cell membrane that would otherwise not occur within isolated membranes. Only minor changes in the lipid and/or protein concentration and/or composition or the presence of very small quantities of additives such as polymers or nanoparticles have been found to dramatically change membrane
domain morphologies, with correspondingly dramatic influences on adhesion and other interactions between membranes.12-14 Measuring and understanding the influences of such subtle changes and effects frequently requires combinations of techniques applied under in situ conditions, providing a driving force for the development of new combined instruments.
The Surface Forces Apparatus (SFA) has been a workhorse for interfacial science for the last fifty years.15 The continuous development of the commercially available SFA, the SFA2000,16 has allowed simultaneous force-measurements with (i) electrochemistry for precise control of surface potential and current flow,11 (ii) fluorescence microscopy to study simultaneous membrane morphological changes and intermembrane energies and adhesion,17 and (iii) a 3D sensor-actuator for measuring anisotropic friction forces.18 A specialized SFA system has been developed for simultaneous X-ray characterization.10 While the SFA2000 was designed to accept numerous attachments (e.g., friction, electrochemistry, fluorescence), it is too bulky to easily interface with typical laboratory microscope systems and thereby leverage many widespread microscopy techniques. To remedy this, a new miniaturized Surface Forces Apparatus (µSFA, shown in Figure 1) has been designed that similarly allows for accurate and unambiguous force-distance measurements and additionally enables simultaneous optical imaging and spectroscopic characterization of interacting surfaces in real time.
Figure 1. The miniature Surface Forces Apparatus (µSFA) on a (a) chamber maintenance stand (b) custom microscope stage for Olympus microscope. In (b) the piezo top mount is turned over to show the two mica surfaces with back-coated gold layer. The length of the front (and back) panel is 82 mm while the chamber height is 48 mm at the piezoelectric upper surface attachment and 34 mm high otherwise (excluding the motor drive assembly). The compact size of the µSFA allows for easy interfacing with common commercial optical light microscopes.
The µSFA can perform the same force measurements as previous SFA instruments and the large ports allow it to interface with diverse optical and spectroscopic techniques including fluorescence imaging, Raman spectroscopy, X-ray diffraction and/or spectroscopy, and Surface Plasmon Resonance (SPR) spectroscopy. The µSFA is ideal for studying complex surface interactions, processes, and morphologies in nano- to meso-scale systems (both biological and non-biological). The instrument enables simultaneous dynamic characterization of surface layer morphologies, processes, and interactions is expected to yield fundamental insights into the relationship between changes in microscopic and submicroscopic structure and organization, molecular binding energies and kinetics, and inter-surface interactions.
Here, we describe the new µSFA and demonstrate its capabilities for several model cases. Normal and frictional force measurements were conducted with simultaneous fluorescence microscopy, SPR spectroscopy, or Raman spectroscopy. The Raman-µSFA was especially challenging due to the short working distance constraints, which were mitigated by developing an interferometric technique for calculating the surface separation distance based on Newton’s Rings.
MATERIALS AND METHODS
Chemicals and Materials. Muscovite mica pieces of high optical grade (S&J Trading) were cleaved to 1-5 µm thin sheets before being placed onto a freshly cleaved mica backing sheet.19 Silver was deposited on one side of the mica in a thermal evaporator, and the sheets were stored in desiccators at low pressures until used. Before use the mica sheets were peeled off the backing sheet and glued (thermosetting glue EPON 1004F, Miller-Stephenson or UV-curing glue Norland 81) onto a cylindrical fused silica disk (SurForce LLC) with the silver side towards the glue layer. Water used for the experiments was deionized (18.2 MΩ cm with 2 ppb impurity⸱ counts) using an Integral 5 MilliQ filtration system. The capabilities of the µSFA were tested with several solutions: (1) Polystyrene beads of 4 µm in diameter with Texas-Red fluorophore (excitation 589 nm/ fluoresce 615 nm) were purchased from Molecular Probes (FluoSphere with sulfate, F8858). The original solution was diluted ten-fold in water and then injected between two mica surfaces. (2) A suspension of silica nanoparticles (silica Ludox® HS40) at 0.3%w/w and of hydrodynamic diameter of 40 nm were functionalized with a fluorescent dye [Xavier: please fill out where these silica particles come from]. (3) A series of mixtures of glycerol (Sigma-Aldrich) and water (glycerol volume concentrations of 0%, 5%, 10%, 15%, 20%, and
25%) was prepared before injecting 50 µL of each of these mixtures between mica surfaces in the µSFA. (4) A lysozyme solution of Rongxin: XX wt% at pH 4.5 was prepared in a Rongxin: XXX salt solution. A mica surface was incubated in the solution for 1 hour and then rinsed and immersed in a phosphate-buffered saline (PBS, Sigma-Aldrich). [Rongxin, please check and fill out]. (5) A series of potassium chloride (KCl, Sigma-Aldrich) solutions of concentrations of 1 mM, 10 mM, and 100 mM were used for testing the standard electrostatic double layer theory. [Steve, please check provider of KCl]. All measurements were performed at 22°C.
Surface Forces Apparatus (SFA) technique. The Surface Forces Apparatus uses white light multiple beam interferometry to determine the separation distance and refractive index of thin films of vapor or liquid between two surfaces. A typical setup in the SFA involves symmetric mica surfaces (typically 1-5 µm thick mica sheets) back-coated with reflecting silver.16 A interference pattern generated by monochromatic light passing through the mica surfaces in close proximity is known as Newton’s rings (Fig. 2b). A light source emitting a continuous range of wavelength (e.g., white light) passing through the mica surfaces will form an interference pattern that, when passed through a spectrometer, appears as fringes of equal chromatic order (FECO). The absolute separation distance (as well as the line profile through the contact region) between the mica surfaces can be calculated from the FECO fringes.20-24
Figure 2a shows a typical distance profile generated by the µSFA. To measure a force-distance profile a piezo drive or a motorized micrometer drives the surfaces together (with a known distance displacement ΔD over a short time interval) from a region of no interfacial force into a separation distance at which the surfaces interact, after which they are separated again. Over the same time interval, the actual distance displacement ΔDa is calculated from the FECO.
With a pre-calibrated spring of spring constant k, the inter-surface force can be calculated using Hook’s law: F = k (Δ⸱ Da – ΔD), where negative force corresponds to attraction and positive force corresponds to repulsion.
Figure 2. The µSFA has been utilized in (a) standard SFA normal force measurements between
mica surfaces immersed in 5 mM NaCl. The red line is a theoretical fit including contributions from the expected electrostatic double layer repulsion, van der Waals attraction, and steric hydration repulsion.1 The µSFA can also be used to image confined systems, as shown in (b) imaging of the mica-mica contact Newton’s rings, and (c) fluorescent image of 4 μm diameter polystyrene beads confined between mica surfaces. Both (b) and (c) images were obtained with a 10× objective (Kai to insert scalebar. Steve: Do you have the original image of C?).
The miniature Surface Forces Apparatus (µSFA). To make an SFA compatible with optical
and spectroscopic techniques, we (1) reduced the dimensions of the existing SFA (i.e., SFA2000 from SurForce LLC) roughly by a factor of two, i.e., reducing the volume by a factor of 8; (2) reconfigured the mechanical controls, electric connections, fluid inlet and outlet ports, sample
insertion port, thermistor port, viewing windows, etc., to enable operation of the µSFA during concurrent optical and spectroscopic measurements; (3) increased the entrance port or window to receive large fluorescence and other microscope objectives, and (4) reduced the distance between the objective and sample from 10 mm to <3 mm to match the focal length of typical fluorescence and other microscope objectives. These changes allow the µSFA to be mounted on a microscope stage, and the design changes to the instrument facilitate optical, fluorescence, and other types of spectroscopic imaging and characterization (e.g., Surface Plasmon Resonance and Raman) of systems under confinement.
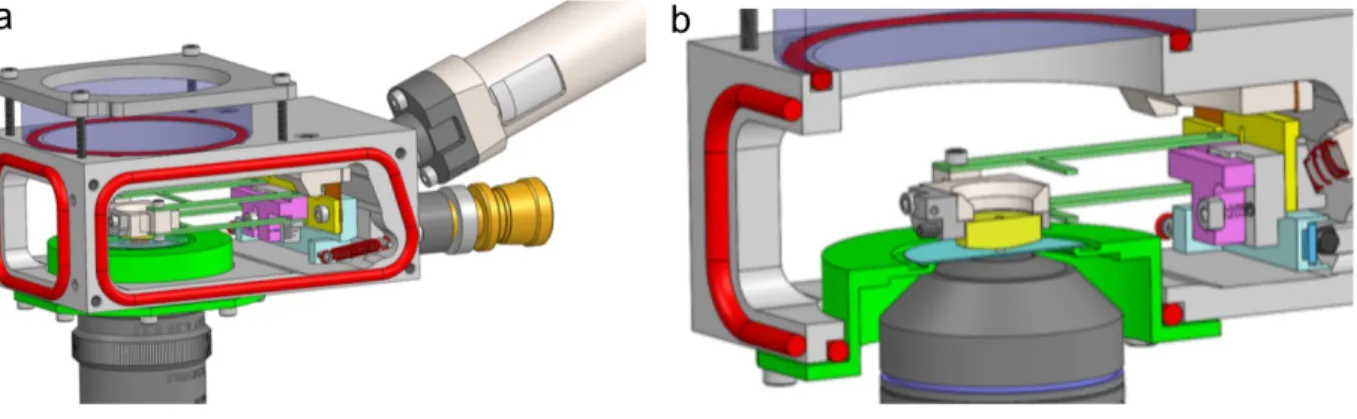
Figure 3. Cross-section of the µSFA (with the back panel removed for clarity). The inset shows the force spring attachment, and the top right shows the force spring attachment rotated by 45°. The SFA has four levels of positioning control spanning ranges of motion from mm to sub-nm: a differential micrometer with coarse and medium control, a motorized fine micrometer coupled to the lower surface via the force spring attachment, and a piezoelectric tube coupled to the top surface. The differential micrometer deflects the coarse displacement spring around a flexure point at the same plane as the contacting surfaces to ensure a vertical motion of the surfaces. A pair of anti-backlash springs (attached between the Attachment Base and the Main Chamber) counteract the motion of the differential micrometer and reduce mechanical noise. The fine micrometer deflects the fine displacement spring. The combined spring constant of the helical spring and the fine displacement spring is tuned to reduce the displacement of the lower surface 1000-fold with respect to the displacement of the fine micrometer. The surfaces (on glass disks) are mounted on dove-tailed disk mounts for easy insertion of samples. The bottom port and the side panels are large compared to the size of the µSFA to allow easy access of various objectives and light beams for different optical and spectroscopic techniques.
The µSFA has been tested in both the standard SFA optical setup and an inverted microscope setup. Figure 2a shows normal forces measured between two mica surfaces immersed in an aqueous solution of 5 mM NaCl. The forces agree well with the expected DLVO (van der Waals and electrostatic double layer) forces between the anionic mica surfaces. The inverted microscope allows facile imaging of the contact between mica surfaces. Figure 2b shows an image of the Newton’s rings interference patterns that occur when bringing mica surfaces into contact in air. The inverted microscope also facilitates fluorescence imaging of the contact area between surfaces in the µSFA, as shown in Figure 2c, which shows 4 μm fluorescent beads
confined between mica surfaces. The distinct circular shape is the outline of the contact area, as the beads have been pushed out of the contact to the edge of the contact area.
RESULTS AND DISCUSSION
The µSFA is designed to be integrated with new optical and spectroscopic attachments. The following four sections describe experiments using fluorescence microscopy, Surface Plasmon Resonance (SPR) spectroscopy, and Raman spectroscopy in combination with normal (to the interacting surfaces) and frictional force measurements.
Simultaneous and In-Situ Force Measurements and Fluorescence Imaging (FL-µSFA)
The new multimodal µSFA enables in-situ and simultaneous measurements of inter-surface forces and fluorescence image. Fluorescence microscopy has widespread applications in biological, polymer, and nanoparticle science.25-29 Recently, a custom-designed fluorescence attachment to the SFA 2000 allowed visualization of the hemifusion of two lipid bilayers.17 The µSFA may be mounted and operated in an inverted fluorescence microscope (Fig. 4a), allowing fluorescence excitation and imaging across a broad range of wavelengths. Fluorescent (FL) species between two SFA surfaces (Fig. 4b) are excited and imaged with the fluorescent microscope (Fig. 4c). Simultaneously, white light (with the wavelengths in the region of the fluorescence light filtered out) is passed between the surfaces. The resulting interference pattern is transmitted to a spectrometer producing FECO fringes (Fig. 4d). This FL-µSFA design is expected to allow imaging of fluorescently-tagged species such as biomembranes, nanoparticles, etc., under diverse conditions within the SFA, including under normal forces and/or shear.
(a) µSFA
(c) Fluorescence
(d) FECO
(b) Schematic
Furthermore, morphological changes or fluid dynamics can be tracked over the course of a conventional SFA force run.
Figure 4. (a) The µSFA in an inverted microscope in fluorescence imaging mode. (b) Schematic
illustration of a fluorescence µSFA experiment. Orange light (589 nm) is used to excite fluorescent species, which in this case emit at red wavelengths. Simultaneously, filtered white light (<580 nm) is reflected between the surfaces. The transmitted light near the point of contact creates Newton’s rings (see Fig. 3b) which yield fringes of equal chromatic order (FECO), as in a conventional SFA experiment. The combined methods enable in-situ (c) fluorescence imaging
and force-distance measurements by analysis of (d) FECO. Panel (c) shows 4 μm diameter polystyrene beads with Texas-Red fluorophore confined between mica surfaces during approach and (d) shows the corresponding FECO. The newly-developed FL-µSFA technique is expected to provide valuable new insights into the mutual force interactions of organic and inorganic species, with simultaneous imaging of surfaces, particles, and interfaces.
To demonstrate the application of the new FL-µSFA setup, we analyzed forces between mica surfaces across a solution containing 2 mg/mL of 4 µm polystyrene beads tagged with Texas-Red fluorophore. The movements of the particles were tracked using the fluorescent microscope. Approximately 41,000 partial particle trajectories were detected and analyzed using MosaicSuite particle tracker30 and Fiji31. A representative video of particle motions during approach along with the visualized particle trajectories are shown in the Supporting Information (Video S1).
The FL-µSFA setup allows simultaneous measurement and analyses of inter-surface pressures and the tracked particle motions (Fig. 5). The inter-surface pressure P as a function time is shown in Figure 5a. The pressure starts to increase at 34 s as particles are trapped and compressed between the two surfaces. The pressure increases monotonically for the remainder of the approach, except between 37 and 41 s where a combination of rearrangement of the trapped microparticles and a lateral shift in the contact point of tens of µm results in a pressure drop. Concomitantly, the mean particle speeds were determined for particles within annular regions 50 µm in width of different distances from the center of the inter-surface contact area, which are shown in the inset to Figure 5b and in Figure S1. Within 50 µm of the center of the contact area (Fig. 5b, orange), the particles are relatively immobile during the first 25 s of the inter-surface approach. However, further from the contact point the particles rapidly increase in speed 20 s
after the beginning of the inter-surface approach. The increase is most pronounced for particles 300-350 µm from the contact (Fig. 5b, green), and is less pronounced for particles closer (Fig. 5b, blue and magenta) and further (Fig. 5b, red) from the contact. As the inter-surface pressure increases for t > 30 s, the particles within the contact area (Fig. 5b, orange) slowly accelerate as the particles rearrange and the surfaces shift laterally under high compression, plateauing at speeds of 0.47 µm/s.
As shown for this model system of fluorescently-tagged microparticles, the FL-µSFA setup enables the positions, trajectories, and velocities of fluorescent species to be easily determined and analyzed during SFA force-distance measurements. This provides complementary information about dynamics and interactions across different length and time scales that was previously inaccessible.
Figure 5. (a) Pressure between two mica surfaces across a suspension of 4 μm diameter
polystyrene beads in the µSFA shown as a function of time as the surfaces are brought into contact. Inter-surface pressure-distance and distance-time profiles are shown in see the Supporting Information (Fig. S2). (b) Mean particle velocities of 4 μm diameter polystyrene beads tagged with Texas-Red fluorophore confined between mica surfaces during approach within annular regions at selected distances from the center of the initial inter-surface contact: 0-50 µm (orange), 100-10-50 µm (blue), 200-20-50 µm (magenta), 300-30-50 µm (green), and 400-40-50 µm (red). The corresponding annular regions are shown in the inset FL image.
The field of tribology will particularly benefit from the combination of fluorescence imaging and surface forces techniques. In this field, correlating frictional forces to the distribution, mobility, and conformation of lubricating molecules at interfaces has been a long elusive goal. The µSFA offers a unique opportunity to explore and unravel such correlations.
To demonstrate the capabilities of the µSFA by simultaneously measuring lubrication forces and assessing spatial distributions of lubricating species, we performed a series of tribological experiments to test the lubricating properties of suspensions of fluorescently labeled nanoparticles. To characterize the dynamic spatial distributions of the nanoparticles during shearing of the contact, we mounted the µSFA on a fluorescence microscope equipped with a camera for fluorescence imaging. The setup allows simultaneous acquisition of the FECO fringes emerging from the surfaces, frictional forces recorded by strain gauges installed on the upper surface holder and a top view image of the distribution of fluorescently labeled nanoparticles in the contact (see Fig. 4). To control the lateral motion of the upper surface, a standard friction device was used.16
This arrangement has proven to be particularly powerful to follow dynamically the initiation of wear cracks and their propagation along the shearing path. Identifying the initiation of wear during a tribological test is a long-standing challenge. The conventional way to detect wear initiation is through the monitoring of the frictional force during sliding or via analysis of the topography of the sliding track after experimentation. Monitoring of the friction force to detect transient changes that could be correlated to surface damage is challenging and often subjective. [Xavier: ref?] Many systems that are prone to wear do not necessarily demonstrate any changes in friction coefficient32 and, similarly, drastic changes in the friction forces during sliding do not
always correlate with surface damage.33 Ex-situ analyses of the contact allow quantification of the chemical and structural changes along the wear track but provide minimal information on how these changes evolve over time.
The configuration of the µSFA in a fluorescence microscope (Fig. 4) provides a unique solution to this problem. The FECO provides deliver a live cross section of the contact geometry with angstrom resolution in the vertical axis and micron resolution in the plane of sliding. Such high resolution in the z axis allows the detection of minute changes in the boundary lubricant film thickness which often precedes the local build upbuildup of pressure and subsequent damage.34 Since the FECO only represents a single cross section of the contact (either perpendicular to the sliding direction or parallel to it) unless scanning the SFA chamber through the optical path, wear initiation sites located far from the cross section are not visible in the FECO fringes. Concurrent analyses of FECO fringes with top view imaging of the entire contact is therefore advantageous. Top view imaging of the contact allows detection of changes in the refractive index of the confined lubricant film which could be related to changes in film thickness (Drainage of a nanoconfined simple fluid: Rate effects on squeeze-out dynamics Lionel Bureau and Arnaud Arvengas Phys. Rev. E 78, 061501; Nonlinear Rheology of a Nanoconfined Simple Fluid Lionel Bureau Phys. Rev. Lett. 104, 218302).
To demonstrate the advantages of the µSFA with fluorescence imaging, we performed a tribological test using two mica surfaces immersed in a colloidal suspension of silica particles of hydrodynamic diameter Dh = 40 nm. The particles were functionalized with a fluorescent dye to facilitate their detection via epifluorescence imaging. As can be seen in Figure 6A, the tribological results of a standard friction tests measuring the friction force, F‖, as a function of the
normal load, F⊥, show a linear dependence between these two quantities, a behavior described by
Amonton’s laws of friction.1 The linear relationship between F
‖ and F⊥ suggests that the friction coefficient between the two surfaces (defined as µ = F‖/F⊥) is constant and independent of F⊥ which would appear to indicate that surface damage did not occur during the test. Furthermore, as can be seen in Figure 6B, the FECO fringes do not necessarily present any sign of damage of the surface but rather local deformations (see Figure 6B). As previously reported, signs of surface damage appear in the FECO fringes as discontinuities in the fringe pattern due to loss of mica or even detachment of mica from the reflective layer.( Fundamental experimental studies in tribology: The transition from “interfacial” friction of undamaged molecularly smooth surfaces to “normal” friction with wear Andrew M.Homola Jacob N.Israelachvili Patricia M.McGuiggan Michelle L.GeeVolume 136, Issue 1, February 1990, Pages 65-83) However, top view fluorescence imaging of
the contact reveals a very different situation. Real-time imaging shows accumulation of particles in multiple wear tracks parallel to the sliding direction and distributed throughout the contact, a phenomenon called the “mending effect”.(Investigation of the mending effect and mechanism of copper
nano-particles on a tribologically stressed surface Tribology Letters, Vol. 17, No. 4, November 2004)
Observation of such phenomenon is almost impossible with FECO or bright field imaging of the top view. FECO fringes sample a cross section of the contact geometry and therefore provide highly localized information of the contact geometry. Fluorescence imaging (Fig. 6Cc) demonstrates that surface damage does occur, and that crack filling by nanoparticles during shear almost instantaneously mitigates the expected fluctuations in friction forces normally observed during wear initiation and propagation, resulting in a linear relationship between frictional forces and load despite the surface damage.
Figure 6. [Xavier and Lee: please use lower-case letters in the figure numbering] (a) T
ribological test between two mica surfaces immersed in a suspension of silica nanoparticles at 0.3%w/w. The linear relationship between the normal force F⊥and the friction force F‖ over the entire load ranges apparently indicates that no damage of the surfaces occurred during the test. (b) FECO image of the contact obtained at high load (~ 10 mN) demonstrating local deformation of the contact due to uneven distribution of the nanoparticles in the contact area (indicated by the white arrow). The view does not show any signs of contact damage. (c) Top view of the contact obtained by fluorescence imaging of the silica nanoparticles. The image shows the sliding trajectory of the contact with its contour as well as the region depleted in nanoparticles which is heavily damaged. Particle aggregates produced during shearing can be seen outside of the contact area (empty white arrows). Scale bars represent 50 mm.
Surface plasmon resonance (SPR) spectroscopy is a useful tool for characterizing and quantifying biomolecular interactions and measuring the binding of analytes to immobilized biomolecules without using labels.35 The most common SPR sensors include a gold or silver film (40-60 nm thickness)36 deposited on a prism. This film thickness is similar to the gold or silver layers (40-55nm thickness) used as reflecting layer in the interferometric technique in the SFA. Therefore, it is possible to design an SPR attachment for the SFA, as seen in Figure 7, that allows simultaneous detection of changes in the dielectric near the SPR surfaces (e.g., refractive index changes from molecular binding and mass transfer) while carrying out SFA measurements.
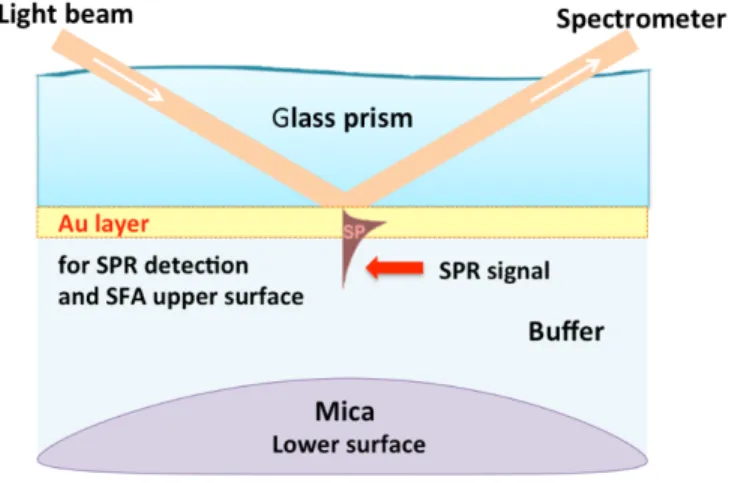
Figure 7. Scheme of simultaneous SFA and SPR measurements of intermolecular and surface
interactions by SPR-µSFA. The top surface is a 43 nm thick layer of gold with a dual purpose of a reflective layer for the interferometric SFA technique and a SPR surface.
Figure 8a depicts the setup for combination of surface plasmon resonance (SPR) with a Surface Forces Apparatus (SFA). For the SPR attachment, light from a white light source is passed through a collimator to produce a parallel beam. After passing the polarizer, p-polarized incident light is produced that propagates towards a glass prism coated with a gold layer (Fig. 8b). Under
the condition of attenuated total reflection (ATR), the energy of incident light is coupled to excite surface plasmons and consequently weaken the intensity of reflected light.37 The reflected light is coupled to an output collimator and guided through an optical fiber and into a spectrometer. As the resonant wavelength is sensitive to the surface refractive index, and the refractive index typically changes on molecular adsorption, we can monitor the molecular binding behavior on the gold surface through the changes to the SPR resonant wavelength.38 Conveniently, surfaces coated with gold nanofilm can also serve as the top reflective surface of the SFA. This setup allows for simultaneous SFA and SPR measurements.
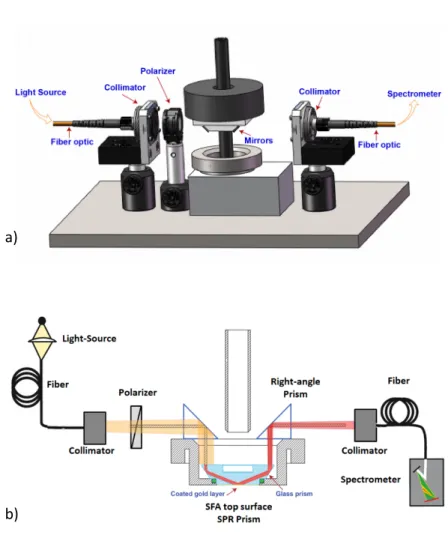
Figure 8. (a) Sketch of the SPR-µSFA setup, and (b) schematic of a glass prism coated with a gold layer sitting in the SFA top mount. The surface plasmon resonance (SPR) attachment
a)
consists of an input white light source (DH-2000-BAL, Ocean Optics), a collimator (74-UV, Ocean Optics), a polarizer (LPNIRE11S, Thorlabs), a pair of right-angle prisms to guide the light, a custom-made BK-7 glass prism with 45° angled walls that reflects the white light to the center of the SPR prism (top surface of the SFA), an output collimator (74-UV, Ocean Optics) and an optical fiber (SPLIT-400-VIS-NIR, Ocean Optics) that is connected to the inputs of a spectrometer (HR4000, Ocean Optics). The SPR surface is a mica-templated layer of 43 nm gold. The SPR attachment is coupled with a µSFA setup.
In order to evaluate the sensitivity of the SPR-µSFA setup to the surrounding refractive index, the resonant wavelengths are measured for various water/glycerol mixtures (v/v% glycerol = 0-25%) with refractive index (RI) between 1.333 and 1.368. Figure 9a shows the increase (i.e., redshift) in SPR signal wavelength as the concentration of glycerol in the water/glycerol mixtures increases. Figure 9b shows the relationship between SPR signal wavelength and the refractive index, which confirms the refractive index sensitivity of the SPR signal wavelength.
Figure 9. (a) Reflectivity spectra of the SPR-µSFA setup in water/glycerol mixtures with different volume of glycerol (v/v% glycerol = 0-25%). (b) Plot of the resonant wavelength shift
vs. the refractive index (RI) value of the SPR-SFA setup. The inset shows the RI value of each water/glycerol mixture. [Rongxin: is the red curve a fit or a theoretical line?]
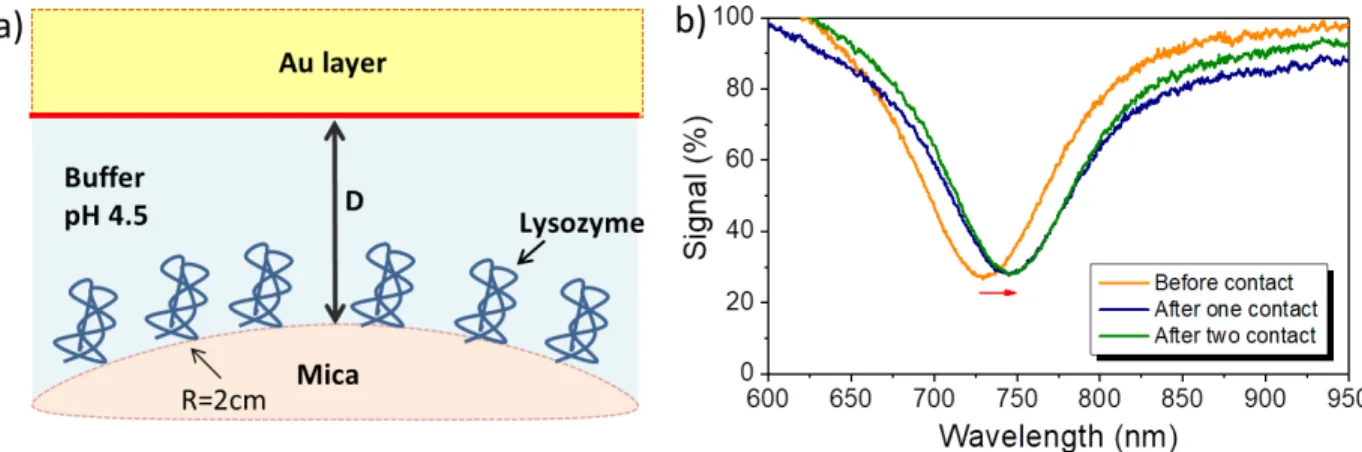
To demonstrate the ability of the SPR-µSFA to detect protein mass transfer, we measured the mass transfer of lysozymes from the apposing mica surface to the gold surface. The mica surface was incubated for 1 hour in a 50 µL lysozyme solution (pH=4.5) allowing lysozyme to physically adsorb onto the mica surface. The mica was then rinsed with PBS, resulting in a lysozyme film on the mica as depicted schematically in Figure 10a. The lysozyme film was brought into contact with the gold surface for 3 min, and then separated. The approach and separation velocities were 5nm/min. The reflectivity spectra and corresponding SPR wavelength values were recorded before and after each contact. Figure 10b shows that after the first contact of the two surfaces, lysozyme molecules were partially transferred from mica surface to gold surface, resulting in an increase in SPR wavelength. After the second approach and separation, there was no further increase in SPR wavelength, which indicated the mass transfer of lysozyme from mica to gold mainly occurred during the first contact. Further contact between the two surfaces did not induce any mass transfer. The surface forces were not measured, but could have provided information about changes in adhesion and other inter-surface interactions.
Figure 10. (a) Schematic of the interaction between a mica substrate coated with lysozyme and a
bare Au top surface. (b) Reflectivity spectra of the SPR-μSFA setup before and after the two surfaces come into contact.
The SPR-μSFA setup can also be applied to real-time monitoring the kinetics of specific binding as a function of the separation distance and to in situ examination of the changes in the conformations of molecules (e.g., polymers) adsorbed on or trapped between the surfaces under normal and shear forces. With the aid of the accurate distance control of the μSFA, the effect of distance between the gold nanofilm and adsorbed molecules (at the apposing mica surface) on the SPR signal can be directly studied.
Newton’s Rings-μSFA and Raman-μSFA
To make the μSFA compatible with other spectroscopy techniques that require very short working distance between objective lens and sample or special sample substrates, an optical analysis technique based on Newton’s Rings was developed that can capture high-resolution force-distance data between glass surfaces. Here, we describe this Newton’s Rings method, and demonstrate that the method allows the μSFA to be coupled with Raman spectroscopy.
The classical SFA uses back-silvered mica in a crossed-cylinder geometry to obtain fringes of equal chromatic order (FECO) to measure surface separation distance,16, 39 which results in several limitations. First, mica is notoriously difficult to prepare with the proper degree of cleanliness.19, 40 Mica is also mostly inert and can only be functionalized after plasma activation which provides a higher density of reactive surface silanols.41 The back-silvering results in ~95% reflectance, which makes optical measurements difficult. This challenge has been surpassed by using dielectric coatings with engineered wavelength transmission windows for e.g., fluorescence microscopy,17, 42-43 but such coatings are difficult to prepare. In spectroscopic applications, the birefringence of mica distorts the point-spread-function of the microscope and makes reproducible spectroscopic analyses difficult, particularly for Raman spectroscopy [Steve: REF?]. Finally, the mica is typically mounted on cylindrical silica lenses with thicknesses of several mm.16 These lenses therefore only accommodate microscope objectives with a working distance of generally ≥ 10 mm. For these reasons, there are only a limited number of examples that combine spectroscopy with force measurement or controlled confinement in the literature, 44-46 none of which have reached widespread use to date.
To surpass the limitations of short working distance of the objective lens and back-silvered mica substrates, we developed a sphere-on-flat measurement mode for μSFA that uses high-resolution images of Newton’s Rings for the distance measurement and glass surfaces in lieu of mica, which we henceforth refer to as Newton’s Rings-SFA (NR-μSFA). As shown in Figure 11a, the μSFA can be configured such that a spherical glass lens mounted on a double cantilever spring approaches a flat glass coverslip glued on the bottom port of the μSFA. The μSFA is then mounted on an inverted microscope. The μSFA is designed to accommodate the microscope objective (Fig. 11b) such that the objective can reach the bottom of the coverslip, permitting the
use of very short working distance objectives with high numerical aperture can be used, enabling high-resolution imaging. This configuration also eliminates many of the limitations of preparing mica surfaces by using optically transparent glass surfaces, which are easy to clean and functionalize (however, not atomically smooth as mica).
Figure 11. Sphere-flat configuration in the μSFA. (a) A spherical surface mounted on a double
cantilever spring approaches downwards to a circular optical window or cover slip of thickness 0.16-0.2 mm, and (b) a cross section view shows that the μSFA accommodates the microscope objective, allowing the use of short working distance objectives.
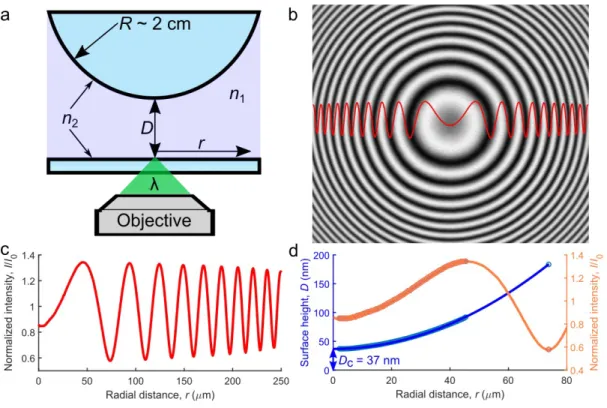
A simplified schematic of the geometry is shown in Figure 12a. The contact area is illuminated with monochromatic light of wavelength λ and the light interferes between the two surfaces of refractive index n2 through the medium refractive index n1. The reflected light is imaged in an inverted microscope to acquire Newton’s Rings patterns during the approach and separation of the top sphere. An example of a background corrected Newton’s Rings pattern is shown in Figure 12b. The pattern is then radially averaged to obtain the intensity profile as a function of radial distance I(r) from the center (Fig. 12c).
Figure 12. Newton’s Rings method for measuring separation distance. (a) A schematic of the
sphere-on-flat configuration illuminated by monochromatic light of wavelength λ that gives (b) a high-resolution Newton’s Rings pattern. The Newton’s Rings in (b) are radially averaged to obtain (c) the intensity profile I(r) which can be analyzed as discussed in the text to reconstruct the (d) surface profile D(r) and the center distance DC.
The shape of the surface can be reconstructed from this intensity profile, a procedure commonly used in Reflection Interference Contrast Microscopy (RICM).47-51 Indeed, Newton’s Rings have been used for force measurements as far back as Derjaguin in 1958,52 and RICM itself has been used to measure surface forces of air bubbles and other soft particles previously.48-49 A similar RICM shape-reconstruction procedure was used recently for AFM force measurements,50 but never in this context for SFA. Here, we calculate the surface profile D(r) using Equation 1, which accounts for the intensity profile within the first extremum,
D (r)= λ 4 π n1cos
−1
(
A−I (r )B)
,(1)
where A = (Imax + Imin)/2, and B = (Imax – Imin)/2. For r outside of the first extremum, a height increment of λm/4n1 is used to calculate D(r) at each extremum, where m is the extremum number. Equation 1 assumes parallel planar interfaces, an appropriate assumption given the large radius of curvature of surfaces commonly used in SFA, typically R ~ 1-2 cm.50
An example of the intensity profile measurement and corresponding surface profile calculation is shown in Figure 12d for the first two extrema. The intensity profile (orange curve, Fig. 12d) at small values of r contains a small number of pixels included in the radial average and is generally excluded from the analysis. The height profile (blue points, Fig. 12d) is calculated from the intensity profile (orange points, Fig. 12d) using equation 1 and the first two extrema. In this example, a spherical shape (R = 1.9 cm) fits the intensity data, (blue curve, Fig. 11d) and the fit yields the separation distance at the center of the contact area, i.e., D(r=0) = DC = 37 nm, which is the relevant distance for the force measurement. Due to the geometry of the surfaces, nm-scale movement of the surface corresponds to micron-scale movement of I(r) in the region r ~ 5-80 μm, which is easily resolvable with conventional optical microscopy. Therefore, this surface reconstruction procedure enables measurement of DC with nm-level resolution, allowing for accurate measurement of force-distance profiles, as shown further below.
To demonstrate the utility and accuracy of NR-μSFA, we measured normal force as function of separation distance between glass surfaces in 1 mM, 10 mM, and 100 mM KCl, as shown in Figure 13. The long-range interactions are well-fitted by standard electrostatic double layer
theory. Importantly, the fitted Debye length corresponds closely to the expected Debye length at each salt concentration. Repeated measurements overlay each other in the force-distance profile, demonstrating that the distance measurement is reliable and the interactions are reversible (i.e., the same on approach and retraction) and reproducible. To further quantify the distance accuracy, the inset of Figure 13 shows a zoomed-in view of a single force profile at high force. The observed noise envelope of ~0.5 nm is due to slight variability in the optical analysis and sphere fitting procedure. This noise level is satisfactory for measuring most colloidal interactions, especially long-range interactions.
Figure 13. [Steve: please add concentrations next to the colored lines in the plot and “KCl” at
top-centered.] Force profiles measured in 1 mM KCl (black), 10 mM KCl (red), and 100 mM KCl (blue). Closed points are measured during approach and open points are measured during separation. The different symbols represent separate approach-retraction measurements (4 sets of approach-retract are displayed for each salt concentration). The lines represent a best fit of the
electrostatic forces. The inset shows a single run at high force to illustrate the relative noise level of the distance measurement.
Next, we used NR-μSFA in a home-built inverted microscope to measure force-distance curves simultaneously with Raman spectroscopy (note: this can also be integrated into commercially available microscopes. Steve: OK?). As shown in Figure 14, the microscope accommodates independent light paths for the Newton’s Rings imaging and the Raman spectroscopy. A high numerical aperture oil immersion objective (Nikon, 1.4 NA 60X, working distance ~ 130 μm), accommodated by the bottom port of the μSFA, is used for simultaneous acquisition of Newton’s Rings images and Raman spectra. White light is sent through a 488 nm (blue) bandpass filter (Steve: XXX, Thorlabs) and reflected at the contact location in the SFA, then imaged with a CMOS camera to obtain the Newton’s Rings. A 532 nm green laser is used for the Raman excitation and focused at the center of the Newton’s Rings. The inelastically backscattered light (Raman scattering) is efficiently collected with the same high numerical aperture objective and steered via a 535 nm long-pass dichroic mirror (Steve: XXX, Thorlabs) into the spectrometer (Steve: type and model?). A notch filter blocks residual light from the excitation laser.
Figure 14. Optical setup for coupling μSFA with Raman spectroscopy. The white light (WL)
passes through a blue filter and is reflected by the dichroic (Di1) through the objective (O) to the contact zone of the μSFA, where the Newton’s Rings are reflected, back through O, steered through the beam-splitter (BS) and imaged with a CMOS camera (Steve: type and model?). The double arrow indicates a plano-convex lens to focus (Steve: OK?). The Raman excitation passes through both dichroic mirrors (Di2 and Di1) [Steve: please indicate in figure which dichroic mirror is Di1 and Di2], and the Raman scattering signal is transmitted by Di1 and steered by Di2 into the spectrometer.
To demonstrate concurrent μSFA/Raman spectroscopy measurements, we simultaneously measured Newton’s Rings and Raman spectra during approach and separation of two glass surfaces immersed in 1 mM KCl, as shown in Figure 15. The force curve obtained from NR-μSFA is nearly identical to the one shown for 1 mM KCl in Figure 13 above. The measured decay length of ~9 nm is close to the theoretical Debye length κ-1 = 9.6 nm in 1 mM KCl predicted from Debye-Hückel theory.1 A Raman spectrum was acquired at each distance during the approach and retraction, and the inset of Figure 15 displays background-subtracted Raman spectra at different surface separation distances. The broad O-H stretch resonance observed in this spectral region is assigned to water confined between the two glass surfaces. Integrating the Raman signal intensity over this 3100-3700 cm-1 spectral region of the O-H stretch, and plotting this intensity as a function of the measured distance (Fig. 15), shows a linear intensity decrease as the surfaces are confined. The linear behavior of the Raman intensity with separation distance results from two aspects: (i) the vibrational density of states does not change upon confinement and (ii) the separation distances of interest (DC < 100 nm) are much smaller than the longitudinal resolution of the 532-nm focus (~3 μm). These results show that we can measure correlated
changes in the Raman spectrum during approach and retraction of the surfaces in the μSFA. This multimodal Raman-μSFA technique is therefore useful for probing chemical information near interfaces during confinement.
Figure 15. Force-distance profile (black points, filled approach and open
points-separation) and correlated Raman signal intensity (orange lines, solid and dashed corresponding to approach and separation, respectively) of the water between the surfaces measured simultaneously. The inset shows the Raman spectrum at different values of DC.
It is interesting to note that the minimum separation distance (hard-wall thickness) of the surfaces was DC~13 nm. This is corroborated by the Raman signal, which is still above the noise level at this separation. The measurement shown in Figure 13 exhibits a similar nano-scale hard-wall at DC~5 nm. The discrepancy between the hard-wall thicknesses measured in these experiments is likely due to heterogeneous asperities on the glass surfaces. The optical grade glass surfaces used here are polished but exhibit nanometer-level roughness, as measured by
atomic force microscopy (AFM) shown in Supporting Information. The overall root-mean-square surface roughness is 0.5 nm, but several asperities ranging from 5-15 nm in height are observed over a representative 20×20 μm area. Provided large asperities do not arise in the center of the contact zone, representative force measurements can be made to obtain results shown in Figures 13 and 15. The change in slope observed at DC~15 nm in Figure 15 and DC~10 nm in Figure 13 is likely due to steric compression of such asperities.
As presented here, there are both advantages and disadvantages of NR-μSFA compared to FECO. Sample preparation is vastly simplified, it is easily adaptable for multimodal techniques, can be implemented on most standard inverted microscopes without additional required equipment, short working distance objectives can be used, and sub-nm distance resolution can be achieved. As with the standard SFA technique, particle contamination is sometimes unavoidable, and in this case can be detected via the Newton’s Rings by direct observation of microscopic particles, or if the surfaces exhibit unexpected repulsive forces. The absolute distance measurement is less direct than FECO and it is necessary to confirm that one is measuring the contact fringe by applying high force at the end of an experiment. More rigorous optical modeling of the Fresnel coefficients is currently underway and should provide more direct distance information. While the measurements shown here demonstrate that clean contact zones can be observed with commercially purchased surfaces, the roughness of the glass surfaces is not ideal for molecular scale force measurements; this aspect will be addressed in more detail in future work. Nonetheless, we have shown here that NR-μSFA enables straightforward sample preparation, accurate force measurements, and facile multi-modality, including Raman spectroscopy. We anticipate that the NR-μSFA technique will prove suitable for a wide range of systems in soft matter, interfacial phenomena, and tribology.
CONCLUSIONS
We have shown that standard normal force measurements are feasible and equally accurate with the new µSFA as the established standard Surface Forces Apparatus, the SFA2000. Furthermore, the µSFA has the additional benefit of enabling concurrent optical and spectroscopic measurements of systems under confinement and shear. Here we have shown the feasibility of concurrent SFA measurements with fluorescence microscopy, Surface Plasmon Resonance Spectroscopy, and Raman Spectroscopy; other techniques can also be incorporated into the µSFA due to its small size and large ports. The benefit of simultaneous measurements is to unambiguously establish relationships of information obtained from complementary techniques under identical condition (i.e., same temperature, salt concentration, pH, and time-dependent history of the surfaces and liquid). The complimentary multimodal measurements enabled by the μSFA are expected to provide essential insight into diverse, complex, and sensitive systems with broad relevance for understanding tribological, biological, and physiochemical phenomena at interfaces.
AUTHOR INFORMATION
Corresponding Author
*Email: [email protected]; Phone: +1-805-893-5268.
Present Addresses
ֆCurrent address (Zachariah J. Berkson): Department of Chemistry and Applied Sciences, ETH
Zurich, 8093 Zürich, Switzerland. ACKNOWLEDGMENT
The development of the µSFA has been supported by the US Department of Energy, Office of Basic Energy Research, Division of Materials Sciences and Engineering under Award #DE-FG02-87ER45331 and by SurForce LLC.
REFERENCES
1. Israelachvili, J. N., Intermolecular and Surface Forces, 3rd Edition. Intermolecular and Surface Forces, 3rd Edition 2011, 1-674.
2. Duke, C. B., The birth and evolution of surface science: Child of the union of science and technology. P Natl Acad Sci USA 2003, 100 (7), 3858-3864.
3. Boles, M. A.; Ling, D.; Hyeon, T.; Talapin, D. V., The surface science of nanocrystals. Nat Mater
2016, 15 (2), 141-153.
4. Kim, B. Y. S.; Rutka, J. T.; Chan, W. C. W., Current Concepts: Nanomedicine. New Engl J Med 2010,
363 (25), 2434-2443.
5. Papastavrou, G., Combining electrochemistry and direct force measurements: from the control of surface properties towards applications. Colloid Polym Sci 2010, 288 (12-13), 1201-1214.
6. Ding, S. Y.; Yi, J.; Li, J. F.; Ren, B.; Wu, D. Y.; Panneerselvam, R.; Tian, Z. Q., Nanostructure-based plasmon-enhanced Raman spectroscopy for surface analysis of materials. Nat Rev Mater 2016, 1 (6). 7. Wang, G.; Rodahl, M.; Edvardsson, M.; Svedhem, S.; Ohlsson, G.; Hook, F.; Kasemo, B., A combined reflectometry and quartz crystal microbalance with dissipation setup for surface interaction studies. Rev Sci Instrum 2008, 79 (7).
8. Zhang, N.; Schweiss, R.; Zong, Y.; Knoll, W., Electrochemical surface plasmon spectroscopy -Recent developments and applications. Electrochim Acta 2007, 52 (8), 2869-2875.
9. Kircher, M. F.; de la Zerda, A.; Jokerst, J. V.; Zavaleta, C. L.; Kempen, P. J.; Mittra, E.; Pitter, K.; Huang, R. M.; Campos, C.; Habte, F.; Sinclair, R.; Brennan, C. W.; Mellinghoff, I. K.; Holland, E. C.; Gambhir, S. S., A brain tumor molecular imaging strategy using a new triple-modality MRI-photoacoustic-Raman nanoparticle. Nat Med 2012, 18 (5), 829-U235.
10. Golan, Y.; Seitz, M.; Luo, C.; Martin-Herranz, A.; Yasa, M.; Li, Y. L.; Safinya, C. R.; Israelachvili, J., The x-ray surface forces apparatus for simultaneous x-ray diffraction and direct normal and lateral force measurements. Rev Sci Instrum 2002, 73 (6), 2486-2488.
11. Valtiner, M.; Banquy, X.; Kristiansen, K.; Greene, G. W.; Israelachvili, J. N., The Electrochemical Surface Forces Apparatus: The Effect of Surface Roughness, Electrostatic Surface Potentials, and Anodic Oxide Growth on Interaction Forces, and Friction between Dissimilar Surfaces in Aqueous Solutions.
Langmuir 2012, 28 (36), 13080-13093.
12. Banquy, X.; Kristiansen, K.; Lee, D. W.; Israelachvili, J. N., Adhesion and hemifusion of cytoplasmic myelin lipid membranes are highly dependent on the lipid composition. Bba-Biomembranes 2012, 1818
(3), 402-410.
13. Banquy, X.; Lee, D. W.; Kristiansen, K.; Gebbie, M. A.; Israelachvili, J. N., Interaction Forces between Supported Lipid Bilayers in the Presence of PEGylated Polymers. Biomacromolecules 2016, 17
(1), 88-97.
14. Min, Y.; Kristiansen, K.; Boggs, J. M.; Husted, C.; Zasadzinski, J. A.; Israeiachvill, J., Interaction forces and adhesion of supported myelin lipid bilayers modulated by myelin basic protein. P Natl Acad Sci USA 2009, 106 (9), 3154-3159.
15. Israelachvili, J. N.; Tabor, D., Measurement of Van-Der-Waals Dispersion Forces in Range 1.4 to 130 nm. Nature-Phys Sci 1972, 236 (68), 106-+.
16. Israelachvili, J.; Min, Y.; Akbulut, M.; Alig, A.; Carver, G.; Greene, W.; Kristiansen, K.; Meyer, E.; Pesika, N.; Rosenberg, K.; Zeng, H., Recent advances in the surface forces apparatus (SFA) technique. Rep Prog Phys 2010, 73 (3).
17. Lee, D. W.; Kristiansen, K.; Donaldson, S. H.; Cadirov, N.; Banquy, X.; Israelachvili, J. N., Real-time intermembrane force measurements and imaging of lipid domain morphology during hemifusion. Nat Commun 2015, 6.
18. Kristiansen, K.; Banquy, X.; Zeng, H. B.; Charrault, E.; Giasson, S.; Israelachvili, J., Measurements of Anisotropic (Off-Axis) Friction-Induced Motion. Adv Mater 2012, 24 (38), 5236-5241.
19. Israelachvili, J. N.; Alcantar, N. A.; Maeda, N.; Mates, T. E.; Ruths, M., Preparing contamination-free mica substrates for surface characterization, force measurements, and imaging. Langmuir 2004, 20
(9), 3616-3622.
20. Heuberger, M., The extended surface forces apparatus. Part I. Fast spectral correlation interferometry. Rev Sci Instrum 2001, 72 (3), 1700-1707.
21. Heuberger, M.; Luengo, G.; Israelachvili, J., Topographic information from multiple beam interferometry in the surface forces apparatus. Langmuir 1997, 13 (14), 3839-3848.
22. Kienle, D. F.; Kuhl, T. L., Analyzing refractive index profiles of confined fluids by interferometry part II: Multilayer and asymmetric systems. Anal Chim Acta 2016, 936, 236-244.
23. Levins, J. M.; Vanderlick, T. K., Extended Spectral-Analysis of Multiple-Beam Interferometry - a Technique to Study Metallic-Films in the Surface Forces Apparatus. Langmuir 1994, 10 (7), 2389-2394. 24. Schwenzfeier, K. A.; Erbe, A.; Bilotto, P.; Lengauer, M.; Merola, C.; Cheng, H. W.; Mears, L. L. E.; Valtiner, M., Optimizing multiple beam interferometry in the surface forces apparatus: Novel optics, reflection mode modeling, metal layer thicknesses, birefringence, and rotation of anisotropic layers. Rev Sci Instrum 2019, 90, 043908.
25. Huang, B.; Bates, M.; Zhuang, X. W., Super-Resolution Fluorescence Microscopy. Annu Rev Biochem 2009, 78, 993-1016.
26. Ruedas-Rama, M. J.; Walters, J. D.; Orte, A.; Hall, E. A. H., Fluorescent nanoparticles for intracellular sensing: A review. Anal Chim Acta 2012, 751, 1-23.
27. Dempsey, G. T.; Vaughan, J. C.; Chen, K. H.; Bates, M.; Zhuang, X. W., Evaluation of fluorophores for optimal performance in localization-based super-resolution imaging. Nat Methods 2011, 8 (12), 1027-1036.
28. Hama, H.; Kurokawa, H.; Kawano, H.; Ando, R.; Shimogori, T.; Noda, H.; Fukami, K.; Sakaue-Sawano, A.; Miyawaki, A., Scale: a chemical approach for fluorescence imaging and reconstruction of transparent mouse brain. Nat Neurosci 2011, 14 (11), 1481-U166.
29. Okabe, K.; Inada, N.; Gota, C.; Harada, Y.; Funatsu, T.; Uchiyama, S., Intracellular temperature mapping with a fluorescent polymeric thermometer and fluorescence lifetime imaging microscopy. Nat Commun 2012, 3.
30. Sbalzarini, I. F.; Koumoutsakos, P., Feature point tracking and trajectory analysis for video imaging in cell biology. J Struct Biol 2005, 151 (2), 182-195.
31. Schindelin, J.; Arganda-Carreras, I.; Frise, E.; Kaynig, V.; Longair, M.; Pietzsch, T.; Preibisch, S.; Rueden, C.; Saalfeld, S.; Schmid, B.; Tinevez, J. Y.; White, D. J.; Hartenstein, V.; Eliceiri, K.; Tomancak, P.; Cardona, A., Fiji: an open-source platform for biological-image analysis. Nat Methods 2012, 9 (7), 676-682.
32. Lee, D. W.; Banquy, X.; Das, S.; Cadirov, N.; Jay, G.; Israelachvili, J., Effects of molecular weight of grafted hyaluronic acid on wear initiation. Acta Biomater 2014, 10 (5), 1817-1823.
33. Lee, D. W.; Banquy, X.; Israelachvili, J. N., Stick-slip friction and wear of articular joints. P Natl Acad Sci USA 2013, 110 (7), E567-E574.
34. Banquy, X.; Lee, D. W.; Das, S.; Hogan, J.; Israelachvili, J. N., Shear-Induced Aggregation of Mammalian Synovial Fluid Components under Boundary Lubrication Conditions. Adv Funct Mater 2014,
24 (21), 3152-3161.
35. Kabashin, A. V.; Evans, P.; Pastkovsky, S.; Hendren, W.; Wurtz, G. A.; Atkinson, R.; Pollard, R.; Podolskiy, V. A.; Zayats, A. V., Plasmonic nanorod metamaterials for biosensing. Nat Mater 2009, 8 (11), 867-871.
36. Subramanian, P.; Lesniewski, A.; Kaminska, I.; Vlandas, A.; Vasilescu, A.; Niedziolka-Jonsson, J.; Pichonat, E.; Happy, H.; Boukherroub, R.; Szunerits, S., Lysozyme detection on aptamer functionalized graphene-coated SPR interfaces. Biosens Bioelectron 2013, 50, 239-243.
37. Zeng, S. W.; Baillargeat, D.; Ho, H. P.; Yong, K. T., Nanomaterials enhanced surface plasmon resonance for biological and chemical sensing applications. Chem Soc Rev 2014, 43 (10), 3426-3452. 38. Tokel, O.; Inci, F.; Demirci, U., Advances in Plasmonic Technologies for Point of Care Applications.
Chem Rev 2014, 114 (11), 5728-5752.
39. Israelachvili, J. N.; Adams, G. E., Measurement of Forces between 2 Mica Surfaces in Aqueous-Electrolyte Solutions in Range 0-100 Nm. J Chem Soc Farad T 1 1978, 74, 975-&.
40. Lin, Z. Q.; Granick, S., Platinum nanoparticles at mica surfaces. Langmuir 2003, 19 (17), 7061-7070.
41. Liberelle, B.; Banquy, X.; Giasson, S., Stability of silanols and grafted alkylsilane monolayers on plasma-activated mica surfaces. Langmuir 2008, 24 (7), 3280-3288.
42. Mukhopadhyay, A.; Zhao, J.; Bae, S. C.; Granick, S., An integrated platform for surface forces measurements and fluorescence correlation spectroscopy. Rev Sci Instrum 2003, 74 (6), 3067-3072. 43. Wang, Y. J.; Li, F.; Rodriguez, N.; Lafosse, X.; Gourier, C.; Perez, E.; Pincet, F., Snapshot of sequential SNARE assembling states between membranes shows that N-terminal transient assembly initializes fusion. P Natl Acad Sci USA 2016, 113 (13), 3533-3538.
44. Bae, S. C.; Lee, H.; Lin, Z. Q.; Granick, S., Chemical imaging in a surface forces apparatus: Confocal Raman spectroscopy of confined poly(dimethylsiloxane). Langmuir 2005, 21 (13), 5685-5688.
45. Nanjundiah, K.; Kurian, A.; Kaur, S.; Singla, S.; Dhinojwala, A., Crystallinelike Ordering of Confined Liquids at the Moving Contact Line. Phys Rev Lett 2019, 122 (12).
46. Praveena, M.; Bain, C. D.; Jayaram, V.; Biswas, S. K., Total internal reflection (TIR) Raman tribometer: a new tool for in situ study of friction-induced material transfer. Rsc Adv 2013, 3 (16), 5401-5411.
47. Contreras-Naranjo, J. C.; Ugaz, V. M., A nanometre-scale resolution interference-based probe of interfacial phenomena between microscopic objects and surfaces. Nat Commun 2013, 4.
48. Manica, R.; Parkinson, L.; Ralston, J.; Chan, D. Y. C., Interpreting the Dynamic Interaction between a Very Small Rising Bubble and a Hydrophilic Titania Surface. J Phys Chem C 2010, 114 (4), 1942-1946. 49. Radler, J.; Sackmann, E., On the Measurement of Weak Repulsive and Frictional Colloidal Forces by Reflection Interference Contrast Microscopy. Langmuir 1992, 8 (3), 848-853.
50. Shi, C.; Cui, X.; Xie, L.; Liu, Q. X.; Chan, D. Y. C.; Israelachvili, J. N.; Zeng, H. B., Measuring Forces and Spatiotemporal Evolution of Thin Water Films between an Air Bubble and Solid Surfaces of Different Hydrophobicity. Acs Nano 2015, 9 (1), 95-104.
51. Wiegand, G.; Neumaier, K. R.; Sackmann, E., Microinterferometry: three-dimensional reconstruction of surface microtopography for thin-film and wetting studies by reflection interference contrast microscopy (RICM). Appl Optics 1998, 37 (29), 6892-6905.
52. Derjaguin, B. V.; Abrikossova, I. I., Direct Measurements of Molecular Attraction of Solids. J Phys Chem Solids 1958, 5 (1-2), 1-10.