HAL Id: hal-00361366
https://hal.archives-ouvertes.fr/hal-00361366
Submitted on 13 Feb 2009
HAL is a multi-disciplinary open access
archive for the deposit and dissemination of
sci-entific research documents, whether they are
pub-lished or not. The documents may come from
teaching and research institutions in France or
abroad, or from public or private research centers.
L’archive ouverte pluridisciplinaire HAL, est
destinée au dépôt et à la diffusion de documents
scientifiques de niveau recherche, publiés ou non,
émanant des établissements d’enseignement et de
recherche français ou étrangers, des laboratoires
publics ou privés.
Lamissa Diabate, Jan Remund, Lucien Wald
To cite this version:
Lamissa Diabate, Jan Remund, Lucien Wald. Linke turbidity factors for several sites in Africa. Solar
Energy, Elsevier, 2003, 75 (2), pp.111-119. �hal-00361366�
LINKE TURBIDITY FACTORS FOR SEVERAL SITES IN AFRICA
Diabaté L. (1), Remund J. (2), Wald L. (3)(1) UFAE / GCMI, BP E4018, 410, avenue Van Vollenhoven, Bamako, Mali (2) Meteotest, Fabrikstrasse, Bern, Switzerland
(3) Groupe Télédétection & Modélisation, Ecole des Mines de Paris, BP 207, 06904 Sophia Antipolis cedex, France. Tel.: +33 (0) 4.93.95.74.49 Fax: +33 (0) 4.93.95.75.35. E-mail : lucien.wald@ensmp.fr
ABSTRACT
The Linke turbidity factor (TL) has been estimated at sixteen locations in Africa (9 stations in Egypt, 2 in Mozambique and Zimbabwe, 1 in Algeria, Tunisia and Zambia). An appropriate processing of time-series of measurements of daily sums of solar global radiation spanning several years provides mean values of TL for each month with a sufficient accuracy. Though limited to the Mediterranean area, Egypt and sub-tropical Southeastern part, this work greatly extends the knowledge on the clearness of the atmosphere in Africa, an area not much addressed in the literature. The relationship between TL and the climate is evidenced. TL is almost constant throughout the year close to the Mediterranean basin with values around 3.5. Stations located in the sub- tropical Southeastern part exhibit large variations of TL.
Keywords: turbidity, atmosphere optics, radiation
1. Nomenclature
γs the solar altitude angle
γsnoon the solar altitude angle at local noon
p the air pressure at the geographical site
p0 the air pressure at sea level
m(γS) the relative optical air mass
TL the Linke turbidity factor for an air mass equal to 2
TLm long-term monthly average of the Linke turbidity factor for an air mass equal to 2
G0d the extraterrestrial daily irradiation on the horizontal plane
KTd the clearness index for a day, that is the ratio of the daily irradiation to the extraterrestrial daily
irradiation G0d
kh the minimum sun angle corrected clearness index for each hour
khmean the average value of kh for all hours of a day
2. Introduction
The Linke turbidity factor (TL, for an air mass equal to 2) is a very convenient approximation to model the atmospheric absorption and scattering of the solar radiation under clear skies. It describes the optical thickness of the atmosphere due to both the absorption by the water vapor and the absorption and scattering by the aerosol particles relative to a dry and clean atmosphere (WMO, 1981; Kasten, 1996). The larger TL, the larger the attenuation of the radiation by the clear sky atmosphere. It is a convenient parameter to summarize the turbidity of the atmosphere and is often used by engineers and consultants. It is a key input to several models assessing the downwelling irradiance under clear skies that are used by several communities in the fields of renewable energies, climatology, agro-meteorology, and atmospheric pollution. These issues are of importance in Africa and are evidenced by regional policies and international projects (e.g., Agrhymet or ACMAD).
TL can be obtained directly from observations performed during very clear sky periods, but this kind of experimental data is rarely available, thus TL is generally an estimated parameter. Also, time series of radiation data are generally too short to allow estimation on a daily basis. Fortunately, long-term monthly average values, TLm, are sufficient for most applications. Several methods for estimating TLm values can be found in the
literature: for example from time series of daily global horizontal irradiation (Aguiar, in ESRA 2000), monthly Angström sum (Page, 1986), aerosol properties and water vapor content (Gueymard 1994) or subjective assessments of the type of atmospheric conditions prevailing in the region of interest (linear regression with latitude and with the Atmospheric Turbidity Index, Dogniaux and Lemoine, 1983).
There is only a few sites in Africa where TLm is known. We have identified only four sites for which TLm values
are found in the literature: Northeast of Morocco (Diouri et al. 2000), Ile-Ife in Nigeria (Adeyefa et al. 1991), Cairo in Egypt (El-Hussainy, Omran 1998; Mosalam Shaltou et al. 1996) and El-Menia in Egypt (Mosalam Shaltou et al. 2001). To these, should be added the ten sites for Morocco and three for the former Spanish Sahara that can be found in the Web site www.helioclim.net and computed from monthly Angström sums found in the ESRA (2000) (Angles et al. 1998, 1999). Morocco is well-covered but there is no assessment or so for the remaining of the continent.
The purpose of the study is to palliate this shortcoming and to increase the knowledge on TLm in Africa. To
reach that goal, time-series of daily sums of global radiation were collected and analyzed for sixteen sites.
2. Data
In order to find out a significant mean value of the Linke factor, only stations having data measurements spanning several years were processed in this study. On the basis of this criteria, we selected stations among those proposed by the World Radiation Data Center (WRDC) at its Web site. These stations are listed in Table 1. Period is 1994-1999. We found only sixteen stations, when excluding Morocco. Nine are in Egypt. Two are in the Mediterranean area (Algeria and Tunisia). The other stations are in the Southeastern sub-tropical area (Mozambique, Zimbabwe and Zambia). The data are composed of time-series of daily sums of global radiation (daily irradiation). At the time of the data collection, it was only possible to display the data on the computer screen; the data were then manually digitized at UFAE, with possible typing errors.
The quality of the ground data measurements of the global irradiation was controlled by the means of the Web tool described by Geiger et al. (2002). The objective of this quality control is not to perform a precise and fine control, an objective out reach without details on the site and instruments used for measurements, but to flag the data that are obviously questionable. The aim of these procedures are to perform a likelihood control of the data and to check the plausibility of the measurements. The controlled time-series served as a basis for the present work but were also used in the framework of the project SoDa (Wald 2000; Wald et al. 2002), to validate the new method Heliosat-II (Lefèvre et al. 2002; Rigollier et al. 2003) and to prepare worldwide maps of the TLm
(Remund et al. 2003).
3. Method used to estimate TLm
Cucumo et al. (2000) propose a method for calculating TLm from a time series of daily irradiation. This method
is based on i) the computation of the direct and diffuse components by the means of the Collares-Pereira and Rabl correlation, ii) the modeling of each component as an analytical function of TLm and iii) the inversion of
these models. The method was applied to several sites in Italy. For these sites, the authors used the maximum daily irradiation values read per month in the ESRA (1984). These maxima are those found in the time-series of daily irradiation spanning the period 1966-1975.
Walkenhorst et al. (2002) processed time-series of hourly means of beam irradiance. The Linke turbidity factor was calculated for the four hours around noon for each day by inverting the ESRA formula for the clear sky
beam irradiance (ESRA 2000; Rigollier et al. 2002). From the resulting calculated set of TL for each month, the smallest three are averaged and this mean serves as an approximation for TLm.
The approach used here is based on that proposed by Aguiar in 1995, reported in the ESRA (2000). It is easier to implement and operated than that of Cucumo et al. It does not require the analytical inversion of the clear-sky model. Given a time-series of daily sums spanning several years, the maximum daily irradiation is retained for each year of the period and each month at each site. Here, five years are available and thus five maxima are extracted for each month. In order to avoid cloudy days, these daily irradiations must satisfy the following criteria based on the daily clearness index, KTd:
KTd = Gd / G0d (1)
where Gd is the daily irradiation and G0d the extraterrestrial daily irradiation. Define γsnoon as the solar altitude angle
at local noon. Let define also kh for each hour as the minimum sun angle corrected clearness index (Pedros et al.
1999):
kh = 0.7 / [1.031 exp-(1.4/(0.9+9.4/(m p / p0))) + 0.1] (2)
where m is the air mass, defined in the clear sky model (Geiger et al. 2002; Remund et al. 2003):
m(γS) = 1 / [ sin γS + 0.50572 (γS + 6.07995)-1.6364] (3)
Let define khmean as the average value of kh for all hours of the day. The conditions to be filled by the daily
clearness index KTd are (Remund et al. 2003):
If γsnoon> 30°, KTd should be greater than 0.8 khmean, otherwise reject data
If 30° ≥γsnoon> 15°, KTd should be greater than 0.6 khmean, otherwise reject data
If 15° ≥γsnoon> 4°, KTd should be greater than 0.4 khmean, otherwise reject data
If 4° ≥γsnoon, reject data
To further filter cloudy days, only are kept the three greatest values for each month. They are averaged and this forms the clear sky daily irradiation characterizing the site under concern. No processing was done if the number of years was less than 5. In these cases it was believed that no reliable estimate of TLm can be obtained.
For each site and each month, TLm is varied from 2 to 8 by step of 0.1 until the output of the clear sky model
corresponds to this clear sky daily irradiation. In that way, twelve values of TLm are obtained for a given site,
one per month.
The clear sky model used is that of the ESRA (2000), detailed and validated by Rigollier et al. (2000), including the corrections described in Remund and Page (2002) and Page (submitted for publication), already used and reported by Geiger et al. (2002) and Remund et al. (in press). In the original model, the formula for the Rayleigh
optical thickness behaves incorrectly with terrain altitude. This was not evidenced in the paper of Rigollier et al. because the sites used for validation have altitudes less than 500 m. Also the TL value in the diffuse transmittance should be corrected by a multiplying factor p/p0, where p0 is the air pressure at sea level and p that at the site. The
model was developed by the means of data acquired in Europe. The tests made by Rigollier et al. spanned several latitudes and climates in Europe and included the station of Sede Boquer in Israel. There is no indice that indicates that the model behaves incorrectly for other climates, especially in Africa.
The whole approach was tested by using several groups of sites for which TLm was estimated in an independent
way. In the first of the four tests, TLm was estimated by the means of the measurements of the water vapor
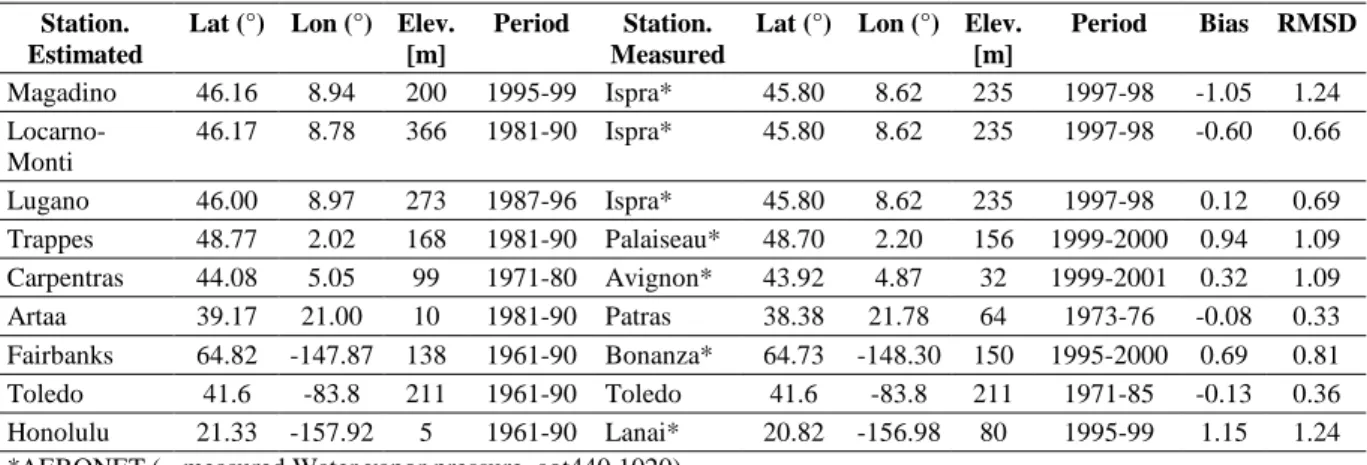
pressure and aerosol optical depth at 440 and 1020 nm performed in the AERONET network (Holben et al. 2001) following the work of Gueymard (1994) (Remund et al. 2003). Two other stations (Patras and Toledo) were added for which TLm is considered known (Table 2). Nine surrounding stations are available with long-term
time-series of daily irradiation and located within 1° of arc angle of one of the seven stations of reference with a difference in altitudes less than 200 m. The periods of measurements are not the same for these nine stations and differ from those of the seven stations. For these nine stations, TLm was assessed as explained above. Those
estimates were compared to the known values (Table 2). The bias is –0.1 and the root mean square difference (RMSD) is 0.9 (Table 5). One may note in Table 2 the large fluctuations that can be observed between estimates at three different sites and known values for the station Ispra. The bias is very different and this tells us how cautious we should be in using such references.
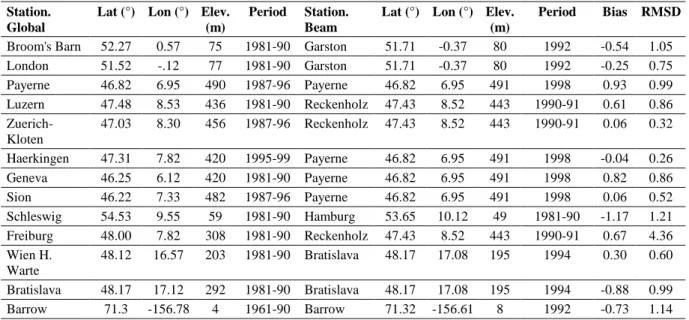
In the three other tests, sites are used for which time-series of daily beam irradiation are available. From these time-series, TLm is computed in an analytical way by inverting the equations for the beam component in the clear
sky model (Remund et al. 2003). The minimum value is retained as TLm. In the second test, six stations are used
(five in Europe, one in Alaska, Table 3). Thirteen surrounding stations (same conditions as above) were found for which TLm is derived by the explained approach from time-series of global irradiation. The periods of
measurements are not the same. The bias is 0.1 and the RMSD is 0.8 (Table 5).
In the third test, twenty-two stations are used for which time-series of daily global and beam irradiation are available but for different periods (Table 4). The bias is –0.3 and the RMSD is 0.6. The fourth test is performed with a sub-set of these stations for which the time-series are available simultaneously for the period 1981-1990 (ESRA 2000). The six stations under concern are Uccle, Hamburg, Braunschweig, Dresden, Trier, Würzburg and Weihenstephan. The bias is –0.5 and the RMSD is 0.6 (Table 5).
From these tests, one obtains hints of the uncertainties attached to the assessments of TLmbased on time-series of
global irradiation. It can be concluded that the uncertainty is ± 0.6-0.9. This is fairly large but in any case less than the day-to-day variations of TL.
4. Results and discussions
The series of TLm obtained are reported in Table 6 for the sixteen stations. Six groups of stations were identified
according to the values of TLm and their variations during the year. These groups have links to climate zones:
• sub-tropical humid climate in the South of Africa, at sea level (Fig. 1),
• sub-tropical humid climate in the South of Africa, high elevation plateaus (Fig. 2),
• Sahara climate at high elevation (Fig. 3),
• industrialized areas in semi-arid climate (Fig. 4),
• desert Nile climate (Fig. 5),
• Mediterranean climate (Fig. 6).
The intra-group variations are large and once the uncertainty in the assessment of TLm taken into account, the
number of groups may differ. The first four groups will remain as they exhibit very different features but the two last groups: desert Nile climate and Mediterranean climate, may be aggregated.
There are five stations located in the South of Africa, in a sub-tropical humid climate. Two of them, Maputo and Tete (both in Mozambique) are located either at the ocean shoreline (Maputo) or along the Zambeze River at low elevation (Fig. 1). The TLm values for both sites follow the same trend; they fluctuate around 3.5 ranging
between 3 and 4 throughout the year. The lowest values are found in March-May and the highest in September-November. In Figure 1, one may note two outliers, one for Tete in September, the other for Maputo in October. The causes are unknown. They may result from bad quality or inappropriate data sets.
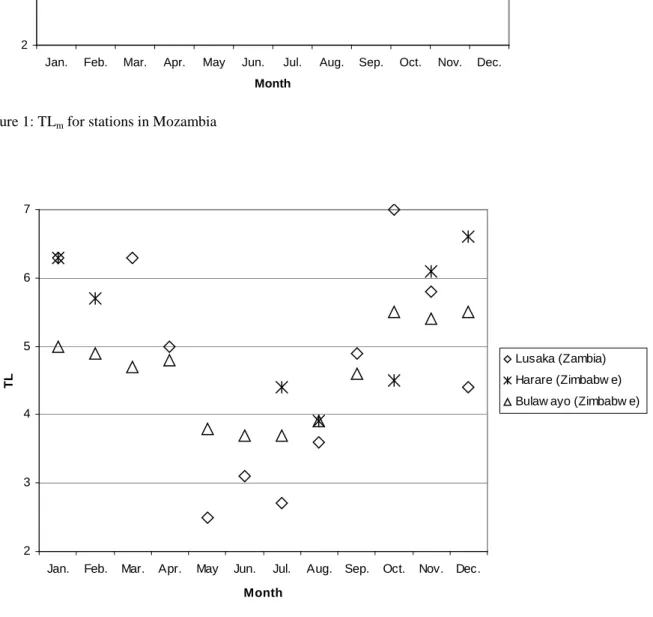
The TLm values differ for the three other stations that have higher elevation. The stations in Zambia and
Zimbabwe are on high plateaus, with elevations close to or higher than 1300 m (Fig. 2). TLm offers a large range
of values (2.5 to 7) and exhibits the same dynamics: the values decrease from January (around 6) to May (approx. 3.5), are more or less constant till July and then increase with a maximum attained in October-December. These three periods may be related to the local climate that is hot and humid in January (austral summer), dry and cool during the austral winter (low TLm), then hot but still dry with increasing aerosol loading
The Tamanrasset station is single in the Sahara climate group (Fig. 3). This station has a high elevation (1377 m). This property may prevent this station to be used as a representative for the Sahara desert. TLm reaches its
lowest in February (2.6), then increases fairly regularly up to 4.7 in October, which is its maximum.
The industrialized areas in semi-arid climate group (Fig. 4) comprises the stations Tahrir, Bahtim and Cairo, located in Egypt. These stations are characterized by a semi-arid climate that differs from that of the Mediterranean shoreline and they are close to or within the large cities of Cairo and Alexandria. Cairo is one of the largest cities in Africa (approximately 13 million of inhabitants); Alexandria comprises approximately 3 million inhabitants. Both cities are the seat of industries and the traffic of vehicles is large. The TLm values are
large compared to those of the Mediterranean group and range between 4 and 6. The group is heterogeneous. The station Cairo HQ exhibits the extreme values of this group, with low values in winter and high values in spring and summer, in agreement with the previous work of El-Hussainy, Omran (1998) on Cairo and to a lesser extent with that of Mosalam Shaltout et al. (1996) for the city of Helwan, in the suburb of Cairo, who processed only one year of data. These agreements sustain the validity of our method.
The stations of Asyut, El Arish and Aswan compose the desert Nile climate group (Fig. 5). They are located along the Nile River in the desert. The values are quasi-constant from January to June, around 3.5, with a minimum in February-March. Then, the values increase up to 4.5 in August and decrease till February. Mosalam Shaltout et al. (2001) analysed hourly irradiation data for the year 1997 for the city of Menia, approximately 200 km North of Asyut. They reported a similar behavior with minima in winter and maxima in summer, the latter being due to dust and partly to the local industry.
The Mediterranean climate group (Fig. 6) comprises the stations located close to the Mediterranean Sea: one in Tunisia (Sidi Bou Said) and three in Egypt (Sidi Barrani, Rafah and Mersa Matruh). TLm is almost constant all
along the year and fluctuates around 4 with low values in winter (3.5) and largest values (4.5) in August-September. One may notice the case of Mersa Matruh. This station has the same latitude than Sidi Barrani and is located approximately 200 km to the East. It exhibits extreme values for most of the months compared to the others and the fluctuations are more pronounced. This may be explained either by the quality of the data or by local orographic effects but we cannot go further with our set of data.
In the graph are reported three time-series of TLm obtained for the stations of Al Hoceima, Tetouan and Nador,
located on the Mediterranean coast of Morocco. These values are derived by the means of the Page formula (1986) applied to the monthly Angström sum found in the ESRA (2000). One sees that these values are in fairly agreement with the four others. However, one may note that this group is very heterogenous. The behaviour for all stations is not the same. The stations for Morocco have a very similar behaviour but differ from the others. This may be explained either by the way TLm has been derived for these stations or by the hypothesis that there
is not an unique optical climate for the African Mediterranean area. More studies are needed for this area.
5. Conclusion
This work provides estimates of long-term monthly average values of the Linke turbidity factor TLm for sixteen
stations in Africa. Agreement with previous works made on coincident stations or areas in Egypt show that the approach is valuable for Africa. These results strongly increase the sparse knowledge available in Africa on this parameter. The analysis of the values of TLm, the range and the behavior throughout the year, demonstrates that
TLm is related to the climate, a unsurprising result.
The values obtained by this study have been used by the project SoDa for the creation of world-wide maps of the Linke turbidity factor for each month (Remund et al. 2003; Lefèvre et al. 2003). The method for assessing TLm
can be re-used on other time-series of daily sums of global radiation spanning several years. Tests made with other sites in the world demonstrate an uncertainty in the assessment of 0.6-0.9.
6. Acknowledgements
This work was partly supported by the European Commission under Contract Number IST-1999-12245, by the Service de Coopération et d'Action Culturelle de l'Ambassade de France au Mali, by the Swiss Federal Office of Energy, Bern (contract No. 79564) and the Swiss Federal Office for Education and Science (contract No. 99.0513). We are thankful to Djénéba Tounkara and Rokia Berthé from UFAE for the manual digitizing of the data used in this study. Comments by the referees greatly improve this paper. Many thanks go to H. Gilgen and A. Ohmura of Institute for Atmosphere and Climate ETH (IACETH) for BSRN data and data of Payerne and Reckenholz. Further we thank the principal investigators Brent Holben and Chuck McClain from GSFC, NASA and Didier Tanré from Univ. Lille for AERONET level 2.0 data. Swiss Meteorological Institute (SMI) provided data of ten stations.
7. References
ACMAD, African Center for Meteorological Applications for Development, see on-line at http://www.acmad.ne. Adeyefa Z.D., Adedokun J.A. (1991) Pyrheliometric determination of atmospheric turbidity in the harmattan
season over Ile-Ife, Nigeria. Renewable Energy, 1 (3-4), 555-566.
Agrhymet, Centre Régional de Formation et d'Applications en Agro-Météorologie et Hydrologie Opérationnelles, see on-line at www.agrhymet.ne/cilssaccueil.htm.
Angles J., Ménard L., Bauer O., Wald L. (1998) A Web server for accessing a database on solar radiation parameters. In Proceedings of the Earth Observation & Geo-Spatial Web and Internet Workshop '98, Josef Strobl & Clive Best (Eds), Salzburger Geographische Materialien, Universität Salzburg, Salzburg, Austria, Heft 27, pp. 33-34: http://www.sbg.ac.at/geo/eogeo/authors/angles/angles.html.
Angles J., Menard L., Bauer O., Rigollier C., Wald L. (1999) A climatological database of the Linke turbidity factor. In Proceedings of the ISES Solar World Congress 1999, Jerusalem, Israel, July 4-9, 1999, volume I, pp 432-434.
Cucumo M., Kaliakatsos D., Marinelli V. (2000) A calculation method for the estimation of the Linke turbidity factor. Renewable Energy, 19, 249-258.
Diouri M., El Amraoui L., Jaenicke R., Schutz L. (2000) Atmospheric turbidity over the Angad area of Morocco.
Journal of Aerosol Science, 31 (suppl.1), 279-280.
Dogniaux R., Lemoine, M. (1983) In: W. Palz (Ed.), Solar Energy R&D in the European Community, Series F, Vol. 2, Solar Radiation Data. D. Reidel Publ., Dordrecht, pp. 94-107.
El-Hussainy, Omran, (1998) Analysis and trends of atmospheric turbidity parameters over Cairo. Meteorology
and Atmospheric Physics, 66 (1-2), 113-121.
ESRA (1984) European Solar Radiation Atlas. Second Improved and Extended Edition, Vols. I and II. (1984) W. Palz (Ed.). Commission of the European Communities, DG Science, Research and Development, Report No. EUR 9344, Brussels.
ESRA (2000) European Solar Radiation Atlas, includ. CD-ROM. Edited by J. Greif, K. Scharmer. Scientific advisors: R. Dogniaux, J. K. Page. Authors : L. Wald, M. Albuisson, G. Czeplak, B. Bourges, R. Aguiar, H. Lund, A. Joukoff, U. Terzenbach, H. G. Beyer, E. P. Borisenko. Published for the Commission of the European Communities by Presses de l'Ecole, Ecole des Mines de Paris, France.
http://www.helioclim.net/esra/.
Geiger M., Diabaté L., Ménard L., Wald L. (2002) A web service for controlling the quality of global solar radiation irradiation. Solar Energy, 73 (6), 475-480.
Gueymard C., 1994. Analysis of monthly average atmospheric precipitable water and turbidity in Canada and Northern United States. Solar Energy, 53 (1), 57-71.
Holben B.N., Tanré D., Smirnov A., Eck T.F., Slutsker I., Abuhassan N., Newcomb W.W., Schafer J.S., Chatenet B., Lavenue F., Kaufman Y.J., Van de Castle J., Setzer A., Markham B., Clark D., Frouin R., Halethore R., Karnieli A., O'Neill N.T., Pietras C., Pinker R.T., Voss K., Zibordi G. (2001) An emerging ground-based aerosol climatology. Aerosol optical depth from Aeronet. Journal of Geophysical Research, 106D: 12067-12097.
Kasten F. (1996) The Linke turbidity factor based on improved values of the integral Rayleigh optical thickness.
Lefèvre M., Rigollier C., Cros S., Albuisson M., Wald L. (2002) A shortwave radiation database to support GODAE-related activities. Proceedings of the International Symposium "En route to GODAE", 13-15 June 2002, Biarritz, France. Published by CNES, Toulouse, France, 2002, pp. 157-158.
Lefèvre M., Remund J., Albuisson M., Ranchin T., Wald L. (2003) Fusing ground measurements and satellite-derived products for the construction of climatological maps in atmosphere optics. To be published in Proceedings of the EARSeL Annual Symposium, Gent, Belgium, 2-5 June 2003.
Mosalam Shaltou M.A., Ali Rahoma U., Fathy A. (1996) Spectral measurements of visible solar direct-normal irradiance and air pollutant attenuation coefficients at Helwan. Renewable Energy, 7(1), 81-88.
Mosalam Shaltou M. A., Hassan A. H., Fathy A. (2001) Study of solar radiation over Menia. Renewable Energy, 23 (3-4), 621-639.
Page J.K. (1986) Prediction of solar radiation on inclined surfaces. Solar Energy R&D in the European Community, Series F, Vol. 3, Solar Radiation Data, D. Reidel Publishing Company, Dordrecht, Holland. Page J.K. (2003) A site elevation based methodology for the estimation of the Linke turbidity factor. Submitted
to Solar Energy.
Pedros, R., Utrillas, J.A., Martinez-Lozano, J.A. and Tena, F. (1999) Values of broad band turbidity coefficients in a mediterranean coastal site. Solar Energy, 66(1), 11-20.
Remund J., Page J. (2002) Advanced parameters. Chain of algorithms. Part I: shortwave radiation. Report to the European Commission, SoDa project IST-1999-12245, 13 p. Available on-line at http://www.soda-is.com. Remund J., Wald L., Lefèvre M., Ranchin T., Page J. (2003) Worldwide Linke turbidity information. To be
published in Proceedings of the ISES Solar World Congress 2003, Goeteborg, Sweden, 16-19 June 2003. Rigollier C., Bauer O., Wald L. (2000) On the clear sky model of the 4th European Solar Atlas with respect to
Heliosat method. Solar Energy, 68 (1), 33-48.
Rigollier C., Lefèvre M., Cros S., Wald L. (2003) Heliosat 2: an improved method for the mapping of the solar radiation from Meteosat imagery. In Proceedings of the 2002 EUMETSAT Meteorological Satellite
Conference, Dublin, Ireland, 1-6 September 2002. Published by EUMETSAT, Darmstadt, Germany, pp. 585-592.
Trewartha G. T. (1954) An Introduction to Climate. 3rd ed. McGraw Hill Book Co.
Wald L. (2000) SoDa: a project for the integration and exploitation of networked solar radiation databases. In Proceedings of the European Geophysical Society Meeting, XXV General Assembly, Nice, France, 25-29 April 2000 (CD-ROM).
Wald L., Albuisson M., Best C., Delamare C., Dumortier D., Gaboardi E., Hammer A., Heinemann D., Kift R., Kunz S., Lefèvre M., Leroy S., Martinoli M., Ménard L., Page J., Prager T., Ratto C., Reise C., Remund J., Rimoczi-Paal A., Van der Goot E., Vanroy F., and Webb A. (2002) SoDa: a project for the integration and exploitation of networked solar radiation databases. In: Environmental Communication in the Information Society, W. Pillmann, K. Tochtermann Eds, Part 2, pp. 713-720. Published by the International Society for Environmental Protection, Vienna, Austria.
Walkenhorst O., Luther J., Reinhart C., and Timmer J. (2002) Dynamic annual daylight simulations based on one-hour and one-minute means of irradiance data. Solar Energy, 72 (5), 385-395.
WMO (World Meteorological Organization) 1981. Technical Note No. 172, WMO-No. 557, Geneva, Switzerland, pp. 121-123.
Station Name Latitude (°) Longitude (°) Elevation (m) Period of Measurement WMO-Nr Tamanrasset (Algeria) 22.78 5.52 1377 1995-1999 60680
Sidi Barrani (Egypt) 31.63 25.85 26 1994-1998 62301
Mersa Matruh (Egypt) 31.33 27.22 38 1995-1998 62306
Rafah (Egypt) 31.22 34.22 73 1994-1998 62335 El Arish (Egypt) 31.12 33.75 32 1994-1998 62337 Tahrir (Egypt) 30.65 30.70 19 1994-1998 62345 Bahtim (Egypt) 30.15 31.25 17 1994-1998 62369 Cairo HQ (Egypt) 30.08 31.28 36 1994-1998 62371 Asyut (Egypt) 27.20 31.50 52 1994-1998 62392 Aswan (Egypt) 23.97 32.78 192 1994-1998 62414 Tete (Mozambique) -16.18 33.58 123 1994-1998 67261 Maputo (Mozambique) -25.97 32.60 70 1994-1998 67341 Lusaka (Zambia) -15.42 28.32 1280 1994-1998 67666 Harare (Zimbabwe) -17.83 31.02 1471 1994-1998 67774 Bulawayo (Zimbabwe) -20.15 28.62 1343 1994-1998 67964
Sidi Bou Said (Tunisia) 36.87 10.23 127 1994-1998 No index
Table 1. Description of the stations and data used to calculate the Linke turbidity factor. They are ranked by
Station. Estimated
Lat (°) Lon (°) Elev. [m]
Period Station. Measured
Lat (°) Lon (°) Elev. [m] Period Bias RMSD Magadino 46.16 8.94 200 1995-99 Ispra* 45.80 8.62 235 1997-98 -1.05 1.24 Locarno-Monti 46.17 8.78 366 1981-90 Ispra* 45.80 8.62 235 1997-98 -0.60 0.66 Lugano 46.00 8.97 273 1987-96 Ispra* 45.80 8.62 235 1997-98 0.12 0.69 Trappes 48.77 2.02 168 1981-90 Palaiseau* 48.70 2.20 156 1999-2000 0.94 1.09 Carpentras 44.08 5.05 99 1971-80 Avignon* 43.92 4.87 32 1999-2001 0.32 1.09 Artaa 39.17 21.00 10 1981-90 Patras 38.38 21.78 64 1973-76 -0.08 0.33 Fairbanks 64.82 -147.87 138 1961-90 Bonanza* 64.73 -148.30 150 1995-2000 0.69 0.81 Toledo 41.6 -83.8 211 1961-90 Toledo 41.6 -83.8 211 1971-85 -0.13 0.36 Honolulu 21.33 -157.92 5 1961-90 Lanai* 20.82 -156.98 80 1995-99 1.15 1.24 *AERONET (= measured Water vapor pressure, aot440,1020)
Table 2. Comparison between measured values of TL and estimates (first test). RMSD means root mean square difference.
Station. Global
Lat (°) Lon (°) Elev. (m)
Period Station. Beam
Lat (°) Lon (°) Elev. (m)
Period Bias RMSD Broom's Barn 52.27 0.57 75 1981-90 Garston 51.71 -0.37 80 1992 -0.54 1.05 London 51.52 -.12 77 1981-90 Garston 51.71 -0.37 80 1992 -0.25 0.75 Payerne 46.82 6.95 490 1987-96 Payerne 46.82 6.95 491 1998 0.93 0.99 Luzern 47.48 8.53 436 1981-90 Reckenholz 47.43 8.52 443 1990-91 0.61 0.86 Zuerich-Kloten 47.03 8.30 456 1987-96 Reckenholz 47.43 8.52 443 1990-91 0.06 0.32 Haerkingen 47.31 7.82 420 1995-99 Payerne 46.82 6.95 491 1998 -0.04 0.26 Geneva 46.25 6.12 420 1981-90 Payerne 46.82 6.95 491 1998 0.82 0.86 Sion 46.22 7.33 482 1987-96 Payerne 46.82 6.95 491 1998 0.06 0.52 Schleswig 54.53 9.55 59 1981-90 Hamburg 53.65 10.12 49 1981-90 -1.17 1.21 Freiburg 48.00 7.82 308 1981-90 Reckenholz 47.43 8.52 443 1990-91 0.67 4.36 Wien H. Warte 48.12 16.57 203 1981-90 Bratislava 48.17 17.08 195 1994 0.30 0.60 Bratislava 48.17 17.12 292 1981-90 Bratislava 48.17 17.08 195 1994 -0.88 0.99 Barrow 71.3 -156.78 4 1961-90 Barrow 71.32 -156.61 8 1992 -0.73 1.14
Table 3. Comparison between two sets of values of TL estimated from global and beam radiation (second test). RMSD means root mean square difference.
Name Latitude (°) Longitude (°) Elevation (m)
Period -beam Period - global WMO-Nr
Uccle 50.80 4.35 100 1981-90 1981-90 6447 Hamburg 53.65 10.12 49 1981-90 1981-90 10141 Braunschweig 52.30 10.45 83 1981-90 1981-90 10348 Dresden-Wahnsdorf 51.12 13.68 246 1981-90 1981-90 10486 Trier 49.75 6.67 278 1981-90 1981-90 10609 Wuerzburg 49.77 9.97 275 1981-90 1981-90 10655 Weihenstephan 48.40 11.70 472 1981-90 1981-90 10863 Payerne 46.82 6.95 491 1998 1987-96 6610 Barrow 71.32 -156.61 8 1992 1961-90 70026 Miami 25.80 -80.27 2 1978-85 1961-90 72202 Brownsville 25.90 -97.43 6 1978-84, 88 1961-90 72250 El Paso 31.80 -106.40 1194 1988-90 1961-90 72270 Los Angeles 33.93 -118.40 32 1978-80 1961-90 72295 Raleigh 35.87 -78.78 134 1988-90 1961-90 72306 Fresno 36.77 -119.72 100 1978-80 1961-90 72389 Dodge City 37.77 -99.97 787 1978-80, 88-90 1961-90 72451
Salt Lake City 40.77 -111.97 1288 1988-90 1961-90 72572
Eugene 44.12 -123.22 109 1988-90 1961-90 72693
Caribou 46.87 -68.02 190 1978-85, 88, 90 1961-90 72712
Great Falls 47.48 -111.37 1116 1988-90 1961-90 72775
Seattle 47.45 -122.30 122 1978-80, 88-90 1961-90 72793
San Juan 18.43 -66.00 19 1979-80 1961-90 78526
Test Properties Bias RMSD Nine stations. Seven "reference" stations. Measured values
of TL and estimates. Different periods and stations
-0.1 0.9
Thirteen stations. Six "reference" stations. TL assessed by beam and global radiation. Different periods and stations
0.1 0.8
Twenty-two stations. TL assessed by beam and global radiation. Different periods. Same stations
-0.3 0.6
Eight stations. TL assessed by beam and global radiation. Same periods and stations
-0.5 0.6
Station Name Jan. Feb. Mar. Apr. May Jun. Jul. Aug. Sep. Oct. Nov. Dec. Tamanrasset (Algeria) 2.7 2.6 3.2 3.3 3.2 3.9 4.0 4.4 4.5 4.7 3.5 3.7
Sidi Barrani (Egypt) 3.4 - 4.0 - 4.1 - 4.2 - - 4.5 - 4.1
Mersa Matruh (Egypt) 2.6 4.3 - - 4.4 4.3 - 4.9 4.5 3.0 - -
Rafah (Egypt) 4.2 3.8 - 3.9 4.2 3.9 4.2 4.6 4.4 - - 4.0 El Arish (Egypt) 4.5 3.8 2.9 4.0 3.9 3.7 3.4 4.2 4.1 4.6 4.3 4.3 Tahrir (Egypt) - 4.5 4.5 - 4.0 4.2 - 4.7 4.7 5.0 5.2 4.3 Bahtim (Egypt) - 4.6 4.5 4.9 5.2 4.3 4.6 4.9 5.3 5.2 5.4 - Cairo HQ (Egypt) - 3.9 4.7 4.8 5.3 - 5.4 5.9 5.6 5.3 5.6 - Asyut (Egypt) 3.8 3.4 3.2 3.7 3.7 3.6 4.0 4.6 4.2 4.6 4.4 4.3 Aswan (Egypt) 3.5 3.3 3.9 3.9 - 4.0 4.3 4.4 4.3 - 3.7 3.6 Tete (Mozambique) 3.8 3.3 2.9 2.8 2.8 3.0 3.3 3.7 5.3 4.1 4.3 3.0 Maputo (Mozambique) 3.7 3.8 3.3 3.5 3.0 3.1 3.1 3.0 4.0 2.9 3.5 3.2 Lusaka (Zambia) 6.3 - 6.3 5.0 2.5 3.1 2.7 3.6 4.9 7.0 5.8 4.4 Harare (Zimbabwe) 6.3 5.7 - - - - 4.4 3.9 - 4.5 6.1 6.6 Bulawayo (Zimbabwe) 5.0 4.9 4.7 4.8 3.8 3.7 3.7 3.9 4.6 5.5 5.4 5.5 Sidi Bou Said (Tunisia) 3.8 3.7 3.5 4.3 4.2 4.1 4.5 3.6 4.4 3.6 3.6 3.1
2 3 4 5 6 7
Jan. Feb. Mar. Apr. May Jun. Jul. Aug. Sep. Oct. Nov. Dec. Month
T
L Tete (Mozambia)
Maputo (Mozambia)
Figure 1: TLm for stations in Mozambia
2 3 4 5 6 7
Jan. Feb. Mar. Apr. May Jun. Jul. Aug. Sep. Oct. Nov. Dec. Month
T
L
Lusaka (Zambia) Harare (Zimbabw e) Bulaw ayo (Zimbabw e)
2 3 4 5 6 7
Jan. Feb. Mar. Apr. May Jun. Jul. Aug. Sep. Oct. Nov. Dec.
Month
T
L
Figure 3: TLm for Tamanrasset (Algeria) - Sahara zone
2 3 4 5 6 7
Jan. Feb. Mar. Apr. May Jun. Jul. Aug. Sep. Oct. Nov. Dec.
Month T L Tahrir (Egypt) Bahtim (Egypt) Cairo HQ (Egypt)
2 3 4 5 6 7
Jan. Feb. Mar. Apr. May Jun. Jul. Aug. Sep. Oct. Nov. Dec.
Month T L Asyut (Egypt) Aswan (Egypt) El Arish (Egypt)
Figure 5: TLm in desert zone
2 3 4 5 6 7 1 2 3 4 5 6 7 8 9 10 11 12 Month T L
Sidi Barrani (Egypt) Mersa Matruh (Egypt) Rafah (Egypt)
Sidi Bou Saïd (Tunisia) Al Hoceima
Tetouan Nador
Figure 6: TLm for stations in Mediterranean zone. Superimposed are TLm values derived from the ESRA (2000)