and Health Informatics. This article’s citation is as follows:
Seoud, Lama, Jean Dansereau, Hubert Labelle, and Farida Cheriet. "Noninvasive clinical
assessment of trunk deformities associated with scoliosis." IEEE Journal of Biomedical
and Health Informatics, vol. 17, no. 2, pp. 392-401, 2013.
doi:
10.1109/TITB.2012.2222425
The manuscript, as accepted by the publisher, is reproduced in the following pages.
© 2013 IEEE. Personal use of this material is permitted. Permission from IEEE must be
obtained for all other users, including reprinting/republishing this material for advertising
or promotional purposes, creating new collective works for resale or redistribution to servers
or lists, or reuse of any copyrighted components of this work in other works.
Abstract—Besides the spinal deformity, scoliosis modifies
notably the general appearance of the trunk resulting in trunk rotation, imbalance and asymmetries which constitutes patients' major concern. Existing classifications of scoliosis, based on the type of spinal curve as depicted on radiographs, are currently used to guide treatment strategies. Unfortunately, even though a perfect correction of the spinal curve is achieved, some trunk deformities remain, making patients dissatisfied with the treatment received. The purpose of this study is to identify possible shape patterns of trunk surface deformity associated with scoliosis. First, trunk surface is represented by a multivariate functional trunk shape descriptor based on 3D clinical measurements computed on cross sections of the trunk. Then, the classical formulation of hierarchical clustering is adapted to the case of multivariate functional data and applied to a set of 236 trunk surface 3D reconstructions. The highest internal validity is obtained when considering 11 clusters that explain up to 65% of the variance in our dataset. Our clustering result shows a concordance with the radiographic classification of spinal curves in 68% of the cases. As opposed to radiographic evaluation, the trunk descriptor is three-dimensional and its functional nature offers a compact and elegant description of not only the type, but also the severity and extent of the trunk surface deformity along the trunk length. In future work, new management strategies based on the resulting trunk shape patterns could be thought of in order to improve the esthetic outcome after treatment, and thus patients satisfaction.
Index Terms— Shape analysis, functional data analysis,
clustering, scoliosis.
I. INTRODUCTION
COLIOSIS is a three-dimensional deformity of the spine that consists mainly in a lateral deviation of the spine and an axial rotation of the vertebrae. It results in a deformation of
Manuscript received January, 2012. This paper was supported by the Natural Sciences and Engineering Research Council of Canada (NSERC), the Fonds Québecois pour la Recherche sur la Nature et les Technologies (FQRNT) and MENTOR, a strategic training program of the Canadian Institutes of Health Research (CIHR).
L. Seoud is with the Institute of Biomedical Engineering, École Polytechnique de Montréal, P.O. Box 6079, Succursale Centre-ville, Montréal, H3C 3A7 QC, Canada (lama.seoud@polymtl.ca).
J. Dansereau is with the Institute of Biomedical Engineering, École Polytechnique de Montréal and with Sainte Justine Hospital research center, 3175 Cote-Sainte-Catherine Rd, Montreal, H3T 1C5 QC, Canada.
H. Labelle is with Sainte Justine Hospital research center.
F. Cheriet is with is with the Institute of Biomedical Engineering, École Polytechnique de Montréal and with Sainte Justine Hospital research center.
Copyright (c) 2007 IEEE. Personal use of this material is permitted.
the rib cage, which in turn, modifies notably the general appearance of the trunk. We can notice a hump on the back, a lateral shift of the trunk and asymmetries of the shoulders, the scapula, the waist and the hips. These external manifestations of scoliosis constitute patients major concern and the reason they seek for treatment [1].
Once scoliosis is suspected, a radiographic examination confirms the diagnostic. On the X-rays, the severity is measured using the Cobb angle, the angle between the two most tilted vertebrae in the curvature [2]. The curve type is then defined according to the number of curvatures along the spine and their location.
Scoliosis is most commonly a condition of adolescence; consequently there is a high risk of progression associated to growth spurt. In absence of treatment, it can evolve into severe pulmonary or cardiac complications. For this reason, a radiographic examination is required every 6 months. Not to mention that this recurrent exposition to radiations may have severe implications on patients health [3].
Besides bone maturity, scoliosis management depends mainly on the type and severity of the spinal deformity. Several classifications of scoliosis [4-7] have been developed in order to guide treatment planning. However, these classifications are only based on the spinal deformity. This often leads to a good correction of the spinal alignment, but no or poor correction of the trunk deformities [8, 9]. Consequently, patients are not totally satisfied after surgery.
This problematic has been frequently put forward in the literature and numerous optical systems have been developed for the non-invasive acquisition and analysis of the back or the trunk shape in 3D [10-15]. The literature abounds with studies that try to predict the spinal deformity from the trunk or back shape, with the aim of replacing the radiographic evaluation by a radiation free system [12, 16, 17]. In that objective, some classifications of the trunk surface deformities have been proposed to automatically predict the severity of the spinal curve, starting from trunk shape features. They result from supervised classification schemes (discriminant analysis [18], neural networks [16] and support vector machines [19]) where the classes are forced to converge toward a radiographic meaning, in terms of Cobb angle. In this paper, it is believed that the radiographic evaluation provides functional information about the deformity of the spine, while the trunk surface deformities provide by itself useful information for clinicians about what patients perceive and are concerned
Non Invasive Clinical Assessment Of Trunk
Deformities Associated With Scoliosis
Lama Seoud, Jean Dansereau, Hubert Labelle, Farida Cheriet
about, on a more aesthetic level.
At Sainte-Justine Hospital Research Center (SJHRC), the acquisition and reconstruction of the trunk surface is almost part of the routine in the scoliosis clinic, since 2005, mainly for patients’ evaluation prior to scoliosis surgical treatment. It follows that there exists currently more than 300 trunk reconstructions in our database, which constitutes an interesting dataset for the identification of natural patterns of trunk deformities.
Nevertheless, at this point, the major obstacle resides in the representation and characterization of trunk deformities. Numerous clinical measurements have been proposed for the analysis of trunk deformities. A recent literature review [20] describes all these measurements and the authors emphasize on the lack of consensus in the definition of an optimal set of indices.
Another approach to the analysis of trunk deformities would be based on shape analysis techniques. To our knowledge, the only study that follows this approach is called the structured splines model [17]. It proposes to model the trunk as a distribution of dominants points extracted on a B-spline representation of trunk cross-sections. The method seems promising, however the proposed trunk features are not intuitive for clinicians, making it less suitable in a clinical context.
Finally, a more local analysis of trunk deformities consists in the extraction of cross-sections along the trunk and the computation of measurements that clinicians are familiar with, on each cross-section [21, 22]. This approach is very interesting and intuitive for clinicians. However, in order to simplify subsequent statistical analysis, the multi-level trunk values are sacrificed and only the maximum values along the trunk, which correspond to the most deformed level are considered in the analysis. This approach is too simplistic and do not provide any information about the location of the
deformity, neither its extent.
To overcome this limitation, we recently proposed a functional representation of the multi-level measurements [23]. According to this approach, a measurement is no longer a set of discrete values computed along the trunk but a continuous function or profile that spans the whole trunk length. We favored the functional approach to the classical vector approach for three main reasons. First, the functional representation introduces a smoothing of the raw data, thus a noise reduction. Second, from one trunk level to another, the measurements are highly correlated. And third, the functional representation allows for dimensionality reduction, thus a more compact representation of the data.
Functional data analysis [24] is a recent field in statistics that extends the classical multivariate statistics to the case of functional data. It has been used in several biomedical research fields such as gene expression [25, 26] and gait analysis [27-29], but never to represent scoliosis clinical measurements as a function of trunk levels.
A recent literature review on the trunk shape measurements in scoliosis [20] pointed out that for a trunk shape descriptor to be optimal it needs to be reliable and able to distinguish between different types of surface deformities. While the reliability of the functional measurements, toward differences between successive trunk acquisitions, has been assessed in a previous study [23], this present study will focus on its ability to discriminate among different types of surface deformities associated with scoliosis.
The objective of this paper is to use the functional measurements proposed in [23] to identify possible natural patterns of trunk shape deformities in our large dataset. To do so, we need to adapt a classical clustering approach to the new case of multivariate functional features. Then, a comparative study is conducted between the resulting shape patterns and the radiographic spinal curve types in order to aid in the interpretation of the clustering results.
II. MATERIAL AND METHODS
A. Trunk Acquisition and Reconstruction
Currently at SJHRC, the trunk surface is acquired using 4 optical digitizers (Creaform Inc., Lévis, Québec). Each scanner comprises a color CCD camera and a structured light projector. The acquisition process is the same for all scanners. Four patterns of phase-shifted light fringes are successively projected onto the surface to be reconstructed. By triangulation of the four resulting images, the depth of each surface point is computed relatively to the reference plane of the digitizer. A fifth image, without fringes, acquires the texture of the surface which is then mapped onto the 3D reconstruction.
The 4 digitizers are placed around the subject: on the front, on the back and at ±60° laterally in front of the subject who is asked to stand still in the natural standing posture with the arms slightly abducted in order not to obstruct the lateral scanners’ fields of view. Each digitizer reconstructs a section of the trunk surface. The 4 trunk sections are then registered
Fig. 1. Trunk surface reconstruction in patient-specific reference frame: the X-axis (in red) is parallel to the line joining the anterior superior iliac spines, the Y-axis (in green) is the absolute vertical and the Z-axis (in blue) is the anterior-posterior axis. Three of the four anatomical landmarks, including the origin of the reference frame, are identified by a circular marker (in magenta).
and merged through a multi-head calibration of the system that computes the rigid transformations between the digitizers.
The resulting mesh is composed of 40,000 to 70,000 nodes, depending on the size of the patient. The whole acquisition time is about 4-5 seconds. The accuracy of the reconstruction is of 1.1±0.9 mm over the entire trunk surface [15].
Prior to the first acquisition, a nurse locate 4 anatomic landmarks on the trunk by palpation and places markers over them. These landmarks are the left and right anterior-superior iliac spines (ASIS), the midpoint of the posterior-superior iliac spines (MPSIS) and C7 vertebral prominence (VP). Their 3D position is identified manually on the textured mesh. These anatomical landmarks are used to transpose the trunk mesh into a patient-specific 3D reference frame (Fig. 1) defined such that: the origin is the MPSIS, the Y-axis is the vertical up; the X-axis is the horizontal parallel to the ASIS line, oriented toward the right of the patient; the Z-axis is obtained by cross-product and oriented toward the patient’s back.
B. Clinical Dataset
We included in this study subjects aged between 7 and 20 years old who visited the scoliosis clinic for AIS diagnosis, or AIS follow-up or for their pre-operative visit, and had the trunk surface acquired and reconstructed in 3D. We excluded trunk reconstructions of subjects who were wearing a bra or a shirt during the acquisition, and subjects whose anatomical landmarks were not marked prior to the acquisition.
We had in total 236 trunk reconstructions of 232 distinct subjects (195 girls and 37 boys) which met our criteria. Among these subjects, there were 209 patients with AIS diagnosis and 23 subjects who mostly consulted for back pain issues but weren’t diagnosed as AIS patients. The main radiological and demographic characteristics of the cohort are summarized in Table 1.
C. Trunk Functional Representation
As described in the introduction, the trunk deformity associated to scoliosis is a result of a lateral deviation of the spine together with an axial rotation of the vertebrae and sometimes a change in the physiological curvatures of the spine in the sagittal plane. It follows that the trunk deformity can be similarly represented as a 3D deformation composed of a deviation in the coronal and sagittal planes and a rotation in the transverse plane, especially considering that these three components are not highly correlated with each other [23]. Raw cross-sectional trunk measurements
In the patient-specific reference frame, L horizontal cross-sections equally spaced along the vertical Y axis are extracted
starting from the origin (MPSIS) and going up to the VP. We chose L=300 so that the mean vertical distance between successive cross-sections is about 1.3 mm, almost equal to the lateral resolution of the digitizers (1.2 mm) [15].
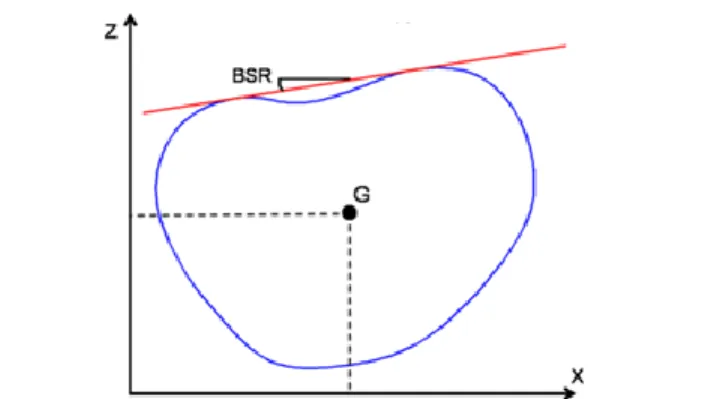
On each cross-section, three measurements are computed automatically (Fig. 2). The back surface rotation (BSR) corresponds to the angle between the dual-tangent to the back portion of the section and the X-axis. Viewed from bottom, the BSR is positive when the dual-tangent is rotated counter-clockwise relatively to the X-axis. The lateral and posterior-anterior shifts of the trunk (XG and ZG, respectively) are
defined as the X and Z coordinates of the center of the section (G). The latter corresponds to the center of the ellipse that best fits the cross-section points and is obtained using the direct least-squares fitting method [30]. This ellipse compensates for undesired asymmetries in the cross-section points, especially due to uneven trimming of the arms resulting in asymmetrical trunk sections at the shoulders level.
Functional Trunk Measurements
To this point, the trunk is described as a set of three discrete measurements series BSR[1,L], XG[1,L]and ZG[1,L]. Instead
of considering a trunk measurement as a vector of 300 values computed discretely along the trunk, we consider a functional representation of the measurement. A functional data denotes an observation that is, in itself, a curve or a function defined on some interval where it is assumed to be smooth [31]. The main idea here is that the unit of observation is considered to be the entire curve rather than just a discrete set of observations.
The first step in FDA is to represent the L raw discrete data x(tl) in a continuous functional form f(t). In our case, each tl
corresponds to a trunk level between 1 and L, corresponding to the MPSIS and PV landmarks, respectively. A functional data is a linear combination of K basis functions {ϕk} weighted by K
coefficients {ak}:
K k k kt
A
t
a
t
f
1)
(
)
(
)
(
(1)The conversion of the raw data to functional form requires two
TABLEI
INFORMATION ABOUT THE COHORT
N=236 acquisitions Mean Standard
Deviation Range
Age at acquisition 14.7 2.1 ( 7 - 20 )
Thoracic Cobb angle (o) 44.8 25.9 ( 0 – 98 )
Lumbar Cobb angle (o) 31.4 21.1 ( 0 – 88 )
Fig. 2. Trunk cross-sectional measurements: bottom view of a typical trunk cross-section (in blue). The back surface rotation (BSR) is the angle between the dual tangent (red line) to the posterior part of the section. The deviation in the frontal and sagittal planes are the X and Z coordinate of the section's center G.
steps: choosing and defining a set of basis functions, and assigning values to the coefficients {ak} so that the function f(t)
best fits the data. The latter is achieved by minimizing the sum of squares:
L l K k l k k la
t
t
x
1 2 1)
(
)
(
(2)Choosing and defining the set of basis functions {ϕk} is a
more decisive issue. The choice of basis functions is based on existing guidelines [24] that widely suggests B-splines to represent non-periodic data. B-spline functions are extremely flexible building blocks for fitting curves. They gain their flexibility in two ways: the sequence of breakpoints that equally divide the interval over which a function is to be approximated, into (M-1) subintervals and the order P that sets the continuity of the function at the breakpoints. The resulting number of basis functions K is then:
2
M P
K (3)
Usually, P is fixed and either M or K is adjusted as needed to get the required flexibility. In our case, we used B-splines basis functions of order 4. Their appearance is beautifully smooth because their second derivative is smooth. As for the number of breakpoints, a simple choice is to consider each value of t in the raw data as a breakpoint. In this case, we assure that the function f(t) fits exactly the raw data. However, original data are generally noisy, which results in a rough function f(t).
Hitchcock et al. suggest that smoothed curves are often clustered more correctly than best-fit curves [32]. A straightforward method to control the smoothness of the function is to limit the number of basis functions. The more basis functions, the better the fit to the data but the higher the risk of fitting undesired noise. Conversely, with too few basis functions, we may over smooth the data and miss important aspects of the “real” function. In previous work [23], we found that K=10 basis functions give a good compromise and that the residual errors between raw and smoothed functional data are of the same order as the typical error of measurements reported in the literature.
At this point, a trunk surface Ti is described as a multivariate functional data. For all three variates (BSR, XG and ZG), the same set of basis functions {ϕk} is used for all patients and only the coefficients {ak} are patient-specific. It follows that the functional representation is a way of reducing the dimensionality of the data. In fact, instead of describing a patient’s trunk using 3x300 values along the trunk, we can now represent it using only a set of 3x10 coefficients and a set of 10 basis functions:
,
,
,
(
)
))
(
),
(
),
(
(
f
t
f
t
f
t
A
A
A
t
T
G G G ZG i X i BSR i Z i X i BSR i i
(4)D. Trunk Functional Clustering
To investigate the existence of possible natural shape patterns of trunk deformities, we searched for clusters in our dataset. Among the different clustering techniques such as K-means clustering, model-based clustering and hierarchical
clustering, we adopted the hierarchical approach because first, it does not require a number of clusters to be decided in advance and second, it provides essential and helpful information on how clusters are structured and nested in each other.
In agglomerative hierarchical clustering, the first step is to compute a distance or dissimilarity matrix between individuals. Then, an agglomerative or linkage criterion is applied to search for clusters of similar individuals.
Dissimilarity between observations
In classical clustering, the dissimilarity is generally measured as either the Euclidean distance or the Mahalanobis distance between two data vectors. However, when the data are curves, an appropriate similarity measure is the squared L2
distance between two functions fi(t) and fj(t) defined on a finite
domain [a,b] [33]:
b af
it
f
jt
dt
j
i
d
2(
,
)
(
)
(
)
2 (5) Considering the algebraic definition of a functional data in equation (1), the functional distance becomes:)
(
)'
(
)
,
(
2 j i j iA
W
A
A
A
j
i
d
(6)where W is a K×K squared matrix with elements:
b a mt
nt
n
m
w
(
,
)
(
)
(
)
(7) When working with orthogonal basis, W would be the identity matrix and clustering the functional data would consist in clustering the coefficients vectors [33]. However, in the case of B-spline basis, the matrix W has to be computed by numerical integration.Since a trunk is represented as a multivariate functional data, the overall distance between observations may be considered as:
)
,
(
)
,
(
)
,
(
)
,
(
T
T
d
2i
j
d
2i
j
d
2i
j
d
G G Z X BSR j i
(8)Of course, in order for the variates to have comparable influence on the clustering and to make up for the difference in units, the three functional measurements are standardized:
) ( ) ( ) ( ) ( ) ( A A t t t t f t f A i i s (9)
where Ā and σA are respectively the mean and standard
deviation of the coefficients vectors calculated over the whole dataset.
Because scoliosis is a complex 3D deformation, it is important to evaluate the deformities in the three anatomic planes. However, due to the documented high variability of the measurements in the sagittal plane [34], the current evaluation of scoliosis and the existing clinical classifications of the spinal curves take the sagittal profile less into consideration compared to the axial and coronal measurements. In this study, we affected weights (a,b,c) to the functional distances and compared several combinations of weights in order to study their effect on the clustering results, more precisely on the internal validity of the clustering according to the validity metrics introduced in subsection E.
The overall distance between two trunks Ti and Tj is now given by: ) , ( ) , ( ) , ( ) , ( 2 2 2 j i d c b a c j i d c b a b j i d c b a a T T d G G Z X BSR j i (10) Linkage Method
Linkage methods are used to determine which clusters should be merged at the next iteration in the agglomerative hierarchical clustering. A comparative study of the four common linkage methods (single linkage, complete linkage, average linkage and Ward’s linkage) showed that Ward’s linkage is usually the best choice for clustering functional data [35].
Ward’s distance corresponds to the inter-cluster inertia lost after merging two clusters [36]. At each step, the algorithm merges clusters in a way that minimizes the loss of inter-cluster inertia. The objective of the inter-clustering being to maximize the inter-cluster inertia (clusters should be highly separated) and to minimize the intra-cluster inertia (observations in the same cluster should be homogeneous). E. Validation of the Clustering
Because different clustering algorithms with different parameters usually give different clusters on the same dataset, it is imperative to assess the validity of the resulting clusters. This is closely related to answering the question of how many natural clusters are in the dataset. In our case, since there exists no reference classifications of trunk deformities, we do not know a priori the right number of clusters or the right similarity threshold. To overcome this limitation, a common approach in the literature [37], is to compute several clustering solutions with different similarity thresholds and to assess cluster quality using some particular metric and then select the best solution.
Cluster quality can be assessed mainly in two ways. First, the resulting clustering can be compared to some gold standard
classification using external validity index as the Rand index that measures the agreement between the two partitions. Or when no a priori knowledge is available, as in our case, the clustering result is evaluated using only quantities inherent to the dataset by means of some internal validity index.
To assess the internal validity of the different clustering results and at the same time to identify the optimal number of clusters, two indices are used: the coefficient of determination R2 and the semi-partial R2 (SPR) [38]. The first one is defined as the ratio of the inter-cluster inertia (between clusters sum of squares) to the total inertia (total sum of squares of the whole dataset). It is considered as a measure of the degree of difference between clusters. The higher its value, the better is the separation between clusters. The second index measures the loss of homogeneity when two clusters are merged; it is given by the ratio of the Ward’s distance at each iteration, to the total sum of squares of the whole dataset. In a plot of the SPR as a function of the number of clusters, the smallest number of clusters at which the SPR increases sharply,
Fig. 3. Effect of weights (a,b,c) on internal validity, expressed as the coefficient of determination (R2) as a function of the number of clusters.
Fig. 4. Dendrogram from hierarchical cluster analysis (Ward's linkage) on the multivariate functional distance matrix. The resulting 11 clusters are identified by distinct colors and numbered from 1 to 11.
indicates the optimal number of clusters.
In addition, to determine the appropriate number of clusters, it is also important to take other criteria into consideration such as interpretability and usefulness of the cluster solutions [39].
F. Interpretation of the Clusters
In order to interpret the resulting clustering, the mean functional measurements of the clusters are analyzed and compared to each other. Also, the closest observation to the center of each clusters are identified and the corresponding trunk surface meshes are visually compared in 3D by a clinical expert.
Since trunk surface deformities associated with AIS are considered as external manifestations of the spinal deformity, radiological information of all the subjects in the cohort were retrieved. More precisely, we are interested in the Cobb angles in the thoracic and lumbar regions (upper 2/3 of the trunk and lower 1/3 of the trunk respectively) as measures of severity, and by the number and location of the curvatures as indicators of curve type. The basic radiological classification of the spinal deformity associated with AIS distinguishes mainly 3 types of curves:
- Main thoracic curve (RX1): the thoracic Cobb angle is superior to the lumbar Cobb angle, by more than 10°.
- Double major curves (RX2): the difference between the thoracic and the lumbar Cobb angles is below 10°.
- Main lumbar curve (RX3): the lumbar Cobb angle is superior to the thoracic Cobb angle, by more than 10°.
We added to this classification a fourth type:
- Low severity curves (RX0): the major Cobb angle is below 20 degrees. Subjects with a mild or a suspected scoliosis are included in this group.
The resulting clustering is compared to this radiological classification using the Rand index. This information is used only for the interpretation of the resulting clusters; it does not constitute a reference or a gold standard.
III. RESULTS
A. Clustering results
The effect of the weights (a,b,c) in Equation (10) on the internal validity is shown in Fig. 3. The R2 coefficient quantifies the percentage of variance in the dataset explained by the clusters. Even though the weights combinations show very similar impact on the internal validity, the highest percentage of explained variance in function of the number of clusters is obtained when considering (a,b,c)=(2,2,1). This means that BSR and XG are given twice more importance than
ZG. This result supports the fact that the sagittal alignment is
less taken into consideration in current scoliosis radiographic classification, compared to the axial rotation and coronal alignment. In the remainder of the paper, we considered (a,b,c)=(2,2,1) in our distance function.
The results of clustering using Ward’s linkage criterion are represented as a dendrogram in Fig. 4. To identify the optimal clustering, distance thresholds between 15 and 200 were applied on the dendrogram and for each threshold the number of clusters was recorded and both validity index (SPR and R2) were computed. Fig. 5 illustrates SPR and R2 as functions of the number of clusters. We can see clearly that the loss of homogeneity increases sharply starting from 11 clusters, meaning that for 1 to 10 clusters in the dataset, the clusters are not so consistent. We chose the result with 11 clusters, since at this threshold, the between clusters differences account for 65% of the variance of the dataset. The 11 clusters are identified by colors in the dendrogram of Fig. 4.
If a 50 or 60 clusters solution in considered, the explained variance will be about 80-90%, however, such solutions are not useful in a clinical context. In fact, the final aim of this cluster analysis is to identify patterns of trunk deformities associated with scoliosis that should be managed differently in order to maximize not only the functional outcome (in terms of reduction of spinal curvature) but also the aesthetic outcome. Ideally, each pattern should be assigned a specific surgical approach. It is thus unfeasible to consider up to 50 different surgical strategies.
Fig. 5. The coefficient of determination (R2) and the semi-partial R2 (SPR)
are used as validity indices to determine the optimal number of clusters.
Fig. 6. Agreement between our clustering result and the radiographic classification.
To examine the confounding effects of age and corpulence on the resulting clustering, we compared the means of the age and the corpulence index of the 11 clusters using one way ANOVA. To quantify the corpulence, we used a scale from 1 to 9 corresponding to the body mass index BMI-for-age percentiles. A value of 1 indicates a BMI below the 5th percentile and a value of 9 indicates a BMI above the 95th percentile. The F statistic showed no significant differences between groups in term of age and corpulence (Fage=0.61 and
FBMI=1.24, p>0.05).
B. Comparison to the radiographic classification
Comparing our clustering result with the radiological classification, we found a Rand index of 0.68 suggesting that in 68% of cases, there is an agreement between the topographic and radiographic classifications. Once again, this comparison between classifications is aimed only for the interpretation of the resulting clusters. The radiographic classification is not our gold standard since radiographic and topographic examinations refer to different aspects of scoliosis deformity. Fig. 6 illustrates for each cluster, the number of trunks classified according to each of the 4 radiographic spinal curve types. This plot clearly shows that clusters 1 to 5 include mainly main thoracic curves (RX1) and clusters 6 and 7 include mainly main lumbar curves (RX3). As for clusters 8 to 11, they include healthy trunks (RX0) (mostly in cluster 10) and trunks with double major curves (RX2) (mostly in clusters 8) and main thoracic curves (RX1) (mostly in cluster 11). Unlike clusters 1 to 7, clusters 8 to 11 are less homogenous in terms of spinal curve type.
C. Interpretation of the clusters
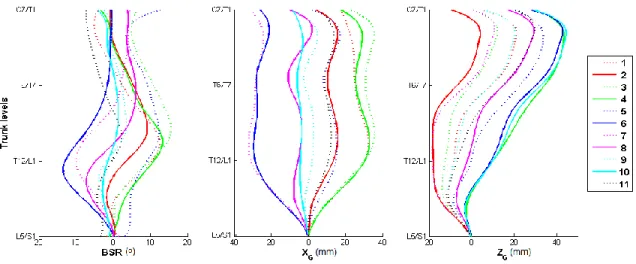
Besides the type of spinal curve, clusters vary mainly according to the severity of the deformations (ranges of BSR and XG), the level of maximum rotation and the sagittal profile
of the trunk ZG. These characteristics are not taken into
consideration in the radiographic classification. Respectively, Fig. 7 and Fig. 8 show, for each cluster, the mean functional measurements and the trunk reconstruction that is the closest to the mean functional measurements. According to these
results:
- Cluster 1 includes trunks with two opposite rotations of the back surface in the thoracic part of the trunk (between C7/T1 and T12/L1). The maximal rotation toward the right of the subject is noticed around the level of T11. Also, trunks in this cluster seem to have a higher left shoulder when compared to the right. These particularities suggest the presence of two thoracic spinal curvatures in the upper part of the trunk.
- Cluster 2 includes trunks with a moderate trunk deviation to the right, a moderate BSR with a maximum value around T9/T10 level and a slight shift of the trunk toward the front of the subject. In the sagittal plane, we can notice a significant inward curvature of the lower part of the trunk known as lordosis.
- Cluster 3 includes trunks that are highly deviated to the right, with a large and extended rotation of the back surface to the right. These particularities suggest the presence of a severe thoracic curvature.
- Cluster 4 includes trunks that are highly deviated to the right, with a large rotation of the back surface to the right with a peak around the level of T11.
- Cluster 5 includes trunks with a moderate trunk deviation to the right, and a moderate and extended rotation of the back toward the right.
- Cluster 6 encompasses trunks highly deviated to the left, with a large rotation of the lower half of the trunk to the left.
- Cluster 7 includes trunks highly deviated to the left with a large rotation of the trunk to the left with a peak around T12/L1 level. In the sagittal plane, we can notice a remarkable lordosis.
- Cluster 8 includes trunks slightly deviated to the left with two opposite rotations of the back surface, the upper part of the trunk is rotated to the right and the lower part is rotated to the left, suggesting the presence of a double major curvature of the underlying spine.
- Cluster 9 also includes trunks underlying a double major curvature of the underlying spine. The main difference with cluster 8 is that trunks in cluster 9 are well aligned in the frontal plane.
Fig. 7. Clusters mean functional BSR, XG and ZG.
- Cluster 10 includes trunks with almost no axial rotation and no lateral deviation.
- Cluster 11 includes trunks slightly deviated to the right with three opposite rotations: a slight rotation to the left in the lumbar part of the trunk (between levels T12/L1 and L5/S1), a slight rotation to the right between levels T9 and T12, and a slight rotation to the left between levels T1 and T9.
D. Case Study
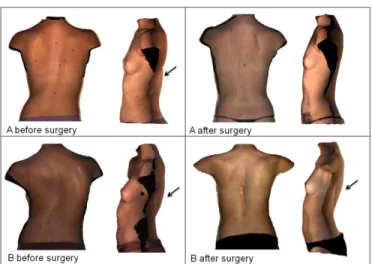
Fig. 9 illustrates the trunk surface acquisition of two female patients with adolescent idiopathic scoliosis. According to their radiographs, the spinal curves of both patients are of the same type (main thoracic curve, Lenke1A [4]). Consequently, they had the same surgical treatment. Nevertheless, up to 18 months after surgeries, the corrections of the trunk surface deformities of the two patients differ (Fig. 10): while the first patient seems to have fewer deformities, the second patient shows an aggravation of the hump. This particular case raises the question of whether or not these two patients should have been managed in the same way.
In fact, according to our clustering results, the two patients with similar spinal curve types fall into two different clusters: patient A falls into cluster 11 and patients B falls into cluster 4. So on a trunk deformity level, the patients are considered very different, even though, according to radiographic classification, both patients falls into the same category of spinal curve (main thoracic curve) which lead the surgeon to propose the same surgical strategy. This preoperative "aesthetic" difference might explain why the exact same surgery achieved a good correction of the trunk deformities for patient A and worsened the trunk deformities of patient B, particularly the axial rotation (BSR) and thus the hump on the back. The latter cannot be assessed on radiographs and thus, it
is not taken into account in current treatment planning. IV. DISCUSSION
In this paper, we propose a clustering method based on functional data analysis to group scoliosis patients’ trunks according to their surface deformities. Results show that a classification into 11 clusters provides good consistency and homogeneity inside each cluster and that the differences between clusters explain up to 65% of the whole variance in the dataset. Between clusters differences are attributed to the amplitude, the level and the extent of the deformations in the frontal and axial planes, and the modification of the trunk balance in the sagittal plane. In addition, the resulting clusters show no significant differences in terms of subjects' age and corpulence.
This study is the first to apply functional data analysis into a shape analysis problem such as the clustering of trunk surface reconstructions. Functional cluster analysis has proved to be valuable for depicting similarities and differences between trunk measurements. The trunk shape is described as a combination of multi-level measurements computed in the transverse (BSR), coronal (XG) and sagittal (ZG) planes. This
multivariate functional representation offers a way of synthesizing information across the three distinct measurements. Moreover, functional data analysis allows taking into consideration the dependency of the deformities to trunk levels, as opposed to taking only the measurements at the most deformed level [21, 22]. This representation assesses not only the amplitude of the deformations but also its location and extent along the trunk.
In this novel trunk shape analysis approach, the trunk is described as a vertically elongated volume that can be
deformed in three possible ways: axial sections of the volume can be rotated around the vertical axis and translated along the two other axes. This description is not information preserving [40], meaning that it does not allow for an accurate reconstruction of the trunk shape from its descriptor. Thus, we might be missing other local deformations. Nevertheless, the three deformations accounted for in our representation describe well the real major deformations associated with scoliosis. Moreover, in the particular case of scoliosis assessment, clinicians are used to a single measurement - the Cobb angle -, to quantify the whole spinal deformity. Thus, to make the assessment more accessible and intuitive in a clinical context, it is important to limit the number of measurements as much as possible, at the expense of losing some information.
The main difficulty in this study resides in the interpretation and validation of the clustering since no reference classification of trunk deformities exists to compare our results with. To overcome this limitation, we evaluated the agreement between the resulting clustering and the radiographic spinal deformity classification even though the two classifications refer to different components of the scoliosis deformity. Despite the fact that the relationship between the surface deformity and the underlying spinal curve is not well documented, we found that the two classifications are related, to some extent. Particularly, there is an excellent distinction between thoracic curves (RX 1) and lumbar curves (RX 3). However, trunks corresponding to double major curves (RX 2) and normal spinal curves (RX 0) are gathered into the same clusters (clusters 8 to 10). In fact, the presence of two major curves along the spine leads to compensation between the deformities of the lower and upper parts of the trunk, resulting in a less deformed trunk shape. To address this point, a larger dataset with more healthy subjects might widen the gap between normal and double major spinal curves.
The lack of a perfect concordance with the radiographic classification can be explained first, by the fact that while the common classifications of scoliosis are essentially based on
the type of spinal curvature, our clustering goes a step further in differentiating trunk shapes not only in terms of underlying spinal curve's type but also according to the severity of the deformations in the three anatomical planes. Moreover, the trunk shape offers 3D information while the radiographic spinal classification is based on a 2D radiograph, thus there is no information about the deformation in other planes, such as the axial rotation causing the hump. The case study presented in the results section illustrates well how two trunks with the same type of underlying spinal curvature differ in 3D, and how the same spinal correction induces different corrections in terms aesthetical outcome, mainly at reducing the hump on the back. We believe that aside the radiographic evaluation of the spinal deformity, consideration of this aesthetic difference into treatment planning might increase the success rate in terms of trunk appearance, and thus patients' satisfaction.
Another novelty in this study is that an unsupervised classification is favored. The clustering algorithm uses only the information provided by our trunk shape features. Radiographic information about the spinal deformity is only used a posteriori for ends of comparison and interpretation. Thus, we can say that, as opposed to previous scoliosis trunk or back shape classifications that were built to concord with radiographic information (Cobb angle or spinal curve type) [16, 18, 19], our classification is neutral. The spine and the trunk deformities are considered in this paper as two distinct components of scoliosis deformity. Both are related to a certain degree (Rand index = 0.68) but they are not completely redundant.
Furthermore, it is the first time that such a large dataset of trunk surface reconstructions is collected and analyzed. Previous studies aiming at characterizing trunk surface deformities made use of less than 150 full trunk reconstructions [17, 19, 22]. A cluster analysis is only feasible when a large dataset is available. With a set of 236 trunk reconstructions, we were able to identify distinct and consistent patterns of trunk deformities associated with scoliosis.
Fig. 9. Posterior and lateral views of trunk surfaces of two female patients (A and B) with scoliosis and with the same type of spinal curve (main thoracic curve, type Lenke1A), before and after surgery. Black arrows show the hump on the back.
Fig. 10. Functional measurements of patients A and B before and after surgery.
At the light of this study, we can conclude that our multivariate functional descriptor of trunk shape is not only reliable [23], but it also allows to distinguish between different types of scoliosis trunk deformities. These two criteria being validated, it can be concluded that our multivariate functional descriptor of trunk shape satisfies the principles of optimality [20] and can be considered as an optimal index for the non-invasive assessment of trunk deformities in scoliosis. It represents a promising tool in scoliosis clinic for two major reasons. First, it provides clinicians a new sight on scoliosis deformity, an automatic and reliable way to examine trunk deformities that constitutes patients' major concern. At the light of our clustering results, new treatment strategies could be thought of in order to improve the esthetic outcome after surgery. Second, the non-invasive acquisition and reconstruction of the trunk surface makes it possible to follow up scoliosis patients more frequently. Future work will be now oriented toward the evaluation of the changes in trunk deformities over time for each cluster in order to predict eventual scoliosis progression.
ACKNOWLEDGMENT
The authors would like to thank P. Debanné for his technical contribution and for revising this manuscript.
REFERENCES
[1] M. Tones, et al., "A review of quality of life and psychosocial issues in scoliosis," Spine, vol. 31, pp. 3027-38, Dec 15 2006.
[2] J. R. Cobb, "Outline for the study of scoliosis," Am Acad Orthop Surg
Instruct Lect, vol. 5, pp. 261-275, 1948.
[3] M. M. Doody, et al., "Breast cancer mortality after diagnostic radiography: findings from the U.S. Scoliosis Cohort Study," Spine vol. 25, pp. 2052-63., 2000.
[4] L. G. Lenke, et al., "Adolescent idiopathic scoliosis: a new classification to determine extent of spinal arthrodesis," J Bone Joint Surg Am, vol. 83-A, pp. 1169-81, Aug 2001.
[5] L. Duong, et al., "Three-dimensional classification of spinal deformities using fuzzy clustering," Spine, vol. 31, pp. 923-930, Apr 2006. [6] I. A. F. Stokes, et al., "Classification of Scoliosis Deformity
Three-Dimensional Spinal Shape by Cluster Analysis," Spine, vol. 34, pp. 584-590, Mar 2009.
[7] H. A. King, et al., "The selection of fusion levels in thoracic idiopathic scoliosis," J Bone Joint Surg [Am], vol. 65, pp. 1302-13, 1983. [8] R. K. Pratt, et al., "Changes in surface and radiographic deformity after
Universal Spine System for right thoracic adolescent idiopathic scoliosis: is rib-hump reassertion a mechanical problem of the thoracic cage rather than an effect of relative anterior spinal overgrowth?," Spine, vol. 26, pp. 1778-87, Aug 15 2001.
[9] M. Asher, et al., "Maintenance of trunk deformity correction following posterior instrumentation and arthrodesis for idiopathic scoliosis,"
Spine, vol. 29, pp. 1782-8, Aug 15 2004.
[10] P. Poncet, et al., "Reconstruction of laser-scanned 3D torso topography and stereoradiographical spine and rib-cage geometry in scoliosis,"
Comput Methods Biomech Biomed Engin, vol. 4, pp. 59-75, 2000.
[11] A. R. Turner-Smith, et al., "A method for analysis of back shape in scoliosis," J Biomech, vol. 21, pp. 497-509, 1988.
[12] C. J. Goldberg, et al., "Surface topography, Cobb angles, and cosmetic change in scoliosis," Spine, vol. 26, pp. E55-63, Feb 15 2001.
[13] W. Frobin and E. Hierholzer, "Analysis of human back shape using surface curvatures," J Biomech, vol. 15, pp. 379-90, 1982.
[14] E. G. Dawson, et al., "Optoelectronic evaluation of trunk deformity in scoliosis," Spine, vol. 18, pp. 326-31, Mar 1 1993.
[15] V. Pazos, et al., "Accuracy assessment of human trunk surface 3D reconstructions from an optical digitising system," Med Biol Eng
Comput, vol. 43, pp. 11-5, Jan 2005.
[16] J. L. Jaremko, "Estimation of scoliosis severity from the torso surface by neural networks," Ph.D., University of Calgary (Canada), Canada, 2003. [17] P. O. Ajemba, et al., "Characterizing Torso Shape Deformity in Scoliosis Using Structured Splines Models," Ieee Transactions on
Biomedical Engineering, vol. 56, pp. 1652-1662, Jun 2009.
[18] X. Liu, et al., "Functional classification of patients with idiopathic scoliosis assessed by the Quantec system: a discriminant functional analysis to determine patient curve magnitude," Spine, vol. 26, 2001. [19] L. Ramirez, et al., "A support vector machines classifier to assess the
severity of idiopathic scoliosis from surface topography," IEEE Trans
Inf Technol Biomed, vol. 10, pp. 84-91, 2006.
[20] P. Patias, et al., "A review of the trunk surface metrics used as Scoliosis and other deformities evaluation indices," Scoliosis., vol. 5, p. 12., Jun 29 2010.
[21] V. Pazos, et al., "Reliability of trunk shape measurements based on 3-D surface reconstructions," Eur Spine J, vol. 16, pp. 1882-91, Nov 2007. [22] J. L. Jaremko, et al., "Indices of torso asymmetry related to spinal
deformity in scoliosis," Clin Biomech (Bristol, Avon), vol. 17, pp. 559-68, Oct 2002.
[23] L. Seoud, et al., "Multilevel analysis of trunk surface measurements for non-invasive assessment of scoliosis deformities," Spine, vol. 37, pp. E1045-E1053, August 2012.
[24] J. O. Ramsay and B. W. Silverman, Functional data analysis. New-York: Springer, 2002.
[25] J. J. Song, et al., "Clustering of time-course gene expression data using functional data analysis," Computational Biology and Chemistry, vol. 31, pp. 265-274, Aug 2007.
[26] C. Park, et al., "Classification of gene functions using support vector machine for time-course gene expression data," Computational
Statistics & Data Analysis, vol. 52, pp. 2578-2587, Jan 2008.
[27] A. Duhamel, et al., "Functional data analysis for gait curves study in Parkinson's disease," in Ubiquity: Technologies for Better Health in
Aging Societies. vol. 124, A. Hasman, et al., Eds., ed, 2006, pp.
569-574.
[28] J. Roislien, et al., "Simultaneous estimation of effects of gender, age and walking speed on kinematic gait data," Gait & Posture, vol. 30, pp. 441-445, Nov 2009.
[29] O. A. Donoghue, et al., "Functional data analysis of running kinematics in chronic Achilles tendon injury," Medicine and Science in Sports and
Exercise, vol. 40, pp. 1323-1335, Jul 2008.
[30] A. Fitzgibbon, et al., "Direct least square fitting of ellipses," IEEE
Transactions on Pattern Analysis and Machine Intelligence, vol. 21,
pp. 476-480, May 1999.
[31] J. O. Ramsay and C. J. Dalzell, "Some tools for functional data-analysis," Journal of the Royal Statistical Society Series
B-Methodological, vol. 53, pp. 539-572, 1991.
[32] D. B. Hitchcock, et al., "The effect of pre-smoothing functional data on cluster analysis," Journal of Statistical Computation and Simulation, vol. 77, pp. 1089-1101, Nov-Dec 2007.
[33] T. Tarpey and K. K. J. Kinateder, "Clustering functional data," Journal
of Classification, vol. 20, pp. 93-114, 2003.
[34] P. Roussouly, et al., "Classification of the normal variation in the sagittal alignment of the human lumbar spine and pelvis in the standing position," Spine, vol. 30, pp. 346-353, Feb 2005.
[35] L. Ferreira and D. B. Hitchcock, "A Comparison of Hierarchical Methods for Clustering Functional Data," Communications in
Statistics-Simulation and Computation, vol. 38, pp. 1925-1949, 2009.
[36] J. H. J. Ward, "Hierarchical grouping to optimize an objective function,"
Journal of the American Statistical Association, vol. 58, pp. 236-244,
1963.
[37] Y. Zhao and G. Karypis, "Data clustering in life sciences," Molecular
Biotechnology, vol. 31, pp. 55-80, Sep 2005.
[38] M. Halkidi, et al., "On clustering validation techniques," Journal of
Intelligent Information Systems, vol. 17, pp. 107-145, 2001.
[39] S. Sharma and A. Kumar, "Cluster Analysis and Factor Analysis," in
The Handbook of Marketing Research, R. Grover and M. Vriens, Eds.,
ed: Sage Publications, Inc., 2006, pp. 365-393.
[40] S. Loncaric, "A survey of shape analysis techniques," Pattern