HAL Id: hal-02873578
https://hal.archives-ouvertes.fr/hal-02873578
Submitted on 18 Jun 2020
HAL is a multi-disciplinary open access archive for the deposit and dissemination of sci-entific research documents, whether they are pub-lished or not. The documents may come from teaching and research institutions in France or abroad, or from public or private research centers.
L’archive ouverte pluridisciplinaire HAL, est destinée au dépôt et à la diffusion de documents scientifiques de niveau recherche, publiés ou non, émanant des établissements d’enseignement et de recherche français ou étrangers, des laboratoires publics ou privés.
Influence of a 3D realistic crack path in the driving
forces for fatigue crack growth under mode I+II loading
Vincent Maurel, Vincent Chiaruttini, Manon Abecassis, Alain Köster,
Sébastien Dezecot
To cite this version:
Vincent Maurel, Vincent Chiaruttini, Manon Abecassis, Alain Köster, Sébastien Dezecot. In-fluence of a 3D realistic crack path in the driving forces for fatigue crack growth under mode I+II loading. Theoretical and Applied Fracture Mechanics, Elsevier, 2020, 108, pp.102570. �10.1016/j.tafmec.2020.102570�. �hal-02873578�
Influence of a 3D realistic crack path in the driving forces for
fatigue crack growth under mode I+II loading
Vincent Maurela,∗, Vincent Chiaruttinib, Manon Abecassisa, Alain Kostera, Sebastien Dezecota
aMINES ParisTech, PSL University, MAT - Centre des Materiaux, CNRS UMR 7633, BP87, 91003 Evry,
France
bONERA, Universit´e Paris-Saclay, 29 av Division Leclerc, 92320 Chatillon, France
Abstract
The aim of this paper is to test the influence of different crack path models, from oversim-plification currently used in literature of a straight crack front orthogonal to the specimen sides to a realistic 3D crack path. On the basis of experimental features observed for Ti17 and Ti6242 alloys under multiaxial loading, a sensitivity analysis is proposed to address the impact of realistic 3D crack path on SIF and FCGR assessment.
Keywords: Fatigue crack growth, titanium based alloys, integral J, mode mixity
Contents
1 Introduction 2
2 Experimental observations 2
2.1 Specimens and experimental methodology . . . 3 2.2 Crack morphology . . . 5 2.3 Fatigue crack growth rate analysis . . . 7 3 Sensitivity analysis using a 3D planar crack 8 3.1 Reference case: symmetric crack . . . 12 3.2 Twist and retardation influence . . . 12 3.3 Crack front curvature influence . . . 14
4 Realistic crack path 16
4.1 3D meshing of the crack path . . . 16 4.2 Influence of the 3D crack front oscillation on the computed SIF values . . . . 17
5 Discussion 20
∗Corresponding author
Email address: vincent.maurel@mines-paristech.fr (Vincent Maurel)
1. Introduction
Fatigue crack growth under multiaxial loading is a key issue for most of the industrial components. Many authors have put the effort on fatigue crack growth rate (FCGR) models accounting for multiaxiality within the scope of linear elastic fracture mechanics (LEFM), among which the pioneer works of Tanaka [1] should be analyzed: he proposed a robust criterion - the so-called equivalent SIF, including mode I, II and III, but mainly based on 2D mechanical assumptions. This criterion is straightforward for many practical applications but fails when the 3D crack morphology is locally more complex than perpendicular to the side of the analyzed structure. This effect could be observed for flat to slant transition [2] or could coincide with cases including complex interactions of crack path with microstructure. Recent studies for titanium alloys have shown that, for coarse microstructure heterogeneity, as compared to the crack length the crack becomes complex in shape [3]. Besides FCGR could reach maximum and minimum values during the crack growth, making the behavior hardly assessed by a Paris-like law. These cases could be related to microstructurally short crack [4] already observed for Ti-5AI-2.5Sn and Ti6242 in [5, 6].
These observations question the impact of the morphology of the crack on SIF values. Hourlier et al. have observed the complexity of the crack path and stressed out the large contribution of mode III in FCGR [5]. One question could be also derived from these results: do the SIF values and the shear modes justify the FCGR oscillations observed experimentally if they are combined to an equivalent SIF and using a Paris law?
Recent progress in image analysis and in situ observation of crack by tomography and derived FEA models enable respectively to obtain an accurate description of the 3D mor-phology of the real crack and to model actual crack path [7, 8, 9, 10, 11]. Besides, XFEM or conform remeshing techniques can be used to assess SIF values from these models close to real 3D crack path [12, 13, 14, 15]. Conform remeshing technique associated with G-θ method is a powerful tool for LEFM by using the optimized mesh in the crack vicinity to insure path independence for G-Integral evaluation [16, 17]. Because users of such FEA model need guidelines for crack growth analysis accounting to these new possibilities, FCGR criterion should be revised accordingly to more accurate models [18, 3].
The aim of this paper is to test the influence of different crack path models, from over-simplification currently used in the literature of a straight crack front orthogonal to the specimen sides to a realistic 3D crack path. The main experimental results from previous studies are recalled [3] to precise crack path and FCGR main features observed for Ti17 and Ti6242 alloys under multiaxial loading before addressing the analysis of the impact of realistic 3D crack path on SIF and FCGR assessment.
2. Experimental observations
The experimental results and methodologies correspond to a previous paper that should be read to access full details, see [3]. Only major points are detailed below.
Table 1: Chemical composition (wt. %) of Ti17 and Ti6242 alloys used in the present study [3]
Element Al Sn Zr Mo Cr O Si Ti Ti17 4.54 2.10 2.06 3.91 3.93 <0.13 0.06 Bal. Ti6242 5.72 2.09 3.95 1.86 0.01 <0.15 0.1 Bal.
2.1. Specimens and experimental methodology
The studied materials are Ti17 and Ti6242 titanium alloys. Their respective chemical compositions correspond to Table 1. A full analysis of the microstructures of both alloys have been achieved in [3].
The chosen specimens are cross-shaped, their geometry is detailed in figure 1(a) and (b). One should notice that the gage length corresponds to the central part of the specimen which thickness is reduced down to 1 mm by standard machining. Besides, a notch has been processed in this area sequentially by electro-discharge machining for the hole and the notch, which total length is of about 1.6 mm and the notch radius of about 100 µm. The orientation of the notch corresponds to the bissector between axes #1 and 2, i.e. forming an angle of 45o with axes #1 and 2.
To analyze biaxial loading, the biaxiality ratio referred as to symbol T in the sequel, is defined as the ratio of maximum loading applied along two orthogonal directions:
T = F2,max F1,max
(1)
To analyze the influence of fatigue tension combined to macroscopic shear on FCGR, varia-tion of the biaxiality ratio has been applied sequentially, Figure 1(c) and (d). The different loading sequences, where biaxiality ratio was varied by the modification of maximum applied forces on each direction, are detailed in the table 2. The increment of crack for each sequence is specified by the average crack increment ∆a. The tests Ti17/C1 and Ti6242/C1 were de-signed to have a relatively large crack increment under equibiaxial to compare with reference data under mode I, whereas the test Ti6242/C2 was designed to have mainly T=0.7.
The crack evolution was tracked in situ using a Keyence VHX700 numerical optical microscope with a Z100 lens. The associated spatial resolution is of about few micrometers. During the test, the measurement was only achieved on one side of the specimen except for one test described in the sequel as Ti6242/C2. In this latter case, a second camera of the same model was used for in situ monitoring of the other side of the specimen, yielding synchronous measurement of crack growth on both sides of the specimen. At the end of the test, the surface crack path was measured before mechanical opening of the specimen. Then a fractography analysis was carried out in two ways: firstly a SEM analysis of the path to reveal local interactions between crack and microstructure heterogeneities and secondly high resolution roughness measurement using optical profilometer.
4
Figure 1: (a) Sketch of the specimen (b) cross-section of the gage length (c) load evolution along axis #1 and (d) load evolution along axis #2 [3]
Table 2: Loading details for each configuration
Specimen Material Sequence F1,max (kN) F2,max (kN) T ∆a (µm)
Ti17/C1 Ti17 1 5.0 5.0 1. 870. 2 5.0 4.5 0.9 355. 3 5.0 4. 0.8 870. 4 5.0 0.35 0.7 595. Ti6242/C1 Ti6242 1 5.0 5.0 1. 1325. 2 5.0 4.5 0.9 370. 3 5.0 4. 0.8 355. 4 5.0 0.35 0.7 1475. Ti6242/C2 Ti6242 1 5.0 5.0 1. 340. 2 5.0 0.425 0.85 80. 3 5.0 0.35 0.7 3400. 2.2. Crack morphology
For the Ti17 alloy, the crack path is very smooth and follows the MTS criterion for each different sequence, Figure 2(a) (readers can also access to a detailed analysis of these features in [3]). For the Ti6242, the local orientation of the colonies of α phase contributes to strong amplitude of angular deviation of the crack associated to a relatively short crack growth and a final crack path that finally doesn’t meet the MTS criterion, Figure 2(b). Fractography analyses confirm that in the volume of the specimen the surface crack is smoother for Ti17 than for Ti6242 where a large number of local deviations are observed both by fractogra-phy and local roughness variations, see SEM observations in ’ZY’ plane and associated 3D roughness measurement colored map, figures 2(c) and (d) for Ti17 and Ti6242 respectively. The crack paths observed on both sides of each specimen do not coincide perfectly to each other, Figure 3(a). This highlights several aspects of the crack growth: if one considers a location of the crack tip along the crack path on one side, at the same abscissa (or at the same curvilinear abscissa), the observed difference in height (ordinate) on the other side is the result of the twisting of the crack. Besides, considering the final crack tip location, the difference from side to side corresponds to retardation (or advance respectively on the other side) of the crack. These points have been confirmed by the observation of the crack roughness measurement, Figure 2(c).
For each location of the crack tip, the flat to slant transition can be estimated plotting the twist angle defined as the angle between each side for a given abscissa (or at the same curvilinear abscissa), see definition of angle ψ in figure 3(b) and evolution for twist angle for Ti17 and Ti6242 respectively figure 3 (c) and (d). This 3D geometry of the crack yields a question about the realism of the model of the crack to estimate the SIF for any location of the crack tip (in the plane of the specimen side) and for any location along the crack front (in the thickness of the specimen). It is worth noting that for Ti17 local twisting is less pronounced than local twisting observed for Ti6242, see Figures 2(c) and (d) accordingly to
6 Z D (mm) 1"mm"
(a)
(b)
(c)
(d)
Y X Y X Z D (mm) T T Crack 2 Crack 2 Crack 1 Crack 1 µm D DFigure 2: Surface observed during propagation (a) Ti17/C1 and (b) Ti6242/C1, the colored arrows indicate the biaxiality ratio changes along the crack path [3]. Fractography analysis with SEM and associated surface crack roughness for crack 2 (c) Ti17/C1 and (d) Ti6242/C1 in ZD planes, X and Y correspond respectively to loading axis #1 and 2 and D to notch direction.
height profiles and 3 (c) and (d) for the twist angle evolution with the crack length.
Crack #1
Crack #2
B
ia
x
ia
lit
y
r
a
tio
, T
0
1
T
w
is
t
a
n
g
le
,
Ψ
(
°)
−60 −40 −20 0 20 40 60Position (mm)
0 1 2 3 41
2
3
3
1
2
φ
ψ
S ide B S ide A(a)
(b)
(c)
(d)
Side A Side BAxis #2 (mm)
A
xi
s #1 (m
m
)
T
Ψ!
Crack #1
Crack #2
B
ia
x
ia
lit
y
r
a
tio
, T
0
1
T
w
is
t
a
n
g
le
,
Ψ
(
°)
−60 −40 −20 0 20 40 60Position (mm)
0 1 2 3 4T
Ψ!
Figure 3: (a) Final crack paths for both sides of the specimen for Ti17/C1; (b) definition of the twist angle analysis; evolution of the biaxiality ratio T in black along the crack tip position and the associated twist angle in red for (c) Ti17/C1 where maximum local angle variation is less than 10o and (d) for Ti6242/C1
where local twist angle variations have been added in blue [3]
2.3. Fatigue crack growth rate analysis
To determine FCGR in the scope of LEFM, the energy release rate can be assessed locally by J-integral based on a representative linear elastic finite element model. SIF for each of the
three main modes can be numerically derived from path independent integral evaluations using the G-θ method associated to interaction integral approach and the Irwin’s formula [19, 20]. The model described in this section was established using the reference case fully detailed in section 3.1.
To take into consideration the modal mixity and its influence on FCGR, an original equivalent SIF was proposed in [3] as ∆Keq:
∆Keq= (∆KI2+ 8∆K 2 II+ 8∆K 2 III) 1/2 (2)
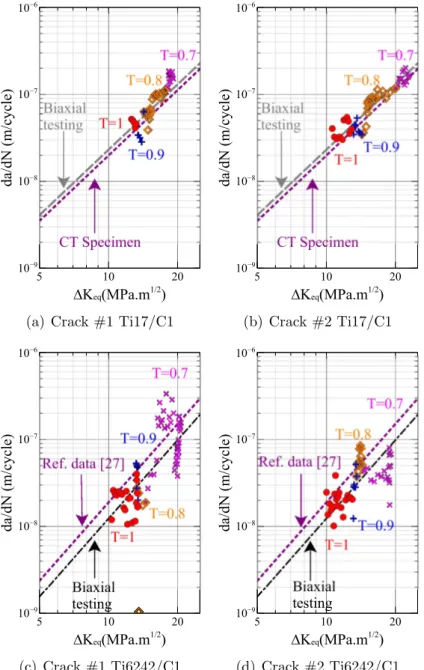
Using such a ∆Keqparameter, a Paris law could be correctly fitted for mode I (derived from
the CT specimen experiments) and also for any biaxiality ratio (derived from cross-shaped specimen experiment) for Ti17 alloy, figures 4(a) and 4(b). The same ∆Keq criterion was
applied for Ti6242 alloy, figures 4(c) and 4(d). But in this case, for biaxial loading, large variations of FCGR were observed as compared to the mode I reference case with both acceleration and deceleration of the crack. To get more into details we achieved a test with synchronous measurement of crack growth on both sides of the specimen for Ti6242 alloy. This test was mainly associated to a biaxiality ratio T=0.7 as described above, see Table 2 Ti6242/C2. The associated FCGR is shown with colored markers on one side, and black markers on the other side (respectively sides A and B), see Figure 5. When FCGR reaches a minimum value on one side (e.g. side A, Position 1), the FCGR at the same location on the other side reaches a local maximum value.
These observations yield the question of the role of the local severe deviation of the crack path observed on each side of the specimen. Besides, the complex 3D crack path and the presence of many large oscillations in fractography height amplitude confirms that the chosen straight front used for Ti17 could oversimplify the actual 3D crack path for an accurate analysis of the test.
3. Sensitivity analysis using a 3D planar crack
To determine the impact of the 3D geometry of the crack path on SIF evaluation, we will test different geometries of this crack path. The analysis will only focus on one crack tip location corresponding to a macroscopic combination of mode I and II where the biaxiality ratio is T = 0.7. In the numerical model, the prescribed boundary conditions correspond to force control and homogeneous displacement: a multi-point constrained algorithm is used, in the loading direction of the extremity of each arm of the cross-shaped specimen, namely along with directions 1 and 2. A single point is used on each of the four arms to avoid displacement in the direction 3, Figure 6(a). Linear tetrahedron elements are used for the whole set of models used in this study. Isotropic elasticity is assumed to model the mechanical behavior of both alloys accordingly to Young modulus of 112 and 114 GPa for Ti17 and Ti6242 respectively [21]. This section will focus only on the Ti17 test. All numerical analyses have been performed using the FEA code Zset developed in collaboration with Mines ParisTech and ONERA [22, 23].
9
(a) Crack #1 Ti17/C1 (b) Crack #2 Ti17/C1
(c) Crack #1 Ti6242/C1 (d) Crack #2 Ti6242/C1
Figure 4: FCGR evolution function of proposed equivalent SIF, ∆Keq eq. 2, for each crack front and each
tested specimen. Dotted lines correspond to the Paris law identified with a CT specimen for Ti17 (resp. from literature data for Ti6242), dashed line (resp. dashed dot line) corresponds to Paris law identified with the biaxial specimen for Ti17 (resp. for Ti6242) using criterion eq. 2 from [3]
10
Pos. 1 Pos. 2
Figure 5: FCGR evolution function of proposed equivalent SIF, ∆Keq eq. 2, for specimen Ti6242/C2 using
one camera for each side of the same crack (side A in color and side B in black markers respectively).
Figure 6: (a) mesh used for the specimen (b) crack surface mesh (case #2) (c) in red and blue, set of elements adjacent to the crack path observed in situ for Ti17/C1 [3]
11
Figure 7: (a) Case #1 Reference case: symmetric crack, (b) Case #2: crack twist and (c) Case #3: crack twist and retardation
3.1. Reference case: symmetric crack
The 3D crack path has been modeled, as a first approach, using a polynomial fit of the crack path observed in situ on one side of the specimen, Figure 6(c). Assuming that crack path was the same on each side and the crack front being straight, the 3D crack path corresponds to the extrusion of the crack trace on one side of the specimen through the specimen thickness, Figure 7(a).
The SIF evaluation has been achieved for T = 0.7, with max(F1) = 5 kN and max(F2)
= 3.5 kN. This yields a maximum KI at the middle of the specimen and a large decrease
at the specimen surface, from KI ' 18.4 to 16.5 MPa.m1/2 respectively, Figure 8(a) blue
curve. Associated to T = 0.7, it has been observed that KII ' 0.6 MPa.m1/2 with a slight
variation along the whole crack front, Figure 8(b) blue curve, and KIII values are close to
zero, Figure 8(c) blue curve. Finally, the equivalent SIF, according to the criterion in eq. 2, is very similar to mode I SIF value, Figure 8(d) blue curve.
The large scatter in SIF observed along the crack front questions the statistical impact of the complexity of the crack front morphology on subsequent SIF values. This is the reason why, in addition to the curvilinear representation of each of the SIF mode values, we evaluate along the crack front the probability density function (pdf) of SIF. This has been achieved for mode I, where the symmetry of the distribution reflects the front and loading symmetry, Figure 8(d) blue curve. For both mode II and III, the associated singularities of the SIF distributions are consistent with the small variations described above, Figure 8(e) and (f) blue curve. Finally, the pdf associated with ∆Keq is very similar to the pdf associated with
mode I as expected, associated Paris parameters are presented in table 3.
Table 3: Paris law parameters for Ti17 and Ti6242
Material Paris parameters Reference Loading Specimen
m C
Ti17 2.5 6.33−11 [3] pure mode I CT Ti17 2.5 7.34−11 [3] multiaxial cross-shape Ti6242 3. 1.90−11 [24] pure mode I SENT Ti6242 3. 1.24−11 [3] multiaxial cross-shape
3.2. Twist and retardation influence
As observed experimentally, the flat to slant evolution of the crack path could be assessed by measurement of the global twist angle, see Figure 3(b). The associated 3D crack path has been modeled using the same polynomial fit of the crack path observed in situ on one side of the specimen, Figure 6(c), and using a polynomial fit of the measured crack path observed on the opposite side. This corresponds to case #2 in Figure 7. Besides, to take into consideration the retardation influence observed from one side to the other one, a priori offset between each crack length has been set to 200 µm using the same polynomial fit of measured crack paths on each side of the specimen. This corresponds to case #3 in Figure 7.
13
Figure 8: Comparison of reference case to twisted crack and retardation effect on SIF analysis; (a) to (d): SIF evolution as a function of curvilinear abscissa along the crack front for mode I, II, III and ∆Keq respectively
(∆Keq corresponding to eq. 2); (e) to (f): associated SIF probability density function (pdf rationalized by
The SIF evaluation for the ”twist” case #2 yields a KIvery close to the reference situation,
Figure 8(a) red curve, excepting the decrease on the edge that is more pronounced. For KII
a clear increase is observed together with a large variation along the crack leading to extrema values on the edges, Figure 8(b) red curve. The influence of this crack shape, produces KIII
values that are no longer close to zero and become even higher than KII, being almost
homogeneous along the crack front, Figure 8(c) red curve. Finally, the equivalent SIF, according to criterion eq. 2, is very similar to the mode I SIF but is increased in value, Figure 8(d) red curve.
The SIF evaluation for ”retardation” case #3, yields a KI significantly different from
reference and twist cases, Figure 8(a) black curve: the evolution of KI is very pronounced
along the crack front, yielding a zero value for s/s0 = 0 and a maximum value for s/s0 = 1
both corresponding to the intersection of the crack with the sides of the specimen. The evolution of KII is similar in shape and values to the ”twist” case, Figure 8(b) black curve.
The KIII values are almost homogeneous along the crack front, Figure 8(c) black curve. The
equivalent SIF, according to the criterion eq. 2, presents an equivalent shape as compared to the mode I but is increased in value, Figure 8(d) black curve.
The associated probability density functions of SIF values (pdf rationalized by its maxi-mum value) show that for mode I the average values are similar for each of the three cases, Figure 8(e). However, extreme values for both cases #2 and 3 are significantly different for either maximum, yielding a FCGR increase, or minimum, yielding a decrease of FCGR, values. For mode II and III, the pdfs for cases #2 and 3 show a large distribution and an increase as compared to the reference case, Figure 8(f) and (g). The mode III is ob-served here to be more pronounced than mode II. Finally, the pdf associated with ∆Keq is
shifted to higher average values for both cases #2 and 3, Figure 8(g). The case #3 appears to be the most critical one, due to a large increase in maximum values of ∆Keq (reaching
20.5 MPa.m1/2), whereas maximum for cases #1 and 2 are of about 18.5 and 19 MPa.m1/2
respectively.
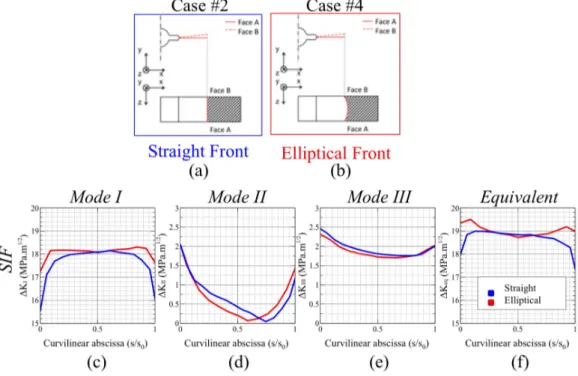
3.3. Crack front curvature influence
The above cases only consider straight crack front. To take into account the curvature of the crack front, the ”twist” crack path case #2 in Figure 9(a) and (b), has been modified using a penny shape crack leading to a crack curvature of about 26 µm that has been measured experimentally for Ti17 [25].
In this case, the only differences we observed are significant on the edge for mode I where the values are higher than the ”twist” case, Figure 9(c) red and blue curves respectively. This curvature yields very slight modifications for modes II and III, and ∆Keq is consequently
very similar to mode I, Figure 9(f), with a slight increase on the edges of the crack front. Because of this very similar evolution of SIF values, pdf is not plotted for this case.
As a partial conclusion of this work, it is worth noting that the ”retardation and twist” case, including both twisting and retardation, yields the strongest evolution on SIF values. Both local values and pdf are strongly modified in this case. Finally, the modification is evidenced when the modes II or III values increase significantly due to the 3D chosen geometry of the crack.
15
Figure 9: Comparison of twisted crack with (a) straight front to (b) penny shape crack, Cases #2 and 4 respectively, on SIF analysis; (c) to (f) : SIF evolution as a function of s/s0 (where s is the curvilinear
abscissa and s0 corresponds to maximum value of s) along the crack front for mode I, II, III and ∆Keq
4. Realistic crack path
4.1. 3D meshing of the crack path
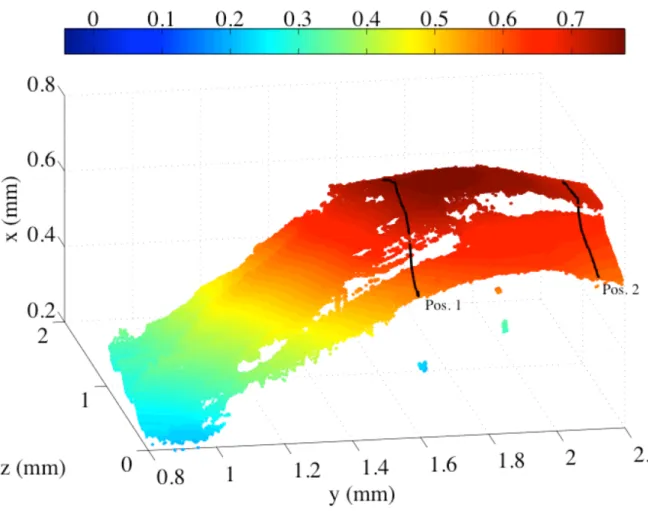
The Ti6242 microstructure drives a very complex crack path as compared to the Ti17 material for the same applied loading conditions, see Figure 2 and [3]. To get more into details about local complexity of the crack surface, the roughness profile of the crack 2 from test Ti6242/C2 has been plot in 3D in Figure 10. The color indicates the vertical position of each measured points and is detailed by the colorbar, the lines corresponds to two different locations labeled Pos. 1 and 2 respectively that will be analyzed in the sequel. This plot highlights that the crack twisting is consistent with side to side difference of z-values. In addition to what, it also evidenced that local discontinuities are present along the whole crack path (see ”transparent” areas). This local complexity of the crack surface questions the above global description of a straight crack front.
Figure 10: Roughness measurement of crack 2 test Ti6242/C2; colorbar corresponds to z-values in mm.
To further analyze such a situation, based on this 3D measurement of the crack surface, a 3D spline interpolation can be used to model this complex surface with more accuracy. In
this respect, we use the open source code Meshlab [26] to obtain a fairly good representation of the crack path. The adjacent set of elements to the crack have been superimposed to the surface crack path for this 3D spline approximation, Figure 11(a), and could be compared to a polynomial interpolation used above, Figure 11(b). If we extract one of these adjacent sets, the quality of the 3D spline interpolation becomes obvious and could reflect the high variations of height values in the bulk of the material consistently with measurement, Figure 10.
Figure 11: Surface crack superimposed to adjacent set of finite elements (in red and blue) to the crack front for Ti6242/C2 (a) using a 3D spline approximation of the actual surface obtained by profilometry and (b) in a ”simplified” version corresponding to polynomial approximation of the crack. One of the adjacent set of finite elements has been extracted for (c) 3D spline approximation and (d) polynomial approximation.
4.2. Influence of the 3D crack front oscillation on the computed SIF values
This analysis has been carried out at a chosen crack length that corresponds again to a crack tip location associated with a biaxiality ratio T = 0.7 labeled as Pos. 2 in Figure 10. The crack length is here assumed to be the same on both sides for sake of simplicity. This is the reason why we will compare this case to above ”twist” case #2 but here applied to Ti6242 ( that is to say that the front is a straight line accounting only for twisting with no retardation analysis: local twisting for 3D spline approximation and global twisting for simplified case respectively.
The associated differences in stress field is observed for instance by plotting the maximum eigen stress values, see Figure 12. It is obvious that the 3D spline approximation modifies both the size of maximum stress area (here observed on surface) and its shape.
Figure 12: Maximum eigen stress values at maximum load for (a) 3D spline approximation and (b) polyno-mial approximation.
A direct comparison of Keq for the realistic case and the ”twist” case #2 shows both
the consistency of the evolution for both cases, reflecting the average twist angle, but large oscillations of Keq are evidenced for the realistic case, Figure 13(a). Because, shear modes
II and III have been observed to drive the evolution of equivalent SIF, we choose here to represent the ratio KII/KI, KIII/KI and Keq/KI to determine the relative influence of the
complexity of the crack path, see Figure 13 for both evolution along the crack front (b) to (d) and their associated pdf values (e) to (g). This evaluation is also a key feature about the role of mode mixity for any configuration tested.
Firstly, the global evolution of any ratio KII/KI, KIII/KI or Keq/KI along the crack
front location presents important oscillations as compared to the case #2 values. This associated increase can locally exceed 10 times the value obtained for a straight front, see for instance KII/KI for s/s0 close to 0.1, but in fact mostly reveals that a straight front, by
ignoring the local variations in height, finally ignores the associated variations in SIF values, Figure 13(b). On the Keq/KI values, the increase is less pronounced, but reaches a factor of
2, Figure 13(d). Secondly, the values obtained on the edges of the crack front are similar for both realistic 3D case and simplified ”twist” case #2. This result increases the confidence in
the obtained results. The most remarkable fact is that the mode III is definitively strongly modified using the realistic 3D case, Figure 13(c), and finally the evolution of Keq/KI, Figure
13(d), reflects the same revolution as observed for mode III.
The pdf values for KII/KI are very similar in shape, but clearly shifted to higher values
for the realistic case than for the simplified case, Figure 13(e). But for the ratio KIII/KI,
the realistic case shows that the mode III could not be longer neglected as compared to mode I for both average and maximum values, Figure 13(f). The Keq/KI being again a
direct reflect of the mode III, Figure 13(g).
Figure 13: (a) SIF evolution as a function of s/s0 (where s is the curvilinear abscissa and s0 corresponds
to maximum value of s) along the crack front for Keq corresponding to eq. 2, and modal mixity analyzed
trough the ratio Ki/KI, for mode (b) II, (c) III and (d) Keq; associated Ki/KI probability density function
(pdf rationalized by its maximum value) comparing simplified to the 3D spline approximation, (e) to (g).
To conclude with this analysis, we can now address the role of assumptions made on crack shape on experimental FCGR evolution using the Ti624/C2 test where both sides have been monitored, see Table 2, Figure 5. In this plot one should keep in mind that experimental FCGR is analyzed as a function of ∆Keq averaged values along the crack front considering
a straight crack, according to the measured twist angle but with no retardation effect, that is to say for Case #2 described above.
We propose here to achieve a local analysis accordingly to the two successive locations detailed by labels Pos. 1 and 2 in figures 5 and 10. These two successive points have been highlighted using a square marker for both sides of the specimen, Figure 14(a) and (b)
respectively. Surface SIF values are plot for simplified case using a circle and for the real case using a pentagram marker respectively.
For side A, Pos. 1 yields a mininum value of FCGR. Accounting for surface values decreases the ∆Keq for both simple and spline approximations, Figure 14(a). But this
variation of SIF is not high enough to match the reference curve for mode I FCGR. For Pos.2 here corresponding to a FCGR higher thant the reference curve, again decrease in SIF values is observed for both simple and spline approximations. Whereas for side B, realistic 3D spline SIF values converge with the reference curve for Paris law in mode I. For any examined local surface values, the obtained SIFs are closer than averaged ones. However, it remains difficult to conclude here on the gain for 3D spline analysis only observed on the side B. 5 10 20 10−9 10−8 10−7 10−6 ∆ Keq (MPa.m1/2) da/dN (m/cycle) Ref. Exp. Simple Ave. Simple Surf. Spline 3D Surf. (a) Side A 5 10 20 10−9 10−8 10−7 10−6 ∆ Keq (MPa.m1/2) da/dN (m/cycle) (b) Side B
Figure 14: FCGR function of ∆Keq for Ti6242/C2 for both sides ; black crosses correspond to experimental
points evaluated on each side of the specimen and using average values of ∆Keq, the straight line corresponds
to optimized Paris law from other configuration, and colored points correspond to positions 1 and 2 detailed in the core of the text
5. Discussion
This study highlights the impact of simplified and realistic 3D crack shapes in the anal-ysis of FCGR. While elasticity, within LEFM scope, has been explored, this study is only focused on the 3D crack front morphology influence. The results are fully consistent with
the experimental facts: the highest complexity of the crack front yields the highest variation in SIF values. It is worth noting that a retardation effect combined to a twist angle yields a large increase in shear mode. Previous works from Fessler et al., indicates for planar crack that retardation has also a very important effect considering in-plane sinusoidal shape for the crack front [17]. The most realistic case, based on 3D spline interpolation, yields the largest variations in SIF values, with an almost sinusoidal shape for the crack front but here out of the average plane of crack propagation.
However, using 3D splines, the model surface crack is still not perfectly fitted to the experimental one, Figure 14(a). This could be induced by the strong assumption made using a straight plane to extract the complex front, Figures 10 and 11. This assumption was chosen because of the lack of confidence in the real crack front morphology within the specimen (no evidence of crack front was observed on fractography). Besides, this assumption ignores retardation effect observed to be very sensitive when combined to crack twisting Case #3, Figure 8. At last but not least, the complexity of the stress field coupled with the extremely high intensity of eigen stress values would induce local plasticity at the crack tip, Figure 12. This local plasticity would induce complex crack closure effect function of the crack plasticity wake and local roughness.
For all cases, it is worth noting that taking into consideration the flat to slant evolution yields values for mode III that can not be neglected in FCGR evaluation, with a strong impact of mode mixity on FCGR. This could maybe used practically to address bounding of FCGR: the FCGR could be compared between pure mode I assumption and the ∆Keq
proposed in [3] but needs to describe twist and retardation to obtain a conservative model. Finally, this works should be seen as a first step to include an advanced analysis of 3D crack path that would also include plasticity, contact and subsequent crack closure encoun-tered by the crack in complex situations induced by both multiaxial loading and complex geometry of the crack.
Acknowledgement
This work was funded by Mines ParisTech and CARNOT Mines and also by the National French Agency for Research ANR grant ANR-14-CE07-0037 Semafor program, who are acknowledged for.
References
[1] Keisuke Tanaka. Fatigue crack propagation from a crack inclined to the cyclic tensile axis. Engineering Fracture Mechanics, 6(3):493–507, 1974.
[2] J Zuidema and HS Blaauw. Slant fatigue crack growth in a1 2024 sheet material. Engineering Fracture Mechanics, 29(4):401–413, 1988.
[3] Manon Abecassis, Alain K¨oster, Vladimir A Esin, Vincent Chiaruttini, and Vincent Maurel. Crack growth behavior in dissimilar welded ti based alloys under biaxial fatigue loading. International Journal of Fatigue, 118:209–224, 2019.
[4] S. Suresh. Fatigue of materials. Cambridge University Press, 1998.
[5] F Hourlier, D McLean, and A Pineau. Fatigue crack growth behaviour of ti-5al-2· 5sn alloy under complex stress (mode i+ steady mode iii). Metals Technology, 5(1):154–158, 1978.
[6] Hamouda Ghonem. Microstructure and fatigue crack growth mechanisms in high temperature titanium alloys. International Journal of Fatigue, 32(9):1448–1460, 2010.
[7] Emilie Ferri´e, Jean-Yves Buffiere, Wolfgang Ludwig, Anthony Gravouil, and Lyndon Edwards. Fatigue crack propagation: In situ visualization using x-ray microtomography and 3d simulation using the extended finite element method. Acta Materialia, 54(4):1111–1122, 2006.
[8] J-Y Buffi`ere, P Cloetens, Wolfgang Ludwig, Eric Maire, and L Salvo. In situ x-ray tomography studies of microstructural evolution combined with 3d modeling. MRS bulletin, 33(6):611–619, 2008.
[9] T.F. Morgeneyer, L. Helfen, I. Sinclair, H. Proudhon, F. Xu, and T. Baumbach. Ductile crack initiation and propagation assessed via in situ synchrotron-radiation computed laminography. Scripta Materialia, 65(11):1010 – 1013, 2011.
[10] Sebastien Dezecot, Vincent Maurel, Jean-Yves Buffiere, Fabien Szmytka, and Alain Koster. 3d charac-terization and modeling of low cycle fatigue damage mechanisms at high temperature in a cast aluminum alloy. Acta Materialia, 123:24–34, 2017.
[11] Sebastien Dezecot, Matthieu Rambaudon, Alain Koster, Fabien Szmytka, Vincent Maurel, and Jean-Yves Buffiere. Fatigue crack growth under large scale yielding condition in a cast automotive aluminum alloy. Materials Science and Engineering: A, 743:87–97, 2019.
[12] Nicolas Mo¨es, Anthony Gravouil, and Ted Belytschko. Non-planar 3d crack growth by the extended finite element and level sets?part i: Mechanical model. International journal for numerical methods in engineering, 53(11):2549–2568, 2002.
[13] AR Maligno, S Rajaratnam, SB Leen, and EJ Williams. A three-dimensional (3d) numerical study of fatigue crack growth using remeshing techniques. Engineering Fracture Mechanics, 77(1):94–111, 2010. [14] Thanh Tung Nguyen, Julien Yvonnet, Q-Z Zhu, Michel Bornert, and Camille Chateau. A phase field method to simulate crack nucleation and propagation in strongly heterogeneous materials from direct imaging of their microstructure. Engineering Fracture Mechanics, 139:18–39, 2015.
[15] Guillermo Vigueras, Federico Sket, Cristobal Samaniego, Ling Wu, Ludovic Noels, Denny Tjahjanto, Eva Casoni, Guillaume Houzeaux, Ahmed Makradi, Jon M Molina-Aldareguia, et al. An xfem/czm im-plementation for massively parallel simulations of composites fracture. Composite Structures, 125:542– 557, 2015.
[16] S. Courtin, C. Gardin, G. Bezine, and H. Ben Hadj Hamouda. Advantages of the j-integral approach for calculating stress intensity factors when using the commercial finite element software abaqus. En-gineering Fracture Mechanics, 72(14):2174 – 2185, 2005.
[17] E Fessler, E Andrieu, V Bonnand, V Chiaruttini, and S Pierret. Relation between crack growth behaviour and crack front morphology under hold-time conditions in da inconel 718. International Journal of Fatigue, 96:17–27, 2017.
[18] S. Sajith, K.S.R.K. Murthy, and P.S. Robi. Experimental and numerical investigation of mixed mode fatigue crack growth models in aluminum 6061-t6. International Journal of Fatigue, 130:105285, 2020. [19] Destuynder P; Djaoua M; Lescure S. Quelques remarques sur la mecanique de la rupture elastique.
Journal de Mecanique Theorique et Appliquee, 2(1):113–135.
[20] Vincent Chiaruttini, Dominique Geoffroy, Vincent Riolo, and Marc Bonnet. An adaptive algorithm for cohesive zone model and arbitrary crack propagation. European Journal of Computational Mechan-ics/Revue Europ´eenne de M´ecanique Num´erique, 21(3-6):208–218, 2012.
[21] R Boyer, G Welsch, and EW Collings. Materials properties handbook: titanium alloys, 4. printing. Materials Park, Ohio: ASM International, 2007.
[22] J. Besson and R. Foerch. Large scale object-oriented finite element code design. Comp. Methods Appl. Mech. Engrg., 142:165–187, 1997.
[23] Zset software, non-linear material & structure analysis suite. http://www.zset-software.com.
[24] St´ephane Hertz-Clemens. Etude d’un composite a´eronautique `a matrice m´etallique sous chargements de fatigue: sollicitation m´ecano-thermique et propagation de fissures. PhD thesis, ´Ecole Nationale Sup´erieure des Mines de Paris, 2002.
[25] Manon Abecassis. Fissuration de mat´eriaux soud´es en condition de fatigue multiaxiale (in French). PhD thesis, Paris Sciences et Lettres, 2017.
[26] Meshlab, open source system for processing and editing 3d triangular meshes. http://www.meshlab.net.
![Table 1: Chemical composition (wt. %) of Ti17 and Ti6242 alloys used in the present study [3]](https://thumb-eu.123doks.com/thumbv2/123doknet/11571065.297542/4.892.199.693.216.284/table-chemical-composition-ti-alloys-used-present-study.webp)

![Figure 2: Surface observed during propagation (a) Ti17/C1 and (b) Ti6242/C1, the colored arrows indicate the biaxiality ratio changes along the crack path [3]](https://thumb-eu.123doks.com/thumbv2/123doknet/11571065.297542/7.892.102.811.297.862/figure-surface-observed-propagation-colored-indicate-biaxiality-changes.webp)