THE DISSOCIATIVE IONIZATION OF NITROGEN
R. LOCHT, J. SCHOPMAN, H. WANKENNE and J. MOMIGNY Institut de Chimie, Sart Tilman par B-4000 Liège 1, Belgium Abstract
Energy distributions and appearance potentials of N ions produced by low-energy electron impact on N2
have been measured. At least five dissociation limits were detected either directly in the ionization efficiency curves of N or by extrapolation of the 1/2 slope straight lines drawn through the kinetic energy versus appearance potential energy diagram. Fine structure observed at low ion energy has been interpreted by the predissociation of at least two N2 excited states one of which being the well-known C2 Σu+ state. One of the
others could be a 2Πu state pre-dissociated to the dissociation limit at 24.34 eV. Close correlation between the
results of the present work and photoelectron spectroscopic observations could be done over the electron energy range between 24.3 eV and 36 eV and assignments are discussed in detail.
1. Introduction
This paper reports on the dissociative ionization of molecular nitrogen as observed by low-energy electron impact. During the last five years a renewed interest has been devoted to this subject and particularly to the study of the mechanism of formation of N+ from N2. This problem has been examined by means of a variety
of techniques. The first section of this publication will briefly review the most impor- tant papers on the dissociative ionization of nitrogen. The simultaneous observation of a metastable peak in the mass spectrum of N2 by Newton [1] and Wankenne [2] has given rise to a number of studies of the dissociation of N2
+
. The last author examined the metastable peak under high resolution and observed a structure in both the central peak and the wings [3]. These two components of the metastable peak are due to the formation of N+ ions carrying no (or a little) and a certain amount of kinetic energy respectively. The observation of a metastable peak has been ascribed to the slow (≈ 10-6 s) predissociation of an ion [4]. In the case of N2
+
, the phenomenon described above has been interpreted by the predissociation of the N2
+
ion in its C2Σu +
state from υ' ≥ 3 levels [3]. This interpretation was confirmed by the observation of the resonant charge transfer reaction:
N2 + He + → N2 + (met.) + He, N2 + (met.) →N++N, observed by Wankenne [5].
Schopman et al. [6,7] analysed under high resolution the laboratory velocity distribution of the N+ fragments formed by the impact of a 10 keV N2+ beam on He [6] and at a residual gas pressure [7]. In both
experiments a pronounced discrete structure was observed and ascribed to the predissociation of the C2Σu+state
of N2 +
[6]. In the unimolecular dissociation experiment [7] an additional structure and a strong isotope effect were observed. No definite interpretation was found for the additional structure [7]. The radiative decay of the C2Σu+ state of N2+ through predissociation has been studied experimentally by Van de Runstraat [8] as well as
theoretically by Lorquet [9,10]. More recently, several publications were devoted to the charge transfer reaction of N2 and He
+
as well as collision induced dissociation of N2 [11,12].
The dissociative ionization of nitrogen has been studied over a wide ion energy range by means of kinetic energy analysing techniques applied to an N+ ion beam formed by low energy electron impact on N2
[13-19]. The energy distributions have been investigated at fixed angle (mostly at 90°) [11,13,14] and as a function of the angle θ formed by the electron beam and the ion beam analyzing direction [13,17-19].
The aim of this paper is to reinvestigate the dissociative ionization of N2 by means of a retarding
potential technique characterized by an improved resolution [20]. The analysis of the fragments ionization efficiency curves was made mass spectro-metrically.
2. Apparatus and experimental conditions
The apparatus is identical to that described previously [20]. Basically it consists of a conventional Nier-type ion source. The ion beam focussed on the source exit slit, passes through a retarding region defined by two grids suitably spaced in order to obtain optimum resolution. After energy analysis, the ion beam is accelerated at the entrance slit of a quadruple mass spectrometer. The ion current corresponding to the desired mass ratio m/e is collected on a 14 stages Cu-Be electron multiplier. The ion current is continuously scanned as a function of either the electron energy at fixed retarding potential or the retarding potential at fixed electron energy. Both signals are electronically differentiated, stored in a multichannel analyser and plotted on a X-Y recorder. Unless otherwise stated, the operating conditions of the present work are strictly identical to those of the previous study of the dissociative ionization of O2 [20].
The nitrogen gas is obtained by air flowing through a liquid nitrogen trap in order to obtain (i) a dried gas mixture and (ii) to avoid a too quick burn-out of the emitting filament. The total pressure in the vacuum chamber is 6 X 10⁻⁷ torr during operation. The electron trap current is stabilized at 1 µA. For the ion energy scale calibration the maximum of the peak of the first differentiated retarding curve of N2+ from N2 is taken as the
origin of the kinetic energy scale. The electron energy scale is calibrated by using the threshold energy of the first ionization energy of N2
+
(X 2Σg +
) at 15.576 eV as determined by optical spectroscopy [21]. 3. Experimental results
3.1. Kinetic energy measurements
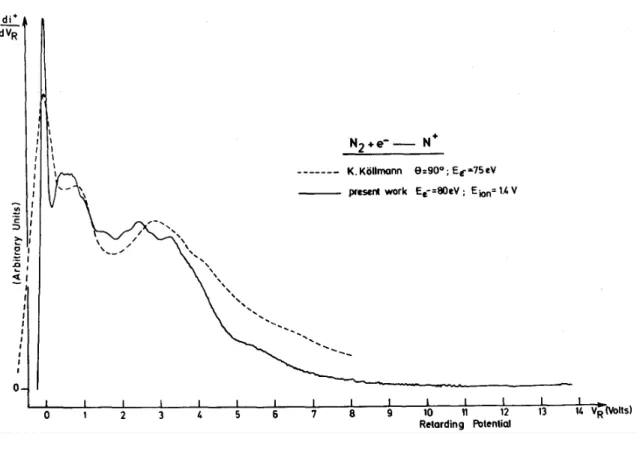
Fig. 1 shows a recording of the kinetic energy distribution of N+ formed by the impact of 80 eV electrons on N2. The position in energy of the maxima observed in this curve are listed in table 1. The quoted
error is the largest deviation from the average of ten independent measurements. In the same figure, the present result is compared with the N+ fragments kinetic energy distribution obtained by Köllmann [19] by means of a cylindrical energy analyser at 90 ° with respect to the beam of 75 eV electrons. In the ion energy range of 0-4 eV both distributions are in fairly good agreement. At higher ion energies (>5 eV) a discrepancy is observed owing to the relatively closed structure of the ion source, used in the present work, responsible for a discrimination against highly energetic ions. This has been previously observed [22].
The comparison of our results with the ion energy distributions deduced from time-of-flight experiments [16,28] is uneasy at low energy (<2 eV) [23]. At higher ion energies structures are observed in the same kinetic energy range in both the present curve and in that obtained by Smyth et al. [16]. The present ion energy distribution curve shows more details than that obtained by Kieffer and Van Brunt [14].
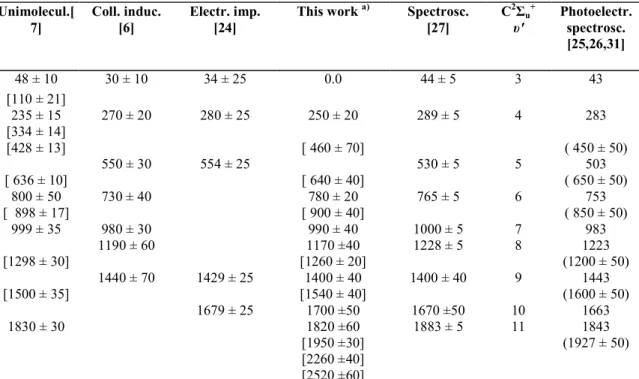
As the second peak in fig. 1 suggests the existence of fine structure, typical recordings of the kinetic energy distribution of N+, obtained for three electron energies in the ion energy range of 0 to 1.5 eV, are shown in fig. 2.
The position in energy of the submaxima have been determined from 40 independent experiments. In the fifth column of table 2 are listed the total kinetic energy values (i.e., twice the measured values) which could be directly correlated with spectroscopic data. In the same table 2 the most significant previously published results [6,7,24] are collected.
3.2. Appearance potential measurements
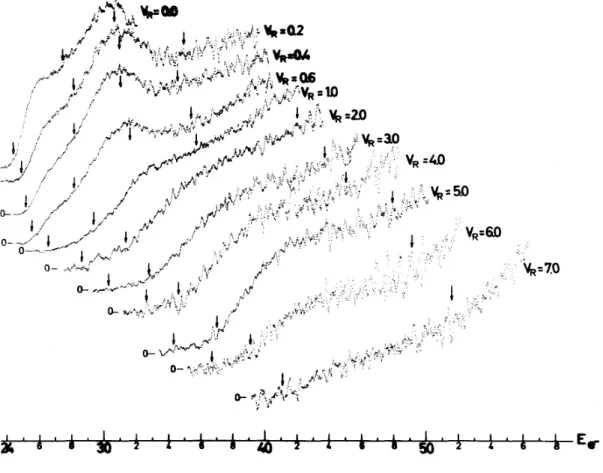
Typical first differentiated ionization efficiency curves of N+ from N2 are shown in fig. 3, at different
retarding potentials. Critical energies are indicated by an arrow. The linear extrapolation method used to determine the threshold energy has fully been described previously [20]. The ionization efficiency curve of N+ has been recorded at intervals of 0.1 eV, between 0 and 1.8 eV retarding potential. At higher values of the retarding potential threshold energy measurements were performed at intervals of 0.2 and 0.5 eV. Each ionization efficiency curve has been recorded five times. The error quoted after each threshold energy is the largest deviation from the average value.
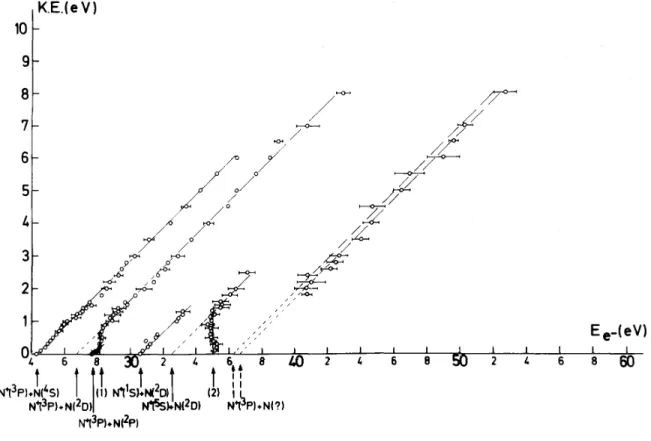
The results of this series of measurements are summarized in a plot of the threshold energy Ee- as a
function of the kinetic energy KE carried away by the fragment ion N+. This plot, shown in fig. 4, gives rise to straight lines with a slope of 0.5 resulting from a 14/28 mass ratio given by the general relation in a diatomic molecule AB,
where t (A+) is the kinetic energy carried away by the ionized fragment, m
A and mB are the masses of A and B
respectively and T is the total kinetic energy involved in the process. For convenience in the following discussion, the calculated position of the dissociation limits have been listed in table 3.
Fig. 1. Kinetic energy distribution curve of N formed by 80 eV electron impact on N2; (—) present work; (- - - )
from Köllmann, obtained at 75 eV electron energy and an angle θ = 90° between electron and ion beam.
Table 1 : Position of the maxima (eV) observed in the first differentiated retarding curve of N+ from N2. The
kinetic energy range in which fine structure is observed, is given in detail in table 2.
KE (eV) of N+ Remarks 0.75 ± 0.07 1.15 + 0.1 1.92 ± 0.05 2.29 ± 0.05 observation of fine structure in this energy range 2.57 ± 0.1 2.75 ± 0.1 3.32 ± 0.1 3.67 ± 0.05 4.03 ± 0.1 5.55 ± 0.2 8.28 ± 0.1
Fig. 2. Kinetic energy distribution curves of N+ from N2 over the ion energy range from 0 to 1.5 eV obtained at
Table 2 : Positions of the submaxima (in meV) observed in the first differentiated ion retarding curve of N+ from N2
a)
. The values quoted in column 5 and 7 are calculated from spectroscopic data [27,25,31]. Values between parentheses are deduced from the spectrum published by Åsbrink in ref. [26]. For the kinetic energy values noted between brackets, see text
Unimolecul.[ 7] Coll. induc. [6] Electr. imp. [24]
This work a) Spectrosc. [27] C2Σu + υ' Photoelectr. spectrosc. [25,26,31] 48 ± 10 30 ± 10 34 ± 25 0.0 44 ± 5 3 43 [110 ± 21] 235 ± 15 270 ± 20 280 ± 25 250 ± 20 289 ± 5 4 283 [334 ± 14] [428 ± 13] [ 460 ± 70] ( 450 ± 50) 550 ± 30 554 ± 25 530 ± 5 5 503 [ 636 ± 10] [ 640 ± 40] ( 650 ± 50) 800 ± 50 730 ± 40 780 ± 20 765 ± 5 6 753 [ 898 ± 17] [ 900 ± 40] ( 850 ± 50) 999 ± 35 980 ± 30 990 ± 40 1000 ± 5 7 983 1190 ± 60 1170 ±40 1228 ± 5 8 1223 [1298 ± 30] [1260 ± 20] (1200 ± 50) 1440 ± 70 1429 ± 25 1400 ± 40 1400 ± 40 9 1443 [1500 ± 35] [1540 ± 40] (1600 ± 50) 1679 ± 25 1700 ±50 1670 ±50 10 1663 1830 ± 30 1820 ±60 [1950 ±30] [2260 ±40] [2520 ±60] 1883 ± 5 11 1843 (1927 ± 50)
a) For convenience in the comparison with spectroscopy and photoelectron spectroscopic data, the values quoted in column 4 correspond to twice the energy measured by the position of the submaxima. The quoted error is the standard deviation a.
4. Discussion
For the sake of clarity, all experimental aspects pertaining to each observed dissociation limit will be discussed separately.
4.1. Dissociation limit at (24.34 ± 0.20) eV
A typical ionization efficiency curve as obtained for 0 eV retarding potential is shown in fig. 5. This curve has been recorded 50 times. The threshold energies measured from ionization efficiency curves obtained in these conditions are the average values. The quoted error is the standard deviation σ. Threshold energies have been measured up to 6 eV retarding potential and a straight line with the proper slope of 0.5 could be drawn and extrapolated to 24.34 eV. This is in agreement with Appell [15] and Smyth [16]. No particular feature is found in the ion energy range scanned between 0 and 6 eV kinetic energy carried away by N+.
The low kinetic energy portion of the straight line extrapolated to 24.34 eV corresponds partially to the second peak observed in the kinetic energy distribution of N+ shown in fig. 2. A detailed examination of this distribution has been performed as a function of the electron energy down to 26 eV (as it is shown in fig. 2).
As it has been pointed out in an earlier section many papers have been devoted to the formation of N+ carrying a little amount of kinetic energy, i.e., the range of 0 to 0.8 eV, through the dissociation of N2+ at the
limit of 24.34 eV. The appearance of N+ has been interpreted by the predissociation of the C2Σu +
state of N2 +
by the mostly invoked 4Πu state [9]. The most recent publications on this problem, rise a controversy over whether
or not only the C state of N2 +
is involved in the unimolecular dissociation of N2 +
. This controversy is based upon the relative lifetimes for radiative decay and predissociation of the C state [12]. Kemper et al. [12] studied the thermal energy charge transfer between He+ and N2 using ICR (ion cyclotron resonance) spectroscopy. A
lifetime of the order of 10-4 s has been found for the N2 +
state involved. This result is in total disagreement with the previously measured and calculated radiative as well as predissociation lifetimes of the order of ≤ 10-8 s for the C2Σu
+
state. This result is interpreted as being due to the predominant population of N2 +
(probably quartet states) other than the C2Σu+ state and having long lifetimes against unimolecular
decomposition. Govers et al. [11] examined the N+ and N2 +
production by the thermal energy reaction of He+ and
14
N2 or 15
N2 using optical spectroscopy. The conclusion drawn by these authors is that the C 2
Σu +
is predominantly responsible for the N+ production. This result is in direct contradiction with the ICR experiment [12], but it seems, as it will be shown below, to agree at least partially with our observations.
In table 2, the most important experimental results reported previously have been summarized.
Table 3 : The dissociation limits and dissociation products of N2 +calculated by usingD00(N2) = 9.756 eV [29],
IP(NI) = 14.54 eV. The energy levels of N and N+ species are taken from CE. Moore, Energy Levels, Vol. I., NBS Circ. 467
Dissociation mechanism Energy (eV)
N2 +→N+(3P)+N(4S0) (1) 24.296 N+(1D)+ N(4S0) (2) 26.195 N+(3P) +N(2D0) (3) 26.679 N+(3P) + N(2P0) (4) 27.870 N+(1S)+N(4S0) (5) 28.350 N+(1D)+N(2D) (6) 28.578 N+(1D)+N(2P) (7) 29.779 N+(5S)+ N(4S) (8) 30.146 N+(1S)+N(2D) (9) 30.733 N+(1S)+N(2P) (10) 31.924 N+(5S)+N(2D) (11) 32.529 N+(5S)+N(2P) (12) 33.750 N+(3P)+ N(4P) (13) 34.525 N+(3P)+ N(2P) (14) 34.973 N+(3D) + N(4S) (15) 35.731 N+(3P) +N(4S0-4P) (16) 36.229-36.650 a)
a) These limits include the 4
S0 , 2 D0 , 2 P0 , 2
D energy levels and the dissociation energy limit to N+(1
D)+ N(4
P) at 36.524 eV.
4.1.1. First of all the values without brackets in table 2 will be considered. In the present work (see column 4 and fig. 2) the occurrence of a fine structure in the kinetic energy distribution of the N+ fragment could only be interpreted by an interaction between the dissociation continuum and a discrete state of the molecule or of the molecular ion [20]. Dissociation should take place by predissociation or autoionizing predissociation. Through the present experiments, no lifetime measurements are possible. Besides collisional and electron impact experiments, photoelectron spectroscopic and optical spectroscopic measurements are available [25-27].
By the last technique Joshi [27] observed C2Σu +
-X2Σg +
transitions using a discharge in He-N2 and Ne-N2
mixtures. The total kinetic energy which should be involved in the dissociative ionization process, if the C2Σ u+
state of N2+is predissociated to the 24.34 eV dissociation limit, has been calculated from the spectroscopic data
[27] and using the dissociation limit of N2 +
(X2Σg +
) at 24.296 eV [see column (5) of table 2]. In column 6 of table 2 the vibrational levels of the C2Σu
+
state are listed in front of each value of the total ion energy calculated in this way.
Recently Åsbrink [26] and Potts [25] obtained the Hell-photoelectron spectrum of N2 +. The kinetic
energy of N+ has been calculated by the procedure just described. The very good agreement between the results obtained by optical and photoelectron spectroscopy allows to ascribe the photoelectron spectroscopic results to the C2Σu
+
state of N2 +
.
The experimental results obtained through collision induced dissociation of N2 + [6] as well as by the
study of the electron impact ionization efficiency curve of N+ from N2 [24], are found in good agreement with
the structure corresponding to the C2Σu +
state of N2 +
. Wankenne et al. [24] brought evidence of an enhancement of the signal observed at 24.575 eV, when He is added to the N2 beam. This result is interpreted by the
dissociative resonant charge exchange reaction:
In both papers the observed structures were ascribed to the predissociation of the C2Σu +
state of N2 +
.
In the present work (see column 4 of table 2) a sequence is found which is in fairly good agreement with the previous observations made by photon impact, electron impact and optical spectroscopy. Furthermore, fig. 2a shows the maximum of the second peak occurring at 390 meV kinetic energy carried away by the N+ ion, i.e., at 780 meV total ion energy implied in the dissociation process. This kinetic energy corresponds to the υ' - 6 level of the C2Σu
+
state of N2 +
characterized by the highest Franck-Condon factor, as calculated by Jain and Sahni [28]. This tends to support the unambiguous interpretation of our results as the predissociation of the C2Σu+ state
from the υ' = 3 to the υ' = 11 level. The appearance potential measurements (see fig. 4) show that the predissociation takes place through a continuum lying at 24.34 eV.
The angular dependence of the ion energy distribution has been investigated by several authors [14, 17-19]. Kieffer et al. [14] observed a small anisotropy for ions having 2.9 eV energy at an electron energy of 60 eV. As seen from fig. 4 at least three electronic states of N2+ are involved, and informations concerning the symmetry
of the final state of N2 +
which contributes to the N+ ion current at low kinetic energies are not available by this technique [17]. These results are in agreement with those obtained by Crowe [17] and Köllmann [19]. Stockdale's [23] results show distributions basically isotropic for 50 eV and 140 eV electrons.
4.1.2. Superimposed on the C2Σu+ state, other structures not yet interpreted have been found in two previous
papers [7,26] and in the present work. The position of these structures have been listed in table 2 between brackets.
Åsbrink [26] published the Hell-photoelectron spectrum of N2 between 23.9 and 26.4 eV. Besides sharp
structures ascribed to the vibrational progression of the C2Σu +
state of N2 +
, six diffuse peaks are found and ascribed to the vibrational levels of an unidentified state of N2+.
By unimolecular dissociation of N2 +
, Fournier et al. [7] found, except for the features at 110 and 334 meV, a structure which agrees fairly well with the position of the diffuse peaks found in photoelectron spectroscopy.
The N2 +
energy distributions: (i) the first between 0 and 70 meV, and (ii) the second between 400 and 1200 meV characterized by a maximum around 700 meV. Each distribution shows fine structure (see fig. 6). This preliminary result points out the occurrence of at least two slow (≈ 10-6 s) dissociation mechanisms of the metastable N2+ ions. Appearance potential measurements as well as the pressure dependence of each component
of the metastable N2+ peak are under way.
In the ion energy distribution of N+ (see table 2, column 4) the same progression has been found. Furthermore, examination of the N+ kinetic energy distribution as a function of the electron energy, shows this progression at 27 eV and higher energies (as an example see fig. 2b, at 28 eV). However it is not systematically present in the distribution obtained with 26 eV electrons. From table 2, it can be seen that this structure lies between the υ' = 4 and the υ' = 5 levels of the C2Σu
+
state of N2 +
. Two interpretations could account for this: (i) an unidentified state of N2
+
is predissociated to a higher dissociation limit, or (ii) the same state is predissociated to the same dissociation limit as the C2Σu
+
state, i.e., at 24.34 eV. In the last interpretation, the unidentified progression would be of too low intensity to be detected in the distribution measured at 26 eV electron energy.
If the predissociation takes place to a higher-lying dissociation limit, i.e., 26.2, 26.7 and 27.8 eV, the additional structures could not be found up to 2520 meV total kinetic energy in the distributions recorded with 27 and 28 eV electrons. Furthermore fig. 4 shows (i) no dissociation taking place to the limit at 26.2 eV, and (ii) dissociations to the 26.7 eV limit formed N+ ions with a minimum kinetic energy, carried away by the fragment of 0.7 eV (i.e., 1.4 eV total kinetic energy), and finally (iii) to the 27.8 eV dissociation limit, N+ ions are observed in a range restricted to the region of 0.0 eV to 0.3 eV ion energy.
These arguments allow us to ascribe the additional structure (values between brackets in table 2) to the predissociation of an N2+ excited state through a repulsive state of N2+ converging to the 24.34 eV dissociation
limit. Furthermore, within experimental error, it is possible to distinguish two sequences: (i) one of about 200 meV between 450 and 850 meV and (ii) one of higher frequency in the range of 1200 to 2500 meV.
The identification of the N2 +
state(s), the predissociation of which gives rise to the additional structure, is difficult because of lack of data concerning the N2
+
excited states. If the predissociation of the unknown state of N2+ takes place close to its potential minimum, the 2Σu- state could be invoked [10]. However according to
Dunn's selection rules [29] a 2Σu
- 1Σg +
transition is forbidden but a 2Πu - 1
Σg +
should be allowed. However no useful indication can be obtained from Gilmore's potential curve [21] for the 2∏u state which has not been drawn
for short internuclear distances. At present a certain number of theoretical calculations relative to the electronic excited states of N2+ are being performed. No results are available up to now. Therefore an assignment of the N2+
state(s) involved in the predissociation is not yet possible. Even the 4Πu state of N2+ as a predissociating state of
the C2Σu +
has been questioned.
4.1.3. A long tail extending to 6 eV kinetic energy carried away by N+ ions is found to extrapolate at the 24.34 eV dissociation limit (see fig. 4). This part of the straight line is probably generated by dissociative ionization through transitions to the repulsive wall of one or more N2+ excited states converging to the 24.34 eV
dissociation limit. One possible interpretation of this could be the transition to the repulsive wall of the stable D2∏g state. This interpretation has been proposed previously by Wankenne [5] for collision induced phenomena
and by Smyth [16]. By direct transition from the X1Σg +
state of N2, it is not possible to excite the bound
vibrational levels of the D2∏g state of N2+ which lie outside the Franck-Condon region.
However, bearing in mind Dunn's selection rules [29] the 2Πg -1
Σg +
transition would not be allowed. For the same reasons the 4Πg —
1
Σg +
[29] transition could be disregarded. Furthermore Gilmore's potential energy diagram [21] shows the occurrence of a 4Πu state and of a
4
Σg +
state of N2 +
, both converging to the 24.34 eV dissociation limit. Considering the selection rules of electronic transitions for electron impact [29] and for optical spectroscopy [30], both Πu — Σg + and Σg + — Σg +
transitions are allowed. When the 4Πu - 1
Σg +
transition is involved, it has to contribute to the anisotropy observed in the N+ ion energy distribution [17-19].
4.2. Dissociation limits at 26.7 and (27.7 ± 0.3) eV
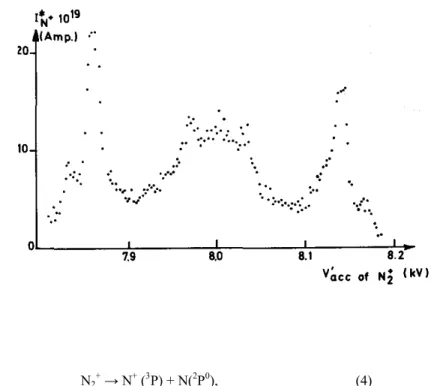
Although the limit at 26.7 eV is only obtained from extrapolation of the straight line with the proper slope of 0.5, the second dissociation limit at 27.7 eV is detected in the ionization efficiency curve of N+ (see fig. 5) recorded at 0 volt retarding potential. Both limits are in fairly good agreement with the calculated dissociation energy for process (3) and (4) of table 3:
N2 +
Fig. 4. Plot of appearance potential of N+ fragment ion (Ee-) versus the N kinetic energy. Indications and arrows
give the position in energy of the successive dissociation limits and the excited states of the fragments. For positions (1) and (2) see text.
Fig. 5. First differentiated ionization efficiency curves of N2+and N+. The shape of the N+ curves is shown for
Fig. 6. Peak associated with the metastable transition N2+ → N+ + N in region I (see ref. [5]) of the double
focussing mass spectrometer AEI MS9 for pN2 =
8.5 x 10⁻⁵ torr and Ee-=50eV.
and
N2 +
→ N+ (3P) + N(2P0), (4)
respectively. These results agree with the observations of Appell [15] though the interpretation will be different for the limit at 26.7 eV. In the present work unambiguously no dissociative ionization of N2 occurs at the 26.195
eV dissociation limit in agreement with the most recent work of Smyth [16] and Stockdale [23].
In this energy range (see fig. 4), two very closely lying phenomena are observed. First a dissociation, i.e., reaction (4), at 27.7 eV covering a narrow kinetic energy range from 0 to 0.3 eV. Secondly a vertical line, joining the straight line which extrapolates to 26.7 eV, is observed at (28.1 ± 0.1)eV [arrow labeled (1) in fig. 4]. Though it has not been noticed by the author, Appel [15] observed the same feature but tried to fit the threshold energies on a straight line with aslope of 0.5.
A first confirmation of this observation is found in the unfiltered Hell-photoelectron spectrum of N2 +
[25,31]. At 28.83 eV the maximum of a broad bell-shaped structureless band is observed extending over the 27.8 to 30 eV energy range. This band shows a shoulder on the low energy side rising from the background at 27.8 eV and having its maximum at 28.1 eV. The same band is observed in the ESCA spectrum of N2 [32]. The shape as
well as the energies at which the singular points are observed in photoelectron spectroscopy and the results of the present work strongly suggest that the same phenomena are observed in both experiments. The observation of the two continua in the Hell-photoelectron spectrum corresponds to transitions to the repulsive wall of two stable states of the molecular ion and/or to a repulsive state of the same species [33]. In the dissociative ionization at the 26.7 eV limit, the N+ ions carry away a minimum kinetic energy of (0.7 ± 0.1) eV. At 27.7 eV the electronic transition has to take place at or very close to the dissociation limit.
Above 30 eV electron energy, the straight line extrapolated to 26.7 eV extends over an ion energy range up to 8 eV.
For both the low and the high ion energy range it is not possible, in the present state of our knowledge, to ascribe our experimental data to well defined excited states of N2
+
. However Potts and Williams [25] report that the 28.8 eV band would be associated to a number of 2Σu
+
states and also to 2∏u states of N2 +
. By quantum-mechanical calculations, Okuda and Jonathan [34] assigned the 28.8 eV band to a 2Σu+ state described by [25]:
N2 +2 Σu + KK(lσg)2(lσu)2(lπu)4(2σg) 0 (lπg) 0 (2σu) l . A 2Σu + - 1Σg +
such calculations were not made. 4.3. Dissociation limit at (30.64 ± 0.2) eV
This limit is obtained by plotting the position of the maximum observed in the first differentiated ionization efficiency curve of N+, as a function of the retarding potential (see fig. 5). In the same energy range a broad peak could also be observed in the excitation function obtained with the high-Rydberg detector by Smyth et al. [16]. These authors did not study this peak as a function of the N+ time-of-flight. From fig. 3, it can be seen that the intensity of the peak observed in this work, probably due to autoionization, quickly vanishes and could not be detected at retarding potentials higher than 1 volt approximately.
Furthermore the energy obtained by extrapolation of the straight line passing through the experimental points with a slope of 0.5, is 30.64 eV in fairly good agreement with the dissociative ionization of N2 through
limit (9) in table 3.
Both in the ESCA spectrum [32] and in the filtered Hell-photoelectron spectrum [25] a structureless band is observed beginning around 30.5 eV and peaking at 32.8 eV. It is to be mentioned, however, that auto-ionization is not usually detected in photoelectron experiments. No likely interpretation can be given for this structure at the present time.
4.4. Dissociation limit at 32.5 eV
This dissociative ionization limit could not be detected in the ionization efficiency curve of N+ taken at zero volt retarding potential, as shown in fig. 5. This is probably due to the predominant closely lying autoionization phenomena. By increasing the retarding potential by only 0.1 V, the rising portion of the curve indicates a process appearing at (35.0 ± 0.2) eV [see fig. 5 and the arrow labeled (2) in fig. 4]. The threshold of this process, which seems to be due to the direct ionization, does not shift as a function of the retarding potential in the range of 0.1 to 1.2 V. For higher retarding potentials, the threshold energy values follow a straight line which extrapolates at 32.5 eV with a slope of 0.5. This observation could only be interpreted by a dissociative ionization of N2 through a transition to the repulsive part of a stable N2
+
state or to an unstable N2 +
state. At threshold the N+ ions formed carry away a minimum total kinetic energy of 2.4 eV with respect to the dissociation limit at 32.529 eV for process (11) in table 3.
As before, in this case a comparison is possible with the results of the filtered Hell-photoelectron spectrum [25] and of the ESCA spectrum [32] of N2 where a broad peak is observed, raising at 35 eV and
peaking at 36.6 eV or 37.3 eV respectively. A 2Σg +
state of N2 +
, resulting from the removal of a σg2s electron, has
been proposed for the interpretation of this peak [32]. If there is a relation between the present experimental results and those obtained by photo-electron spectroscopy, the phenomena observed in both experiments are due to an 2Σg
+
- 1Σg +
transition to the repulsive wall at 2.4 eV above its dissociation limit at 32.5 eV. This transition is allowed by Dunn's selection rules [29], and generates an isotropic angular distribution of the ion energy. Several authors [17, 19,23] agree in observing a decrease of the anisotropy of the angular distribution of N+ when the impinging electron energy is increased.
4.5. Dissociation limits between 36.2—36.6 eV
Due to the scattering in the threshold energy measurements and to the density of possible dissociation limits in the electron energy range of 36 eV (see table 3), the observed phenomena could only be defined within the energy band of 36.2 to 36.6 eV. Threshold energies are observed for N+ ions carrying up to 8 eVkinetic energy. N+ ions formed by dissociative ionization in this energy range are formed with at least (1.8 ± 0.1) eV kinetic energy. Dissociative ionization processes in this energy range have also been observed by Smyth [16] and Stockdale [23]. No interpretation could be proposed because of the lack of data about the N2
+
electronic states at such high energies.
Acknowledgement
The authors gratefully acknowledge Dr. P. Natalis for useful suggestions, and Dr. A.W. Potts for his un-filtered Hell-photoelectron spectrum of N2· The Fonds de la Recherche Fondamentale Collective is
acknowledged for financial support. One of us (J.S.) is indebted to the Patrimoine de l'Université de Liège for a grant.
References
[1] A.S. Newton and A.F. Sciamanna, J. Chem. Phys. 50 (1969) 4868; 52 (1970) 327. [2] H. Wankenne and J. Momigny, Chem. Phys. Letters 4 (1969) 132.
[3] H. Wankenne, Mém. Cl. Sc. Ac. Roy. Belg. XLI 4 (1974), and references therein.
[4] J. Momigny, Bull. Soc. Chim. Belg. 70 (1961) 291; Me'm. Soc. Roy. Sc. Liège, XIII Fasc. 1 (1966) 122. [5] H. Wankenne and J. Momigny, Intern. J. Mass Spectry. Ion Phys. 7(1971)227.
[6] P. Fournier, C.A. Van De Runstraat, T.R. Govers, J. Schopman, F.J. de Heer and J. Los, Chem. Phys. Letters 9 (1971) 426.
[7] P.G. Fournier, T.R. Govers, C.A. Van De Runstraat, J. Schopman and J. Los, Journ. Phys. 33 (1972) 755. [8] C.A. Van De Runstraat, D. Sc. Thesis, Univ. of Amsterdam (1973).
[9] J.C. Lorquet and M. Desouter, Chem. Phys. Letters 16 (1972) 136. [10] A.J. Lorquet and J.C. Lorquet, Chem. Phys. Letters 26 (1974) 138.
[11] T.R. Govers, F.C. Fehsenfeld, D.L. Albritton, P.G. Fournier and J. Fournier, Chem. Phys. Letters 26 (1974) 134.
[12] P.R. Kemper and M.T. Bowers, J. Chem. Phys. 59 (1973) 4915. [13] P.M. Hierl and J.L. Franklin, J. Chem. Phys. 47 (1967) 3154. [14] L.J. Kieffer and R.J. Van Brunt, J. Chem. Phys. 46 (1966) 2728.
[15] J. Appell, Thèse 3ème cycle Paris (1964); Adv. Mass Spectry. 3 (1966) 457. [16] K.C. Smyth, J.A. Schiavone and R.S. Freund, J. Chem. Phys. 59 (1973) 5225. [17] A. Crowe and J.W. McConkey, J. Phys. B6 (1973) 2108.
[18] J.A.D. Stockdale and L. Deleanu, Chem. Phys. Letters 22 (1973) 204. [19] K. Köllmann, D.Sc. Thesis, Hamburg (1974).
[20] R. Locht and J. Schopman, Intern. J. Mass Spectry. Ion Phys, in press. [21] F.R. Gilmore, J. Quant. Spectry. Rad. Transf. 5 (1965) 369.
[22] R. Locht and J. Momigny, Intern. J. Mass Spectry. Ion Phys. 2(1969)425. [23] J.A.D. Stockdale, private communication.
[24] H. Wankenne, E. Bolduc and P. Marmet, in: Proc. Conf. Electronic and Atomic Collisions, eds. B.C. Cobic and M.V. Kurepa, Abstr. Papers, Vol. 1 (1973) p. 433; and Can. J. Phys., to be published.
[25] A.W. Potts and T.A. Williams, J. Electr. Spectry. Rel. Phenom. 3 (1974) 3. [26] L. Åsbrink, Faraday. Disc. Chem. Soc. 54 (1972) 139.
[28] D.C. Jain and R.C. Sahni, Intern. J. Quantum Chem. 2 (1968) 325. [29] G.H. Dunn, Phys. Rev. Letters 8 (1962) 62.
[30] G. Herzberg, Spectra of diatomic molecules (Van Nostrand, Princeton, New Jersey, 1950) p. 240. [31] A.W. Potts, private communication.
[32] K. Siegbahn et al., ESC A applied to free molecules, (North-Holland, Amsterdam, 1971) p. 63. [33] J.H.D. Eland, Photoelectron spectroscopy (Butterworths, London 1974) p. 160.