ANALYSE DES CARACTÉRISTIQUES DU CANAL MIMO DANS MINE SOUTERRAINE
MÉMOIRE PRÉSENTÉ
COMME EXIGENCE PARTIELLE
DE LA MAÎTRISE EN TÉLÉCOMMUNICAITONS
PAR ALINEHME
Mise en garde
La bibliothèque du Cégep de l’Témiscamingue et de l’Université du Québec en Abitibi-Témiscamingue a obtenu l’autorisation de l’auteur de ce document afin de diffuser, dans un but non lucratif, une copie de son œuvre dans Depositum, site d’archives numériques, gratuit et accessible à tous.
L’auteur conserve néanmoins ses droits de propriété intellectuelle, dont son droit d’auteur, sur cette œuvre. Il est donc interdit de reproduire ou de publier en totalité ou en partie ce document sans l’autorisation de l’auteur.
Warning
The library of the Cégep de l’Témiscamingue and the Université du Québec en Abitibi-Témiscamingue obtained the permission of the author to use a copy of this document for non-profit purposes in order to put it in the open archives Depositum, which is free and accessible to all.
The author retains ownership of the copyright on this document. Neither the whole document, nor substantial extracts from it, may be printed or otherwise reproduced without the author's permission.
Acknowledgment
I would like to express my sin cere appreciations and gratitude to my directors Prof. N ahi Kandi! and Prof. Nadir Hakem. I had the honor to work with them, our fruitful discussions have yielded successful ideas, they are well-known in both experimental and theoretical research. There valuable knowledge, experience, comments, and suggestions have improved different aspects of my Masterthesis. Throughout my M.S, they have been a great role mode! for conducting research, writing skills, and technical presentations. Many thanks to them.
TABLE OF CONTENTS
Acknowledgment ... II TABLE OF CONTENTS ... III LIST OF FIGURES ... VII List OF ABBREV AIT A TI ONS ... IX ABSTRACT ... XI CHAPTERI ... l
INTRODUCTION ... 1
1.1 Motivation ... 1
1.2 Research Problematic ... 2
1.3 Previous Efforts to Design Antenna Configuration in Tunnel Environments .... 2
1.4 Proposed Solutions ... 4
1. 5 Research Objectives and Hypothesis ... 5
1.6 Contribution and Publication ... 5
1. 7 Structure of the The sis ... 6
1.8 Adopted Methodology ... 7
CHAPTER II ... 9
OVERVIEW OF MIMO AND DIVERSITY TECHNIQUES ... 9
2.1 Introduction ... 9
2.2 Principle Characterization ofMIMO Based Systems ... 9
2.2.1 Causes of Fading ... Il 2.2.2 Additive White Gaussian Noise (AWGN): ... 12
2.2.4 Water-Filling Method: ... 13
2.2.5 Channel State Information (CSI): ... 14
2.2.6 Ergodic Capacity ... 15
2.2.7 Angnlar Spread and Coherence Distance: ... 15
2.3 MIMO Categories: ... 17
2.3.1 Spatial diversity ... 17
2.3.2 Closed-loop spatial multiplexing ... 23
2.4 Transmitting Beamforming Analysis ... 24
CHAPTER III. ... 26
MODAL ANAL YSIS OF ELECTROMAGNETIC W AVE PROPAGATION IN UNDERGROUND MINES ... 26
3.1 Introduction ... 26
3.2 Related Works of Channel Mode ling in Waveguides ... 27
3.2.1 The Waveguide Model: ... 28
3.2.2 Geometrical Optical Model (Ray Tracing): ... 29
3.2.3 Hybrid Model: ... 30
3.3 Modal Analysis of Lossy Wavegnide Environments ... 31
3.3.1 Multi-Mode Propagation in Lossy Waveguides ... 31
3.3.2 Theoretical approach for determining the number ofmodes ... 33
CHAPTER IV ... 36
PERFORMANCE ANALYSIS OF SUIT ABLE MIMO DOWNLINK SYSTEMS IN UNDERGROUND MINE ... 36
4.1 Introduction ... 36
4.3 System Mode!: ... 38
4.4 Theoretical Results: ... 39
4.4.1 Diversity Techniques Results Discussion: ... 39
4.4.2 MIMO Antenna Alignments Results Discussion: ... 43
4. 5 Conclusion ... 46
CHAPTER V ... 47
ANALYSIS OF MIMO CHANNEL CHARACTERISTICS IN LOSSY W A VEGUIDES ... 47
5.1 Introduction ... 47
5.2 Theoretical Approach ... 47
5.2.1 MIMO Capacity ... 47
5.2.2 Performance Reduction Factors in Tunnels ... 48
5.2.3 Degenerated Channels ... 50
5.3 System Mode! and Theoretical Validation ... 52
5.3 .1 Effects of Changing Dimensions of the Tunnel Results: ... 52
5.3.2 Effects oflncreasing Antennas on Capacity and Power Results: ... 54
5.4 Estimating the Number of Modes in Underground Mine Tunnel: ... 57
5.4.1 Simulation Setup: ... 57 5.4.2 Straight Tunnel ... 58 5.4.3 H-bend Tunnel ... 58 5. 5 Results Discussion: ... 59 5.6 Conclusion: ... 60 CHAPTER VI ... 61 CONCLUSION ... 61
6.1 Contributions ... 61 6.2 Future work ... 62 APPENDIX A ... 63 NARROW BAND ASSUMPTION IN WIRELESS CHANNEL MODELING .... 63 REFERNECES ... 64
LIST OF FIGURES
FIG. 1.1 UCA AND ULA MJMO ANFENNA CONFIGURATIONS ... .4
FIG. 1.2 PROCESS FOLLOWED TO OBTAIN THE ESTIMATED FORMULA. ... 8
FIG. 2.1 A Nr x X NR x MIMO CHANNEL, HIGHLIGHTING HOWTRANSMITTED SIGNAL .... lO FIG. 2.2 AMULTIPATH PROPAGATION ENVIROMENT REPRESENTING REFLECTION ... ll FIG. 2.3 POWERAZIMUTH PROFILES COMPARISON BETWEEN CHANNEL ... 16
FIG. 2.4 SCHEME REPRESENTING THE THREE PRECODING'S MRC,SC,EGC ... 23
FIG. 3.1 DIFFERENT HYBRID MODE SHAPES ... 29
FIG. 3.2RECTANGULAR WAVEGUIDE ... 35
FIG. 4.1 CANMET SCHEME AND CANMET MINE IMAGE ... 39
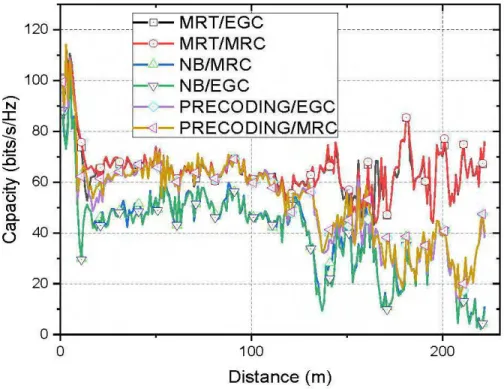
FIG. 4.2 CAPACITY FOR DIFFERENT MIMO SCHEMES VS DISTANCE ... 41
FIG. 4.3 CAPACITY FRO DIFFERET MIMO SCHEMES IN CDF FOR 900 MHz ... .41
FIG. 4.4 CAPACITY FOR DIFFERENT MIMO SCHEMES IN CDF FOR2.4AND 5.8 GHZ ... .41
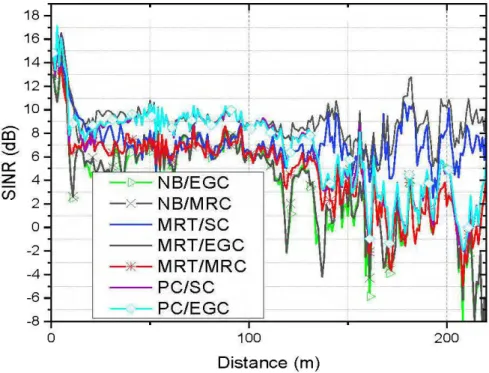
FIG. 4.5 SINR VS DIT ANCE BETWEEN DIFFERET MIMO SYSTEMS FOR 900 MHz ... 42
FIG. 4.6 POWER VS DISTANCE BETWEEN DIFFERENT MIMO SYSTEMS FOR 900 MHz ... 42
FIG. 4. 7 POWER VS DISTANCE BETWEEN DIFFERETN MIMO SYSTEMS FOR 2.4 GHz ... 43
FIG. 4.8 POWER VS DISTANCE PLOT IN THE NLOS PART FOR900MHz ... 44
FIG. 4.10 CAPA CITY OF DIFFERENTMJMOANTENNAALIGNMENTSFOR THE 900MHz ... .45
FIG. 4.11 CAPACITY OF DIFFERENT MIMO ANTENNA ALIGNMENTS FOR 2.4GHz ... 46
FIG. 5.1 ANGULAR SPREAD VS DISTANCE IN CANMET ... 49
FIG. 5.2 CANMET SCHEMA TIC ... 52
FIG. 5.3 MEAN NUMBER OF MODES IN CANMET FOR CASE lAND CASE II. ... 53
FIG. 5.4 MEAN NUMBER OF MODES IN CANMET FOR CASE lAND CASE II (2.4 GHz) ... 53
FIG. 5.5 MEAN NUMBER OF MODES IN CANMET FOR CASE lAND CASE II (5.8 GHz) .... 54
FIG. 5.6 POWER VS DISTANCE BETWEEN DIFFERENT MIMO SYSTEMS (900 MHz_ ... 55
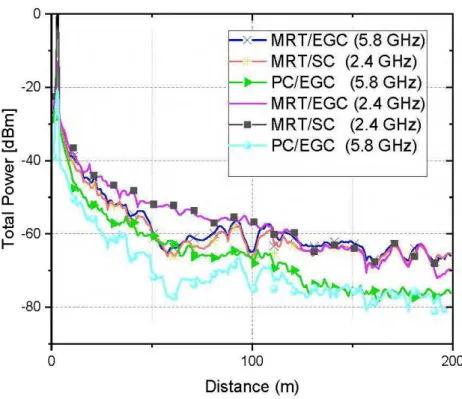
FIG. 5.7 POWER VS DISTANCE BETWEEN DIFFERENT MIMO SYSTEMS (5.8 GHz) ... 56
FIG. 5.8 CDF OF DIFFERENT MIMO SYSTEMS FOR 2.4 GHz ... 56
FIG. 5.9 CDF OF DIFFERENT MIMO SYSTEMS FOR 5.8 GHz ... 57
FIG. 5.10 CURVED TUNNEL SCHEME ... 59
AGWN AS BER BS CDF CSI dB EGC EM GO GPU LOS LTE MIMO MPE MRC MRT NLOS PDP
sc
SINR SISO SNR SNR SVD TE TEM List OF ABBREVAITATIONS Additive-Gaussian-White-Noise Angular SpreadBit Error Rate Base Station
Cumulative Density Function Channel State Information Decibels
Equal Gain Combining Electromagnetic
Geometrical Optical Mode! Graphies Processing Unit
Line of Sight
Long Term Evolution
Multiple Input Multiple Output Multi Path Envirornnent Maximum Ratio Combining Maximum Ratio Transmission
Non line of Sight Power Delay Profile
Selection Combining
Signal-to-Interference-plus-Noise Ratio Single Input Single Output
Signal to Noise Ratio Signal-to-Noise Ratio
Singular Value Decomposition Transverse Electric
TM Transverse Magnetic
TTA Through the Air
TTE Through the Earth
TTW Through the Wire
UCA Uniform Circular Antenna
UHF Ultra High Frequency
ULA Uniform Linear Antenna
VLF Very Low Frequency
ABSTRACT
Short-range wireless communications technology has been embraced by the underground mining community in the last few years as a critical part of the ir method for enhancing the security and productiveness oftheir operations. In this work, we will demonstrate how the deployment of modern wireless communication systems, primarily based on MIMO antenna array technology will be affected in unique environments like underground gold mines. This work first explores the relation between the number of modes in a lossy waveguide environment and a Multiple-Input Multiple-Output antenna array size. Besides, knowing that bearnforming for Massive MIMO is not suitable for deployment in underground mines. We demonstrated that applying beamforming in waveguide-like structures can enhance the performance and that by choosing the appropriate precoding techniques at the transmitter and receiver. Then, in order to achieve more reliability to the MIMO channel, a theoretical study obtained in mine comparing the capacity and power for different antenna configurations. Finally, we estimated the number of propagating modes in a rectangular cross-sectional mine environment and express it as a closed-form function of excitation frequency and waveguide cross-sectional dimensions and length. The presented formulas can be used to estimate the number of modes in the given shape quickly. By applying tho se previous methods before deploying the wireless communication system in mine, engineers can save time and cost. Besides, they can achieve the highest capacity within the implemented environment by building a wireless channel which is suitable for their desired frequency band.
RÉSUMÉ
La technologie de communication sans fil à courte portée a été adoptée par la communauté minière souterraine au cours des dernières années comme un élément essentiel de sa méthode visant à améliorer la sécurité et la productivité de ses activités. Dans le présent travail, nous démontrerons comment le déploiement de systèmes de communication sans fil modernes, principalement basés sur la technologie de réseau d'antennes MIMO, sera affecté dans des environnements uniques comme les mines d'or souterraines. Ce travail explore d'abord la relation entre le nombre de modes dans un environnement de guide d'ondes déficitaire et la taille d'un réseau d'antennes à débit multiple à entrées multiples. En outre, sachant que la formation de faisceaux pour massive MIMO n'est pas approprié pour le déploiement dans les mines souterraines. Nous avons démontré que l'application de la formation de faisceaux dans des structures semblables à des guides d'ondes peut améliorer les performances et qu'en choisissant les techniques de précodage appropriées à l'émetteur et au récepteur. Ensuite, pour un canal MIMO dans un environnement minier, un résultat théorique obtenu pour différentes configurations d'antennes. Enfin, nous avons estimé le nombre de modes de propagation dans un environnement rectangulaire de la mine transversale et l'exprimons comme une fonction de forme fermée de fréquence d'excitation et de dimensions et de longueur transversales du guide d'ondes. Les formules présentées peuvent être utilisées pour estimer rapidement le nombre de modes dans la forme donnée. En appliquant ces méthodes antérieures avant de déployer le système de communication sans fil dans le mien, les ingénieurs peuvent économiser du temps et des coûts. En outre, ils peuvent atteindre la capacité la plus élevée dans l'environnement mis en œuvre en créant un canal sans fil adapté à la bande de fréquence souhaitée
INTRODUCTION
1.1 Motivation
The Mining industry in Canada contributed 57.6 $billion to Canada's Gross domestic product (GDP) in 2016 with more than 3700 companies working in this field, employing more than 403,000 workers across the country [1]. These mineral resources are considered as the main blocks in our daily life, where copper and aluminum needed to carry electricity to our homes, and gold which exists in each mobile phone or computer to the lead, zinc, nickel, cadmium, or lithium which are used in batteries. Indeed, following the underground recent mining accidents, the development of a reliable communication system in underground mine has become a paramount need to ensure the safety of miners by providing communication between workers and by providing tracking to accelerate the production by maintaining an excellent safety level. Recently, multiple input multiple output (MIMO) had been embraced by the underground mining community, which has received unprecedented attention due to its reliability and capacity compared to single antenna transmission. However, MIMO can be more complicated compared to single input single output (SISO) antenna system, especially in waveguide like environments where the electromagnetic waves propagation is very complicated. Accordingly, the deployment of the MIMO system can be more productive by studying the relation between MIMO antennas and lossy waveguide environments.
1.2 Research Problematic
First systems established in mmes was the digital through the earth (TTE) communication system that was developed by Los Alamos National Laboratory , this system uses very low frequency (VLF) transmission which can penetrate through rocks and huge materials, this communication method was terminated in 1940 with the occurrence of the through the wire technology (TTW), the reason is that this method uses bulky equipment's and Jack of speed in data rate. In the late of 1950's, TTW was introduced in mines in order to increase the data rate based on VHF-FM systems. Upon this medium's leaky feeder is considered the suitable solution compared to other cab les because it considered as radiating cable the specification that other medium misses. Legacy communication systems such as leaky feeders still exist in underground mines, the deployment of such systems can be costly and they don't have the adequate data rate for modern communication requirements in such environments [2,3]. The modem era of underground mine communication systems be gan with the through the air technology (TTA) and that because ofthe need ofhigh data rate communication systems. Indeed, MIMO didn't perform as it supposed to be in free space and that's because EM spread in confined tunnels differs from free space and indoor conditions, where the propagation can be similar to the propagation in waveguide structures. However, the high dependency of such MIMO-based systems on the surrounding physical environment necessitates the characterization of the propagation channel before deployment, else we can't leverage from the MIMO reliability in the confined environments.
1.3 Previous Efforts to Design Antenna Configuration in Tunnel Environments
Before analyzing the MIMO channel in our designated environment, first, we shall examine what the previous studies have yielded concerning different antenna properties in a similar environment such as metro tunnels. Here, the main antenna properties that are taken into account in system designs and deployments for indoor are as are discussed.
Which in terms will introduce the flexibility in the practical design of the wireless communication systems. In this section, we will shed light on radiation pattern, polarization, array configuration, and spacing between the MIMO array elements. For radiation pattern, previous studies focused on coverage and interference; for example, using directive antennas can increase the coverage and reduce the interference. However, the disadvantage is that the performance of the directional antenna is highly dependent on the antenna orientation whereas optimum orientation itself is dependent on the layout of the environment and propagation scenario [4,5]. The performance of omnidirectional discone and directional patch antennas can perform better in an indoor environment, in a study done in [ 6], omnidirectional antennas gave Jess mutual inductance compared to directive antennas in a metro tunnel. Renee, we can interpret that bearnforming can't perform weil in a confined environment. Unlike conventional indoor environments where different antenna polarizations behave equally, outdoor environments such as city urban, they behave differently, and the main reason is due to the ground effect. However, in hallways environments, horizontally polarized waves attenuate more quickly than vertically polarized waves, but they both attenuate at about the same rate in the indoor environment. The main reason behind this effect is due to the Brewster angle phenomena which happen in the interaction ofhorizontally polarized waves with dielectric sidewalls. The effect of antenna polarization has been studied for SISO and MIMO systems in tunnels too. The main result of the studies for SISO is that in empty tunnels with a horizontal aspect ratio (i.e., width is larger than height), attenuation of the horizontal polarization is lower in any environment. However, this case is true for MIMO systems deployed in underground mines and for an NLOS case. For the LOS case, it's been observed that vertically polarized show lower attenuation, and thus are more desirable for a tunnel without curvatures. In spite of the dissimilarities between underground mines and tunnels, sorne of our results confirm and support results obtained in subway tunnels. Nevertheless, because underground mines are geometrically diverse, more measurement campaigns in varions mines are required to reconfirm previous findings and reveal new physical trends or principles. Ali the
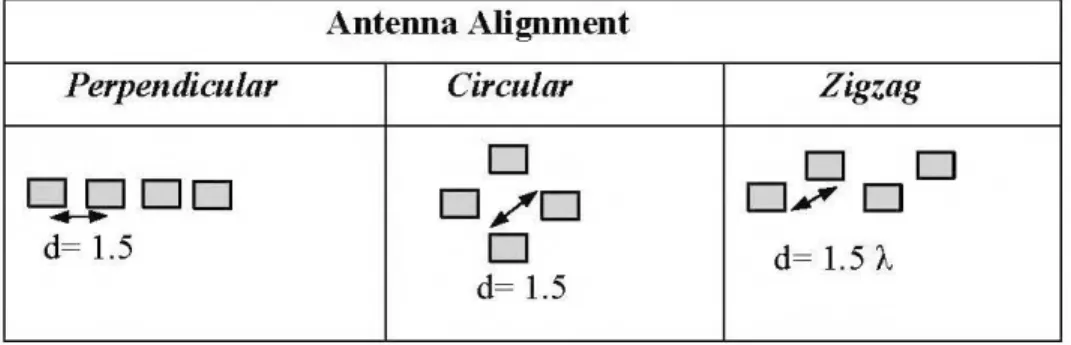
previous points we discussed can detennine the correlation between antenna elements. In addition, two essential factors that can change the correlation level is the antenna spacing and aligmnent, according to a previous study done by the University of Lille in France in a metro tunnel for a GSM frequency showed that the best antenna alignment can be orthogonal to the tmmel axis with a spacing distance between antennas varying from 2 À to 3 À to ensure decorrelation between the antennas, knowing that in indoor or
free space enviromnent the optimal antenna spacing is generally
~ However,
2
considering the differences between metro tmmel and nnderground mine, in this paper we tested the circlliar alignment with a srnaller separation distance, and that because a 3 À spacing distance in a narrow tunnel can't be sufficiently effective especially when we have UCA [6].
z+
Signal'
Z;.
'
' '
' '
1
Muliipath % i d e n t-~-J-'~
.
1 Signal 1 f ilm...: _ 5 , -c _______ r 1, 1:. _ ... -::_ 1 --- - - 2 ... - ... ---~-"' ,;::_L ___ _,y "-..
Û LJ!>m" _,/ ... 1 -4 ---~--·--' 3,x
b Fig. 1.1: UCA and ULA MIM:O antenna configurations.1.4 Proposed Solutions
In our study, in order to enhance the performance of MIMO in confined environments. We need to determine the optimal precoding rnethod that can work in a low AS environment. Secondly, we need to study the relation between MIMO antennas and
lossy overmoded waveguides like underground mines. Besides, we propose to change the antenna characteristics like spacing, alignment, number of antennas, and polarization of the MIMO antennas in order to limit the correlation between the transmitted signais. In addition, limiting the number of the MIMO array can save complexity and give optimal performance.
1.5 Research Objectives and Hypothesis
We aim to design a MIMO system that can achieve the highest capacity within the implemented environment. In addition, we seek to determine the adequate antenna array size that suits the tunnel cross-sectional area and that by determining an estimate equation that is based on frequency and tunnel dimensions. In our study, we consider that mines can act as tunnels in case of comparing them to over-sized dielectric waveguide where many modes can propagate [7], and this ifwe consider embracing the waveguide mode!, but the problem with the latter that it's not efficient in the near field region, where the geometrical optical mode! (GO) can numerically solve the problem of the near field region by predicting the paths [8]. Correspondingly, we canuse GO mode! which is more precise in undefined shapes like underground mines. In this manner, we can use the right channel modeling which facilitates the design of such systems to answer questions such as "what is the suitable antenna alignment, frequency do we need?" or "What channel impairments do we need to mitigate?
1.6 Contribution and Publication
1- Nehme, A. Kandi!, Net Hakem, N., "Estimatingthe number of modes in underground mine tunnel", 2019 IEEE International Symposium on Antennas and Propagation (APSURSI).
In this article we explore the relation between number of modes in a lossy waveguide environment and MIMO antenna array size, the aim is to make an estimation of the number of modes in underground mine tunnel. The estimating formulas can be used to determine the number of modes which can propagate in straight mine tunnels.
2- Nehme, N. Hakem, N et N, kandi!., "The Effects of Increasing Antenna Arrays for MIMO in Mine Tunnels", 2019 9th International Conference on Digital Information and Communication Technology and its Application (DICTAP2019).
The aim of this paper is to prove theoretically by using waveguide and geometrical optical models that increasing MIMO array elements at the transmitter and receiver will have a limit on capacity where the equivalent spatial subchannels can be limited by the number of allowable modes.
3- Nehme, A. Kandi!, Net Hakem, N., "Analysis ofMIMO Antenna Characteristics in Underground Mine ", 2019 International Conference on Advance of Computational tools for Engineering Applications (ACTEA2019).
"Analysis of MIMO Antenna Characteristics in Underground Mine " summarizes the previous two works, besides it helps answering question such as "what is the suitable antenna alignment and the suitable frequency" for different mine cross-sections.
1. 7 Structure of the Thesis
The rest of the thesis is structured as follows:
Chapter II provides sorne background material about MIMO and introduces important concepts such as the diversity schemes that will be used in chapter IV.
Chapter III, sheds the light on understanding wireless propagation in the mine tunnel. In addition, it presents sorne mathematical derivations to exp lain the relation between MIMO channel and lossy overmoded waveguides and it explains the differences between different channel modelling.
In Chapter IV we will use different beamforming techniques such as MRT and ZF to compare their performance in the underground mine. In addition, a comparison between antenna alignments will be studied for severa! frequencies.
In Chapter V, we will prove mathematically and theoretically that limiting the number of MIMO antennas in narrow mines can achieve the same performance as higher antenna MIMO arrays. In addition, we will estimate the number of modes in severa! tunnel shapes.
Finally, Chapter VI concludes the thesis by reaffirming our contributions and further studies.
1.8 Adopted Methodology
For the first step, in order to characterize the MIMO channel in a specifie environment, we need to study the MIM 0 systems which in terms require the propagation channel to be correctly characterized or modelled. This characterization is important as it provides a better understanding of propagation phenomena, such as refection, diffusion and refraction, in any given environment. It's known that for our designated environment that it acts as waveguide when dealing with VHF. Renee determining the number of propagating channels can help in building our estimating formulas and that by conducting massive simulations for varions mine environments and different channel
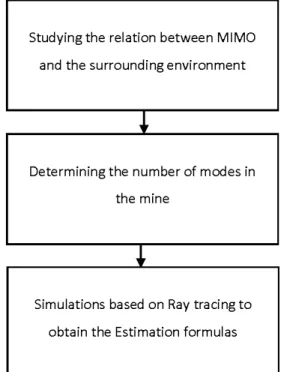
parameters. The chart below shows the approach followed to achieve our proposed solutions.
Studying the relation between MIMO
and the surrounding environ ment
+
Determining the number of modes in the mine
+
Simulations based on Ray tracing to obtain the Estimation formulas
CHAPTERII
OVERVIEW OF MIMO AND DIVERSITY TECHNIQUES
2.1 Introduction
Sorne challenges in wireless propagation are the fading of the signal due to many physical behaviors of waves. As a result, we have multiple single components at the receiver, this multipath propagation environment (MPE) leads to a superposition of multiple signals, which leads to interference that can be destructive or constructive. The challenge faced by future wireless communication systems is to achieve high data rate combined with high-quality service. Knowing that spectrum is a scarce resource, and due to MPE, this requirement calls from means to radically increase spectral efficiency. Indeed, MIMO can overcome these problems without scarifying additional bandwidth or power. In this chapter, we will brie fly shed light on MIM 0 systems in order to facilitate the idea for the next chapters. Also, we will introduce sorne MIMO techniques that permit a deviee that uses a couple of antennas at the transmitter or receiver to take advantage of spatial diversity in order to enlarge the reliability and the throughput of a channel.
2.2 Principle Characterization ofMIMO Based Systems
In order to characterize MIMO systems, we must recall two key pararneters represented by the angular spread and capacity. Multiple transmission paths in any environment could increase the capacity if we considered treating each path as an independent channel. In tunnels, which is familiarized by its small angular spread, the using of beamforming can be quite different, and that is due to the inability of the receiver to
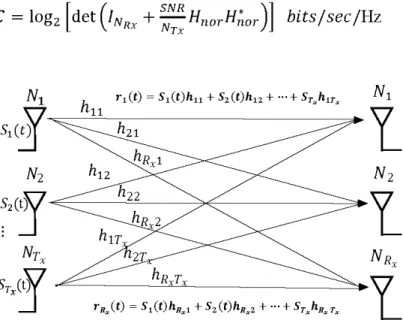
distinguish between those paths. A solution can be proposed by usmg diversity techniques which will be discussed in the next subsection. The capacity of a MIMO system can be predicted by considering N Tx transmitting antennas and N Rx receiving antennas, and derived by Shannon's law the formulais given by:
(!) Nt r1 (t) = S1 (t)hu + Sz (t)h12 + ··· + STxhlT x N1
s,?
l
N2 N2~2~
l
NT x NR xSTx~
rR)t) = 51 (t)hRxl + Sz (t)hRxZ + ... + ST xhRx Txl
Fig. 2.1: A Nrx X NRx MIMO channel, highlighting how transmitted signais are affected in the channel.
where *denotes the transpose-conjugate or the Hermitian, His the NRx X Nrx channel matrix [9]. In order to increase the capacity with respect to the minimum number of transmitting and receiving antennas, the signal fading of the rich multipath environment must be observed individually at the receiving antennas, and we consider this case as a full rank channel matrix. Contrarily, if there is a correlation between paths or if the multiple transmission paths fade dependently, in such case a rank deficient will occur, and the capacity gain will be limited. Before diving into diversity techniques, we must recall sorne mathematical and physical aspects that will be discussed in the next chapters.
2.2.
i
~u:;eS.o.fFaclingJn
a!l:'/terrestrtal wirèle-.;.s
CPtntniintcation~· system,.tlte stgnal willreaéh
therecenter
not·on1ji'Vt'a tite tlirec;t
p'ath, butals o as a·resi:i1t P)?reflectt'ons from ohjects;.sUél! as m:<Düntâin-s ,
b.uil<ling~,
gro.und. water,
etc.tha·t.are
a:djacrent tothe.maur
path..Reflection occUrs:wlien
wav-ea
irrrph!ge
up~ttan
olrstrut!i ott
that
ü
much latg:er
ru
·dz:e
c~mpar.ed tQth<
wav-elength
;l: of th a ·dgnal. The· mu1ti pa:th -effectis fue maintal}:re·
off
adl:ng.
wlrith
arbet-fr~mthe st atter ing. action
Qr
the
>t:i!itter~.!'ltatter\ng
ptcu~s,when the· radio:>
eh~nelcontains
obj:ecu
whi:ISJ>s>zes
attlon the
odet<>f
the
wavelength
qr1 eas
·OÉth<
propagating vro,ye apd alsP wh en the numhers
0foostaol es are
~1\lt~l·arge. They are
proi:lùc.e.d
even
bysmall
<!>.b]eBts,surface rq.ughness
anA
Q..th.er
i~-reg~tlarlti.ecs onthe
chaJ;tnel. Itfollpws
·saJ;tle princip!eS;
ç.f
di!fractioq.
Dif&actioo is a propxît:ti onaf ·sten;;uioin whicp an
obje.ét wltoseclim:ension is larger.than the·$ignijl
Vi;oayelength and whi c)1 hat--sb-arp .e.d_te;;.:ô'bstnicts apatk
betweefi transnittterand
r ec.eiver, anJ. cau<~e new~econd~:·waves to b.e _generated.(.Ei:g. 2.2).
llece.lver
ijg.U : A,p.i!.Îtitetll·PfO~~tJOn éll'QtotUneilt te~setltÙ~g;~fleotillt~;$cattélit>g~lij.diffta<tiott,of!~ 1l:atlSl'rtitteci. . SJgt..:i .
The
-oqerâlls~gn~at the r eçeiqer is
<!$UmmatÎ<!\fl 9fthe L'OS.a!id NLOS çqmp.(Mlents
wh!cll le·ad
tq $Uperpgsi'lignil>fmultipl e
?ignals
whioh
will
~eeither
çon::t;ruc!tve-gr
wireless channel can be represented mathematically as the summation of multiple signais each has different delay and attenuation as follows:
h(t) = If~l a;o(t- r;)
where a; represents the attenuation of each path and T is the delay that differs according to each signal path.
2.2.2 Additive White Gaussian Noise (A WGN):
(2)
Additive white Gaussian noise (AWGN) is basic and generally accepted mode! for thermal noise in communication channels, it's a mode! used in Information theory to mimic the effect of many random processes that occur in nature. The modifiers have a set of assumptions that:
• Additive: The noise is additive, i.e., the received signal equals the transmit signal plus sorne noise, where the noise is statistically independent of the signal. • White: Refers to the idea that it has uniform power across the frequency band
for the information system.
• Gaussian: The noise samples have a Gaussian distribution in the time domain with an average time domain value of zero.
The A WGN channel is an important mode! for many satellite and deep space communication links. However, for terrestrial path mode ling, A WGN is commonly used to simulate background noise of the channel under study, in addition to multipath, terrain blocking, interference, ground clutter and self-interference that modern radio systems encounter in terrestrial operation [10].
2.2.3 Singular value decomposition (SVD):
One of the most useful methods from linear algebra is the matrix decomposition known as the singular value decomposition. It's an important tool for analyzing MIMO systems. The method is to decompose the basic matrix into three matrices. Accordingly, every matrix H can be decomposed accordingly to singular values as follows:
H = UDVH (3)
Where the matrices U, V are unitaries of dimensions
nr
Xnr
andnt
Xnt ,
while D is a non-negative diagonal matrix of dimensionsnr
Xnt.
The diagonal elements of matrix D are the singular values of the channel matrix H. The algorithm of singular value decomposition that provides the above transformation can be found in [11].2.2.4 Water-Filling Method:
Water-Filling algorithm is a technique used in digital communications systems for efficiently allocates different levels of power to varions transmitting antennas or arnong different channels in multicarrier schemes. This technique proves its optimality for channels having A WGN and Inter Symbol Interference. The algorithm allocates more power to the antennas that experience channels that are in better conditions, and Jess or none at ali, to the antennas whose channels are in bad conditions [12]. If the channel is completely known. Renee, assigning power can be more efficient and in according with the channel conditions the capacity can be improved. Water-Filling method has to satisfy the optimal power allocation policy, since this algorithm only concentrates on good-quality channels and discards the bad ones during each channel realization, it is to be expected that this method yields a capacity that is equal or better than the capacity when the channel is unknown to the transmitter [13].
2.2.5 Channel State Information (CSI):
Channel state information refers to known channel properties of a communication link. For MIM 0 systems. The transmitter or receiver must have accessibility to instantaneous CSI. This information describes how a signal propagates from the transmitter to the receiver and represents the power decay and the physical aspects that are discussed in the previous section. CSI aims to make a channel estimation, this estimation of the channel allows adapting transmissions to current channel conditions, which is crucial for achieving reliable communication with high data rates in multiantenna systems. The knowledge of accurate and timely CSI at the transmitter is becoming increasingly important in wireless communication systems [14]. While it is often assumed that the receiver needs to know the channel for accurate power control, scheduling, and data demodulation. According to SVD in the previous section, we can express the total capacity ofn SISO subchannels as in equation (4):
(4)
Where Pk is the power allocated to the kth subchannel andE~ is the eignevalues of the
H H H matrix. From this perspective, the transmitter might have a knowledge of the CSI
or might not. If the transmitter doesn't have knowledge of the CSI, in this case, the transmitting signal s is chosen to be statistically non-preferential, which implies that the nt components of the transmitted signal are independent and equi-powered at the transmit antennas [15]. Renee, the power allocated to each of the nt subchannels is
Pk = .E.... Applying the last expression to Equation 1 gives: nt
In the case of a known CSI at the transmitter, now waterfilling method can be applied at the transmitter. In this way, the SISO subchannel that contributed to the highest data rate is supplied with more power.
2.2.6 Ergodic Capacity
The ergodic capacity of a MIMO channel is the aggregate average of the information rate over the distribution of the elements of the channel matrix H, and it is given by:
c
E{I} (6)When there is no CSI at the transmitter, we can substitute Equation (6) into Equation (1 ), so the ergodic capacity is given by:
(7)
Whereas with CSI at the transmitter the ergodic capacity is given by:
(8)
Where Yk corresponds to the amount of power that is assigned to the kth subchannel. The goal with the waterfilling algorithm is to find the optimum Yk that maximizes the capacity given in (8), where Pk is the power allocated to the kth subchannel and E~ is its power gain, where p is the maximum normalized transmit [ 16].
2.2.7 Angular Spread and Coherence Distance:
Moving to angular spread, path Joss and delay spread are the mam channel characterization which SISO systems focuses on. However, its known that spatial
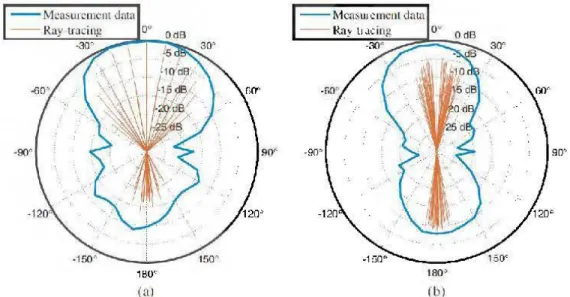
domains become equally important as the tempornl domain for MIMO systems. Renee. power azimuth spectrum (PAS) bas been defined. which determines the spatial distribution of the received power over the degrees offteedom in the horizontal domain ( azimuth domain) [ 17]. In the 2D structured antenna array. one can control the radiation bearn pattern to provide more degrees of fteedom in supporting users on both vertical which represents the elevation angle and horizontal which represents the azimuth angle direction so that the control of the transmit bearn is in 3D. In our study. we considered only the azimuth angle since our environment is designated to have a limited height across its cross-sectional dimensions. Fig. 2.3 supports this approach. in this experiment that's done by Yin and Zheng in Nantong tunnel. China [18]. We can inte:rpret that the angular spread in the smaller distance separation between the Tx and Rx is wider comparing to a larger distance. This phenomenon leads us to two crucial points in our study. First. propagation in like these environments can be separated into two regions. the near-field and the far-field region. which the ftee space propagation principals can be applied in the near-field region. The other pointis that as the R:x is located farther from the Tx point, the angnlar spread will drop eventually which will lead the propagation to act similarly as a waveguide.
- - McaSUJClllCll! data ·90" 1t!O" (al !lO' (b)
Fig. 2.3: Power Azinmth Profiles comparison between channel measurement and ray-tracing simulation in Nantong
Indeed, a parameterthat characterizes selective space fading's is the coherence distance, the coherence distance De is the spatial distance over which the channel does not change appreciably. It is a common and important wireless communication channel parameter, De that is inversely proportional to the angular spread. The De is the spatial separation for which the autocorrelation coefficient of the spatial multiplexing drops to
0.7. In conventional indoor and microcell environments, the PAS at the mobile unit tends to be broad so fading on adjacent antenna elements tends to be more uncorrelated for relatively small element separations. Linear confined spaces such as tunnels and drift in underground mines tend to function as overmoded waveguides at radio frequencies. As a result, the PAS in such environments are expected to be considerably narrower than in conventional environments and the performance of MIMO wireless systems, is likely to be reduced [15].
2.3 MIMO Categories:
In principle, MIMO offers three different benefits, namely spatial diversity, spatial multiplexing, and beamforming gain [19]. This chapter describes the difference in performance for each MIMO technique in an underground mine and by obtaining the impact of those techniques on the capacity, power, and SINR at the receiver array. (SINR is a measure of signal, interference and noise quantity in a wireless system. It indicates how much desired signal is stronger compare to Noise and interference).
2.3.1 Spatial diversity
Due to Severe attenuation in a multipath wireless environment, the receiver can't retrieve the transmitted signal unless the latter is provided with sorne form of diversity. Indeed, by transmitting the data signais over multiple independently fading dimensions
in frequency, time, and space and by performing proper combining at the receiver, in this case, we can achieve diversity gain.
The method is to pro vide the receiver with less-attenuated replie a of the transmitted signal. In sorne applications, the only practical means of achieving diversity is the deployment of antenna arrays at the transmitter and/or the receiver. However, considering the fact that receivers are typically required to be small, it may not be practical to deploy multiple receive antennas at the remote station [18]. This motivates us considering transmit diversity. So, Appling received spatial needs a signal processing at the receivers, and for small deviees, it will be not desirable, instead of transmitted spatial is more preferable.
Diversity is introduced in its different forms to enhance the performance of the system. Time diversity where the same message is being transmitted at different time slots, frequency diversity the same message is being transmitted at different frequencies and space diversity that uses separate antennas located in different positions to take advantage of the different radio path [20]. To demonstrate the benefit of diversity we must know that the received signal can be represented as the sum of the varions multipath components as follows:
Yp(t) =
If,:-J
Re {a;(t) s(t- T;)eiZrrFc(t-r;)j} (9)Where
a
is the attenuation of each path ands
is the transmitted signal at certain timet
and T is the delay, and fe is the carrier frequency. Considering taking the base band received signal only and applying the narrow band assumption for the transmitted signal, we will have the following equation:The detailed deduction of the prev10us equations 1s provided in Appendix A. The impulse response of the channel becomes:
h(t) = y(t) = ,.,L_::-1 ae-JZrrFcr;
s(t) L..t-0 (11)
Where h(t) follows Rayleigh distribution. Although Rician distribution is more used for LOS situations, but Rayleigh can be more accurate in mines where the signais can rave because of the mine curvatures. Besides, having static simulations with independent channel realizations can neglect the LOS or NLOS consideration. knowing that poor performance in the wireless system can occur if the signal power is Jess than noise threshold where this situation is assigned to the deep fade of the wireless channel. In addition, BER is proportional to the deep fade where destructive interference occurs. Thus, spatial diversity can solve deep fade situations, now multiple antennas can exist at the receiver and hence decreasing the probability of the deep fade, where the BER can decrease with increasing the spatial elements as follows [21]:
BER=
CN'RL)
(12)Where L is the number of antennas, indeed, this is not the case for waveguide-like structures, so by increasing the number of elements, we cannot achieve a low BER as we will see in Chapter IV.
2.3.1.1 Receiver Diversity Techniques:
Received diversity techniques are performed at the receiver to strengthen the signal. These techniques can be applied once two or more channels that have uncorrelated fading are transmitted. Thus, by combining tho se channels into a single amplified signal
without additive noise, the system' s reliability can be improved. In this section we will introduce three main received diversity techniques which will be used in Chapter IV.
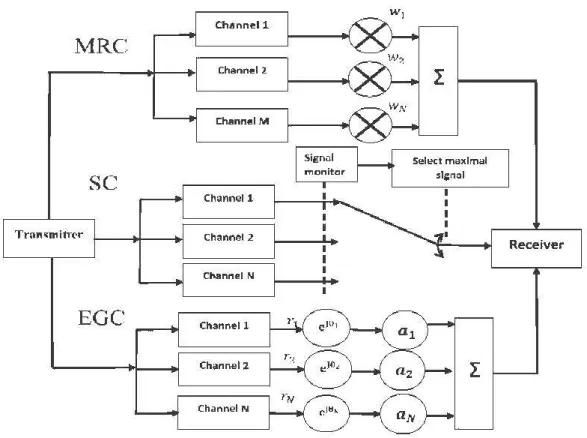
1. Maximal ratio combining (MRC):
The main aim of this method is to maximize the SNR at the receiver for the multiple received elements and that by combining the received voltages by using a weighting vector which can adjust both the magnitude and the phase , the receiver optimally combines the received voltage from ali antenna elements using a weighting vector that adjusts both the phase and the magnitude (Fig.2.4). The general mode! for MIMO wireless communication is given as [22]:
y=
Hx+
n = HPs+
nWhere x = Ps is the precoded and r = Wy is the filtered output.
(13)
In the maximal ratio combining, ali received signais are coherently combined at the rece1ver, e.g.:
(14)
Where the optimal weighting vector
w
maximizes the moutput SNR for the intended user by Cauchy-Schwartz inequality it is found that SNR is maximized whenw
is proportional to h as follows:lwhhl'
lwHhl'
h
W =
-narm (16)
Where H is a normalization factor that scales the weighting vector such that the sum of the squares of the magnitudes is equal to Nr . This weighting vector is th en applied to the h-vector to compute the total received power.
11. Selection combining (SC):
The basic idea in SC is to choose the branch which have the highest SINR. To calculate this, each receiver antenna should be treated as if it were an individual receiver (Fig. 2.4). From channel gain, the received power for receiver antenna element, k is calculated as follows:
(17)
Where Pt is the total transmitter power in milliwatts, and Nt is the number oftransmitter antennas over which this power has been divided. The sarne equation can be used to calculate the interference power to this antenna using the corresponding h-vectors from transmitters identified as interferers. SINR is then calculated for each receiving antenna, and the highest is selected. The capacity, throughput, and BER can then be calculated from this SINR value as if this were a SISO antenna [14].
111. Equal gain combining (EGC):
EGC is considered to be simpler and cheaper for practical implementation than MRC, and that because ali summands have the sarne weighting factor, by applying a weighting vector to align phases before combining the channel gains from each receiver antenna (Fig. 2.4), it will not be required to measure and estimate SNR in ali the diversity
branches. But we can expect from this simplicity that MRC can perform better, especially in a rich scattering environment. To calculate the total received power, a weighting vector is calculated that has unity gain and a phase equal to that of the h
vectorfor each element [15,16]:
(18)
This weighting vector is then applied to the h-vector for the rece1ver elements to compute the total received power:
(19)
Channell
MRC
ChannO!I2 Channel Msc
Channel! Tran~mitT<'t" chal'lnel2 Receiver Channel NEGC
Channel! Channei:Z Ch;~nnel NFig. 2.4: Scheme representing the three precoding' s MRC, SC and EGC.
2.3.2 Closed-loop spatial multiplexing
The second MIMO method is Closed-Loop Spatial Multi.plexing uses Singular Value Decomposition (SVD) to calculate precoding weights appli.ed at the transmitter and combining weights at the receiver to generate multiple, non-interfering, data streams. For throughput calculations, the total throughput is calculated by summing the individual throughputs of each stream. For other commurùcation system outputs, the best value from all streams is returned. Similarly, for interference and noise analysis, the highest SNR and SINR of all generated data streams is returned. In which the transmitter and receiver coordinate to generate an optimal set of independent data streams. This method uses the SVD technique, for a single user, this provides multiple,
in dependent streams ( diagonals of the L matrix) that can each contribute to the total throughput or capacity.
Once the precoding and post-process matrices, U and V, have been applied, the equivalent channel matrix can be described by the singular value matrix L instead of H according to the following equation:
(20)
This matrix has the same dimensions as H, Nr X Nt, but contains values only along the diagonal for a number of singular values equal to the minimum of the two dimensions of the matrix, Nr and Nt.
2.4 Transmitting Beamforming Analysis
Beamforming or spatial filtering is a signal processing technique used in different areas from MIMO, to massive MIMO, to interference mitigation or wireless senor networks. The aim of beamforming is to use sensor arrays at both the transmitting or receiving ends in order to achieve spatial selectivity and that's by directing the signal. This is achieved by combining elements in an antenna array in such a way that signais at particular angles experience constructive interference while others experience destructive interference. Directing signais may be applied only from one side, for example transmission beamforming concentrates the transmitter to the direction of the mobile receiver, this situation is our concern in this chapter. In this study we will consider two types for transmitting beamforming: the first is an adaptive technique called maximum ratio transmission (MRT) and the second is zero-forcing technique (ZF). Beamforming techniques such as MRT and ZF which is based on knowing the CSI channel cannot be very effective in waveguide like environments, and that is related to the coupling between the channels. However, in mine tunnel which have unperfect
walls the situation can be a quite different. MRT, as the name implies, intends to maximize the SNR. It is the easiest method from a signal processing perspective, as the detection/precoding matrix is only the conjugate transpose or conjugate of the CSI matrix, H. The significant downside of this method is that inter-user interference is disregarded. In brief, this technique uses the channel matrix within the transmitting and receiving antennas to optimize the power at the receiver [21]. The beamforming weighting matrix between a transmitter and a particular receiver antenna element, k, is defined as:
(21)
Where hk is the Nt n channel vector between the transmitting array and the receiver antenna. The quantity in the denominator is the absolute magnitude of the channel vector, which is the square root of the sum of the square magnitudes of the channel vector. This weighting matrix maximizes the bearn to the specifie receiver antenna.
In the other side, ZF precoding strives to inscribe the inter-user interference problem by designing the optimization guidelines to reduce it. The detection/precoding matrix is the pseudoinverse of the CSI matrix. Determining the pseudoinverse is more computationally costly than the complex conjugate as in the MR case. Y et, by focusing so keenly on reducing the interference, the received signal at the user suffers from the Jack of power.
CHAPTER III
MODAL ANALYSIS OF ELECTROMAGNETIC WAVE PROPAGATION IN UNDERGROUND MINES
3.1 Introduction
While previous studies ofMIMO mode ling and configuration design in confined spaces have yielded useful insights, they cannot replace studies that is designated for underground mines. Consequently, undergrounds communication engineers have had little to guide them as they seek to design and deploy MIMO based wireless systems. Compared to transportation tunnels (the most similar to the mine tunnels), whereas MIMO is considered to be more complicated compared to SISO especially in underground mine tunnels that have a narrow width which may lead to higher modal eut off frequencies and lower angular spread that will cause a limitation to the MIMO performance. In addition, mine tunnels have branches, considerably rougher walls, and irregular geometry, which cause much more diffuse scatter. Indeed, further study is required in order to assess the relative magnitude ofthese effects and to determine the MIMO performance that can be achieved [23].
Consequently, as a result, in this chapter, we will discuss wave electromagnetic propagation in these confined environments in order to assess the performance of
MIMO systems. Besides, a modal analysis in mine tunnels is introduced, and we calculated the number of modes which is necessary to know the propagation channels as we will see in Chapter V.
3.2 Related Works of Channel Modeling in Waveguides
Recent! y, as technology has migrated toward higher frequencies, channel modeling has become more complex. Previously, in many models, they treat underground tunnels as simple tunnels with smooth walls. Taking an example, the single mode waveguide mode! which has been proposed 50 years ago can mode! the propagation Joss signais in mine today for the UHF band (200-4000 MHz) [24]. Recent channel modeling versions have been enhanced and customized to treat multimode, which can be more accurate in mode ling delay spread and propagation Joss in the upper UHF band. Previous work on waveguide propagation have been extended by Emslie et al. in [25] for the rectangular cross sections, by considering them as an oversized dielectric waveguide, and they found accurate mode equations which are based on the simple assumption of uniform dielectric constant for the tunnel. In order to provide more accuracy to the mode!, Mahmoud and Emslie, and wait in [26] considered dielectric constant of the sidewalls was different from the dielectric constant existed in the floor and the ceiling, this case can be betterthan considering a uniform dielectric constant. In [27], Emslie et al. applied a waveguide mode! to tunnels with approximately rectangular cross-section, such as coal mines with a considerable degree of roughness, and tunnels with curved walls.
Currently, there are four main channel models exists for tunnels include the waveguide mode!, the Geometrical optical mode! (GO mode!), the full wave mode!, and the hybrid mode!.
3.2.1 The Waveguide Model:
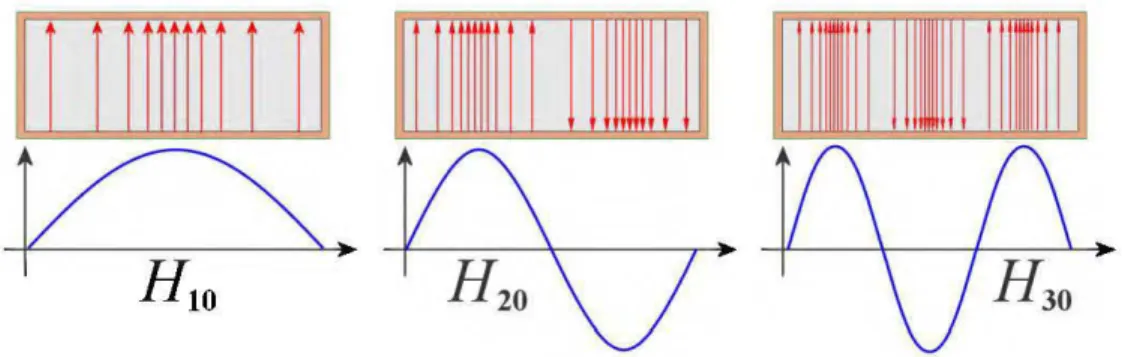
Transmission of EM waves in tunnels under sorne conditions may take the form of waveguide propagation. For the transmission to take this form, the materials bounding the tunnel must have a dielectric constant ranging between 5 to 10, besides for having a frequency which is above 500 MHz. A waveguide is a structure that guides waves, such as electromagnetic waves or sound, with minimal loss of energy by restricting expansion to one dimension or two, tho se structures functions as "conduits" for carrying electromagnetic waves. They are practical only for signals of extremely high frequency, where the signal wavelength approaches the cross-sectional dimensions of the waveguide. Electromagnetic waveguides are analyzed by solving Maxwell's equations, orthe ir reduced form, the EM wave equation, including the boundary conditions defined by the characteristics of the materials and their interfaces. The se equations have multiple solutions, or modes, which are eigenfunctions of the equation system. Each mode is described by a cutofffrequency underthis frequencythe mode cannot exist in the guide. Waveguide propagation modes depend on the operating wavelength and polarization and the shape and size of the guide. The longitudinal mode of a waveguide is a particular standing wave pattern formed by waves confined in the cavity. Fig.3.1 shows a graphical depiction of the E field variation in a waveguide for the TE10 TE2o, and TE3o modes. As can be se en, the first index indicates the number of half wave loops across the width of the guide and the second index, the number ofloops across the height of the guide which in this case is zero. The transverse modes are classified into different types:
• TE modes (transverse electric) have no electric field m the direction of propagation.
• TM modes (transverse magnetic) have no magnetic field in the direction of propagation.
• TEM modes (transverse electromagnetic) have no electric nor magnetic field in the direction of propagation.
• Hybrid modes have both electric and magnetic field components in the direction of propagation.
Fig. 3.1: Different Hybrid mode shapes.
3.2.2 Geometrical Optical Model (Ray Tracing):
Unlike modal analysis in the waveguide model, which is restricted to simple geometries, ray-optical methods can be applied to more complex scenarios such as occupied tunnels, tunnels with curvature, the coup ling between outside and inside of the tunnel, etc. The name ray tracing is used to describe the process in which the electromagnetic fields are modeled in this method. Applying a high frequency approximation, a transmitting source emits a series of ray tubes in all directions that propagate outwards and represent different points on a wavefront. As the rays travel away from the source, they incur phase change and loss that is associated with an outwardly propagating wave at a given frequency. Interactions with objects are computed based on the Fresnel and diffraction equations that govem geometrie optics [28]. There are generally two types of approaches to ray tracing. The first is known as the shooting and bouncing ray (SBR) method which essentially launches a number of
rays in ali directions from the source in order to sufficiently illuminate its surroundings [4]. Upon the point of contact with a media boundary, a new set of rays are excited, traveling according to the laws of reftection, refraction, and diffraction. Each ray decays as it propagates and is terminated when its amplitude has dropped below a given threshold. At the receiver point, a reception radius is applied to sum up and average out ali the incoming fields that intercept the given area or volume. A very large number of rays is typically required for the fields to converge, and since each ray can branch out exponentially before decaying below the threshold, this method can still be computationally intensive for large environments with many scatterers. However, in sorne cases, the SBR method is advantageous in the sense that the final result characterizes the entire simulation domain.
For geometrically simpler surroundings, the image theory (IT) method tends to be more efficient as the effects of multiple reftections and refractions are much easier to calculate [4]. Instead ofsystematically shooting out rays in ali directions, the algorithm first calculates, based on the positions of the transmitting and receiving antennas, precisely which rays will propagate to the receiver point. As a result, there is no need for a sampling radius and no time is spent computing ray paths that do not contribute to the field at the receiver because the user chooses which region to illuminate and what areas can be ignored. Its name is taken from the simple example of a transmitter located above a ground plane, in which the resulting reftection is effectively modeled by an image source below the ground generating the reftected fields. In the case of more complicated scenarios there are many more planes and, hence, multiple reftections and many more image source locations to compute, but the concept remains the same.
For arbitrary tunnel shapes, GO and Full wave mode! can be more accurate in near and far field regions, but this mode! needs high-performance computers if the tunnel distance is large. For this reason, the hybrid mode! reveals as a combination of GO mode! and waveguide mode! in order to facilitate computer calculations and to solve the near field region precision. The Multimode mode! was a good innovation in the hybrid mode!, where the basic idea is to separate the tunnel into two field regions, the far-field region and the near-field region and that is because in a lossy waveguide environment a large number of modes exists near the transmitter where waveguide can't mode! this case. Thus, the method used is to use the free space mode! in the near-field and by assigning rays to modes by a matching technique, multimode mode! is explained in details in [26].
For this work, we adopted the ray-tracing mode! since our simulations consider taking tunnel with a maximum 200 rn length. Indeed, recent graphies cards can be ar this simulation with a short time; consequently, we can avoid the complexity ofhybrid and full-wave models and with a precise result.
3.3 Modal Analysis ofLossy Waveguide Environments
The aim of this section is to understand how EM wave propagation acts in mine tunnels. In addition, we will demonstrate how to calculate the number of modes in an oversized lossy waveguide.
3.3.1 Multi-Mode Propagation in Lossy Waveguides
In the UHF band, any structure can be modeled as a waveguide if the latter can guide the EM wave through a tunnel shape. Inside the waveguides, EM fields can be resolved into the sum of propagation modes given by resolving Maxwell's equations subject to
the boundary conditions. In the case of dielectric surfaces, propagating waves may be expressed by hybrid modes, with ali three cartesian components of the electric and magnetic field present. These modes are lossy modes because any portion of the wave that spread on the guide wall is partially reflected into the surrounding dielectric and partially reflected back into the waveguide, the refracted component propagates away from the waveguide and represents a power Joss [29]. By identifying tunnel dimensions and material, Maxwell's equations subject to boundary conditions generated by the interfaces between the interior of the tunnels and the wall materials, determine the propagation constant, cutofffrequency and propagation Joss for each mode.
These are important environmental parameters for wireless designs in lossy waveguides such as underground mines. Mine tunnels also may act as a waveguide, resulting in a path Joss exponent Jess than 2. Path Joss exponent is a measure that yields to what power of separation the signal power in the profile decays. It can be determined by applying regression analysis. Most of path Joss models have one or more severa! breakpoints which distinguish areas where radio wave experience different path Joss exponents. In sorne environments such as buildings and other indoor environments, the path Joss exponent can reach values in the range of 3 to 6. Tunnel path Joss mode! has also breakpoints which separate far- field and ne ar field regions. The breakpoint location in a tunnel depends on the largest cross-sectional dimensions (width or high) of the tunnel relative to the signal wavelength. It should be noted that the far-field and near-field definitions for propagation models in tunnels are not the same as far near-field and near field of an antenna. Near field region of a straight tunnel is considered the region before the breakpoint wherein the cross-sectional plane where the transmitter is located, the antenna excites multiple modes. Each mode has a different intensity and phase. In this region, the signal fluctuation is significant because of the reflections and multipath components coming from different directions. Indeed, the waveguide suffers a larger Joss than far-field propagation [30, 31]. This is because the higher order modes are significant in the near-field and should be included in calculations. Afterthe breakpoint,
higher order modes are greatly attenuated and considered to be evanescent modes at large distances and that because of the high attenuation factor they have, and this attenuation results from impinging the walls within a grazing angle, while the fundamental modes survive and they contribute to the total power at the receiver. The separation breakpoint between these two fields is still hard to be obtained in a direct manner due to the different environment shapes, for UHF band which is considered to be higher than the eut off frequency of the waveguide, the ne ar fi led is prolonged , or we can say that the breakpoint is extended from the transmitter, so in this case high order modes can't be neglected because they contribute heavily to the receiver power in the near field zone [28,29].
3.3.2 Theoretical approach for determining the number of modes
In order to determine the number of modes in any arbitrary rectangular cross-section waveguide we must consider sorne parameters such as frequency and the cross-sectional area. For a rectangular cross-section the mode cutoff frequencies of both Transverse Electric (TE) and Transverse Magnetic (TM) modes are given by the well-known formula [33]:
E'~cit.ation
p
Jane:·
wheFethe antennasare
l11œted. _, ,--
,-b
\\11~re· Çt
an-4
b
are the \vtdthan4
hçight respectively,F9r
thel'l\1
motles \loth tt 3lld lttmust
\Je 'tlegative. T~ng int9 c9nsid~>1ti:Pl'l thl!t the tllPdesaFe
coJrsl.d~ted t9 be orthQgonal, EJ,:âct .numb~1'ôi
tn.od!!s
can
b~ apjlt;oJo.:itnat~d in an ideal·wavéguidç:
ài follows:('23)
In
padictihtr,
fôr any'éxcita:ti
o.nfrequ!!nc)'
J,
ônl,y Jh·e motles wh
ose fi:equénci'es àre.hightW
tl1an the cutufr
frequency
is. ~éit!!.dife
5f).
By
sôlvi.ngthe.
Ma.~WélPs equâtiMs,.the
fiéld
distrihutiôn
o.f each mod;é· caribe.
derivell.in
'thefmm of
Where
a
andfJ
are the attenuation coefficient and the phase-shift coefficient, and Cmnis the mode intensity at the excitation plane [36].
Where
eîgn . mrr mr
Emn (x,y)oesm(-x+ !flx).cos(-y+rpy)
' Za Zb
{
O,ifnisodd !fly=
~·if
n is even{
O,ifmisodd !flx =
~·if
mis even(25)
Arbitrary electromagnetic field inside of such a waveguide can be expanded in terms ofthe eigenmodes [37, 38]:
(26)
Where en (x, y) is the normalized modal function of the electric fields which are represented in (25), and ais the mode amplitudes. It's important to estimate the number of modes in any waveguide environment, obviously for underground mines it's quite complicated especially when high order modes start losing their orthogonality. We can consider calculating the amplitudes of the first modes by knowing the E and H fields in each cross-section of the tunnel. Furthermore, the only modes available in the waveguide are those who can have the same shapes in the existing fields [4], the latter can be obtained by ray tracing mode! where the mode amplitudes can be obtained by correlating the E field to the mode functions at a certain cross-sectional are a ZR as follows:
CHAPTERIV
PERFORMANCE ANALYSIS OF SUIT ABLE MIMO DOWNLINK SYSTEMS IN UNDERGROUND MINE
4.1 Introduction
Linear precoding/beamforming systems play a crucial role in the MIMO signal process. For instance, in [40] the authors analyzed the spectral efficiency of a single-cell downlink massive MIMO system with ZF, MRT, and MMSE (minimum mean-square error ). In [ 41], the authors analyzed the performance of the massive downlink MIMO in terms of spectral efficiency, energy efficiency, and link reliability using ZF precoding. The authors in [ 42] compared the matrix and vector normalization for downlink ZF and MRT precoding and analyzed the ergodic performance of such precoding in a cell-boundary users scenario. Although the above works offer sensible results concerning the performances of the linear precoding schemes, they lack the comparison of ZF and MRT performances in terms of the correlation factor that occurs in confined environments. However, according to recent studies which showed that beamforming didn't perform well in narrow tunnels, the aim of this section is to demonstrate that for MIMO system with small antenna array size, and for a suitable precoding technique at the transmitter and receiver, beamforming can perform better in terms of ergodic capacity compared to none precoding scheme.