INFORMATION TO USERS
This manuscript has been reproduced from the microfilm master. UMI films the
text directly tram the original or copy submilted. Thus, some thesis and dissertation copies are in typewriter face, while others may befrom any type of computer printer.
The quality of this reproduction i. dependent upon the quality ofthe copy submitted. Broken or indistinct print, colored or poor quality illustrations and photographs, printbleedthrough, substandard margins, and improper alignment
canadverselyaffectreproduction.
ln the unlikely eventthatthe author did nat send UMI a complete manuscript and there are missing pages, these will be noted. AllO, if unauthorized copyright materialhadtabe removed, anote will indieate the deletion.
Oversize materials (e.g., maps, drawings, charts) are reproduced by sectioning the original, beginning at the upper left·hand corner and continuing tram leftta right in equal sections with smallovertaps.
Photographs induded in the original manuscript have been reproduced xerographically in this copy. Higher quality 6- x 9- black and 'Nhite photographie prints are available for any photographs or illustrations appearing in this copy for an additional charge. ContadUMI directly
ta
order.Bell&Howell Information and Leaming
300 NorthleebRaad, Ann Arbor, MI 48108-1346 USA
UMI~
1
EFFETS DU TRAVAIL DU SOL, DES SYSTÈMES DE CULTURE (MONOCULTURE ET ROTATION) ET DU NIVEAU DE
FERTILISATION AZOTÉE SUR LES ÉMISSIONS D'OXYDE NITREUX
(N20).
par
FRANÇOIS CADRIN
Département des sciences des ressources naturelles Université McGill, Montréal
Novembre, 1997
A thesls submltted to the Faculty of Graduate Studles and Resea~h in parttal CulRlment
or
the requlrements Cor the delreeor
M.Sc.1+1
National Ubrary of Canada Acquisitions and Bibliographie Services 395 Wellington Street OttawaON K1 AON4 canada Bibliothèque nationale duCanada Acquisitions et services bibliographiques 395.rueWellingtonOttawa ON K1AON4 Canada
Your" VamP f,If.,."CII
auftueNot...f.lfffHICS
The author bas granted a
noo-exclusive licence allowing the
National Library of Canada to
reproduce, loan, distribute or sell
copies of this thesis
in microfonn,
paper or electronic fonnats.
The author retains ownership of the
copyright
in
tbis thesis. Neither the
thesis nor substantial extracts from it
May be printed or othelWise
reproduced without the author'
s
permISSion.
L'auteur a accordé une licence non
exclusive permettant
à
la
Bibliothèque nationale du Canada de
reproduire, prêter, distribuer ou
vendre des copies de cette thèse sous
la forme de microfiche/film, de
reproduction sur papier ou sur fonnat
électronique.
L'auteur conserve la propriété du
droit d'auteur qui protège cette thèse.
Ni la thèse
ni
des extraits substantiels
de
celle-ci
ne
doivent être imprimés
ou
autrement
reproduits sans son
autorisation.
0-612-44135-0
Suggested short title
EFFECT OF TILLAGE, CROP ROTATION
RÉSUMÉ
L'oxyde nitreux (N20) dérivant de l'activité agricole contribueàl'effetdeserre ainsi qu'à la destruction de l'ozone stratosphérique. De plus, les émissions de ce gaz représentent une perte d'azote du sol. Il importe de déterminer les quantités de N20 produites en rapport avec les systèmes de grandescultures, afin d'établir des mesures améliorantes. Les émissions de N20 a étéévaluéesde 1994à 1996 pourle maïs en monoculture et la rotation maïs-légumineuses, sur différents sols du Québec. Le maïs en monocultureaété àl'étude sur quatre sols. Deux sols, une argile lourde Ste-Rosalie (gleysol huniique) et un loam sableux Chicot (1uvisol gris brun) ont reçu quatre nivau:< d'azote: 0, 170,285et400 kg N ha-l . Deux autres sols. une argile lourde Ste-Rosalie et
un
lœm limono-argileux Onnstown (gleysol humique) ont été cultivés en monoculture et en rotation, sur deux types de travail du sol, soit le travail conventioMel et le semis direct Les rotation étudiées ont été la monoculture de maïs ou de soya, la rotations mais-soya et maïs-soya-luzerne. Les doses d'azote utilisées onl été de0, 90ou 180 kg N ha-l pour le maïs et de0, 20 ct 40 kg N ha-l pour le soya en monoculture. Le soya et la luzerne cultivés sur
retour de maïs n'ont reçu aucun fertilisant. Les émissions totales de N20 ont été significativement affectées par le taux d'azote appliqué, le type de travail de sol et la teneur en eau du sol. Lesparcelles en semis direct ainsi que celles cultivées en maïs ont généralement produit plus de N20que tout autre parcelle. 1.0à 1.6 % de l'azote appliqué comme engrais minéral a été émis sou.~ formede N20. Les émissions de N20 ont été
significativement corrélées autau~dedénitrification,au pourcentage de saturation en eau des pores du sol etàla tencur cn Nl-4· ct en NO]- du sol. Laculture du maïs sur unsol en travail conventionnel. en rotationavec des légumineuses etrecevant une dose d'azote moyennepeutréduire lesémissionsde N20.
ABSTRACT
Nitrous oxide (N20) produced from agricultural activities mu:;t he determined if
managementprocedures toreduce emissions are ta he est4~lished. From 1994 to 1996, N20 emissions were detennined under continuous corn and com-legume rotations in different sails of Quebec. Continuous corn was studied on four sites, m'o from a long-tenn experiment, a Ste. Rosalie hea\)' clay (Humic Gleysol) and a Chicot sandy lcam (Gray-Brown Luvisol), al0, 170,285and400 kg Nha-l, and two from acorn rotation study. a Ste. Rosalie clay (Humic Gleysol) and an Ormstown silty clay loàm (Humic Gleysol). Treatments in the rotation study iocluded n~till (NT) and conventional tillage
(Cf). monocropped COn\y monocropped soyhean; com-soybean; and
soybean-com-alfalfaphasedrotations. Nitrogen rates of0,90, and ISO kg N ha-1for corn and 0, 20. and 40 kg N ha-1 for monocropped soybean were used. and soybeanlalfalfa with no
fenilizer Nfollowing corn. Rates of N20 emissions were significantly affected by N fenilization. tillage and sail mOlsture content. GeneraIly, N20 eroissions were higher in the NT systems, with corn, and incrcascd "'lth incrcasing N rates. locreased nitrogen applications led to hnear Incrca'iCS ln N20 emission o\'er the threc ycars for bath Ste. Rosalie (2) and Ormstown soils at a rate of 1.0 to 1.6 percent of added N. The N20 cmlsslon rates wcre significantly relutcd to sail denitrification rates, walCr fillcd porc spacc, and soil NH-l+ and NOJ-concentrations in ail three years. A corn system using con\'cntional tillage. legurnes ln n,labon and reduced N fertilizer would decrea."e N20 emission from agricultural fields.
Il
1
1
PRÉFACE
FORWARD
This thesis consists of a number of chapters in paper format. Consequently the following extract from Faculty of Graduate Studies and Research regulations must he included. "Candidates have the option of including, as partof the thesis, the text of one or more papers submitted or ta he submitted for publication, or clearly-duplicated text of one or more published papers. These texts must he bound as an integral part of the thesis. If this is the option chosen, connecbng texts that provide logical bridges bet\veen the different papers are mandatoT)'. The thesis musthe written in such away that it is more
than a collectionof manuscripts; in other words, results of a series of papers must he
integrated. The thesis must still conform to ail other requirements of "Guidelines for Thesis Preparation". The thesis must include: A table of contents, an abstract in English and French,éUlintroduction which clearly states the rationale and objectives of the study,
a comprehensive revie\\' of theliterature~a final conclusion and summary, and a thorough bibliographyor reference liSl
AdditionaI material must he provided where appropriate (e.g. in appendices) and in sufficient detail taal10"'a clear and precise judgment to be made of the importance and
onglnaJi
lyoftheresearch rcponcdlnthe thcsis,ln the case of manUscripL4\ co-authorcd by the candidate and others, the candidate is rcqwrcd to malœ an explicll sUltemenl in the thesis as to \\'ho contributed to such \\'ork and ID what extenl. Supervlsors must altest to the accuracy of 5uch statement at the
doctoral oro! defense. Since the task of the c:uminers is made more difficult in this cases.
ilis in thecandidate'sinterest to makeperfcctlyc1earthe responsibilities of ail the authors of the co-authored papcrs."
Chapter III has been pubhshed
ln
the Canadian Journal of Soil ScienceTT: 145-152, in 1997. Chapter IV bas becn acccplcd by the Journal of Elnironmental Quality, Chapter III and IV "'ere co-authored by the candidate, A.F. MacKenzie and Dr M.X. Fan. Chapter IV "'as aise co-authorcd by M. Abbott. The author was responsible for significantparts ofdatacollecùon, analyses, interpretation and presentation. Professor MacKenzie pro"ided o'·crall guidance,DrFandailysupervisiœandM. Abbott help in the field.1
REMERCIEMENTS
Je tiens d'abordàadresser mes sincères remerciements à mon superviseur. le Professeur A.F. MacKenzie pour son support. ses conseils ainsi que la patience dontil a fait preuve tout au long de mon cheminement.
Tout ce travail nraunùt pu être accompli sans l'aide quotidien du Dr Ming."<iang Fan. Sa grande expérience du travail au champ et del'analysede données ainsi que son soutien et sa disponibilité ontétégrandement appréciés.
Je tiens également à remercier les membres du personnel de l'Université McGill. qui mronl également apporté une aide précieuse: Peter Kirby. Melissa Abbon. Philippe Dionne. Xing Hua Xie. Tadde Lukumbuzya , Joe Tombasco. le Professeur James W. Fyles et MmeMaryJ. Kubecki.
Je dédie cet ouvrage à ma compagne de tous les jours Jasée, pour sa compréhension. pour l'appui ct Pamour qu'clIc a su m'apporter durant toutes ces années...et aussi àmes parents. pour leur suppon.
TABLE DES MATIÈRES
RÉSUMÉ 11
PR.ÉFACE IV
RErvŒRCIEl\IIEmS V
TABLE DES MATIÈRES VI
LI~EDES HGVRES "" "VIII
US'fE DES TABLEAUX " X
CHAPITRE 1. INTRODUCfION 12
CHAPITRE II. REVUE DE LITIÉRATURE 15
1. RÉACfIONSMICROBIENNES DANS LE SOL 16
1.1.L.a dénitrification 16
1.2. Facteursaffectantla dénitrification 17
13.L.anitrification 20
1.4.Facteursaffectant lanltnfication 21
2.ASPEcrSAGRONOMI QVES 24
1.1 Effel delafcruhsauon 24
2.2Effet du tra\"all du sol 15
23 Effet dc la rolatloncultur~c 26
3. HVroTHÈSES 28
4. OBJEcrIFS 2S
CHAPITRE III. NlTROUS OXIDE EMISSION AS AFFECfED SY TILLAGE, CORN-SOYBEAN-ALFALFA ROfATIONS AND NITROGEN
FERTIUZAnON 29
1. ABSTRAcr " 30
2. Im-RODUcrION 31
3.1. Field experiments 32
3.2. Statistical analyses 35
4. RESULTS 35
4.1. Nitrous Oxide Emission Rates 36
4.1. Total N losses From N20 emission 37
5. DISCUSSION 39
CONNECfING PARAGRAPH 53
CHAPITRE IV. NITROUS OXIDE ElvUSSION IN THREE YEARS AS
AFFECTED SY TILLAGE, CORN-SOYBEAN-ALFALFA ROTATIONS
AND NITROGENFERTILlZATIDN 54
1.ABSTRAcr S5
2. INTRODUCTION .56
3. MATERlALS ANDMErHOOS 57
3.1.Field exJX:nments 57
3.2. StatisticaJ analyses 60
4. RESULTS 6()
4.1.Nltrous OXlde EmiSSion Rates 6()
4.1. Tolalnltrogcn lossesl'rom nUrousoxide emission 61
5. DiSCUSSiON M
CHAPITRE V. CONCLUSIONS Gt!NéRALES 78
RÉFÉRENCES. ... ... .. 82
APPENDICES 88
1
LISTE DES FIGURES
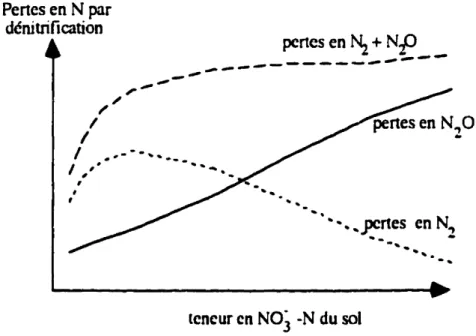
Figure 2.1. Schématisation de l'effet de la teneur en NÛJ- du sol sur les pertes
enN2et enN20pardénitrification 19
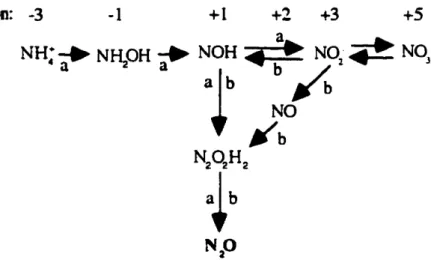
Figure 2.2. Représentation des différentes voies du processus de nitrification.
menant à la production deN20 , 22
Figure 3.1. Soil temperature and moisture content changes in the Ste. Rosalie (1), (2), Chicot, and Ormstown sites in the 1994 growing
scason , :. . ... .... 46
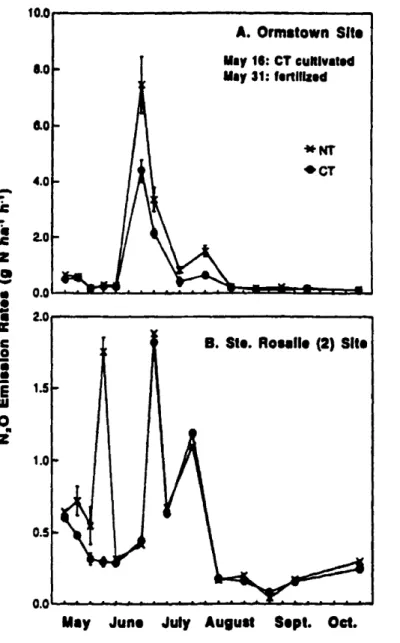
Figure 3,2. Nitrous oxide emission rates from NT and CT in Ormstown and
Ste. Rosalie(2) sites in the 1994growing season 47 Figure 33(a).Nitrous oxide emisslon rates from continuous soybean (SSSS),
soybean-com rotation (SCSC) and alfalfa-com-soybean rotation (ACSA) in Ormsto\\'n and Ste. Rosalie (2) sites in the 1994
gro\\'ing season 48
Figure 33(b).Nitrous oxide cmlSSlon rates from continuous corn (CCCC), soybean-com roUibon (SCSC) and com-soybean-alfalfa rolation
(CSAC) in Ormsto\\'n and Ste. Rosalie (2) sites in the 1994
gro\\'ing season 49
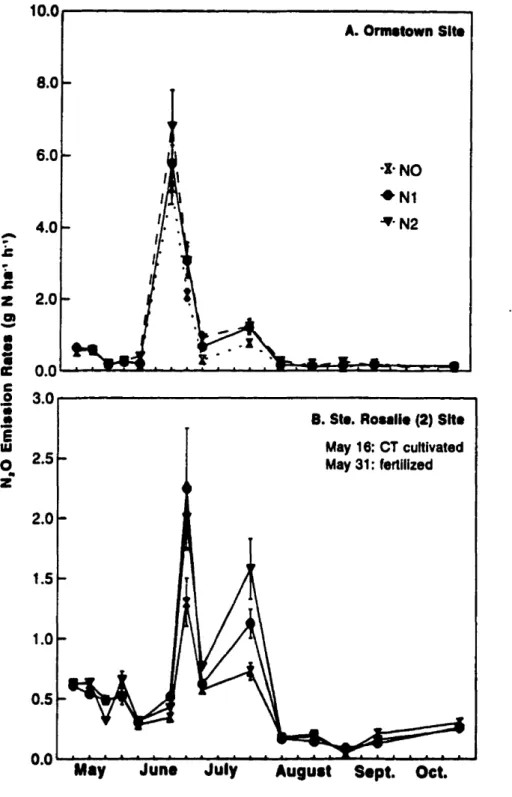
Figure 3.4. Nitrous oXldc cmlsslon rates as affected by nitrogen rate in
Ormstown and Ste. Rosalie (2) sites in the 1994 growing season 50 Figure 3.5. Nitrous OXJdc cmlSSlon rates from monoculture corn fields as
affected by nitrageR raies inSte. Rosalie (1) and Chicot sites in
the 1994 gro\\..ng scason SI
Figure 3.6. Emission of nitrous oxide from continuous corn fertilized with
Figure 4.1. Nitrous oxide emission rate as affected by no-till (NT) and conventional tillage in Ste. Rosalie (2) and Onnstown soils in
1995 and 1996 gro\\'ing season , 73
Figure 4.2. Nitrous oxide emission rate from Ste. Rosalie (2) and Ormsto\\'n soils as arfected by crop rotations in 1995 and 1996 growing
season 74
Figure 4.3. Nitrous oxide emission from continuous corn as related to
nitrogen rates on four soils in 1994, 1995 and 1996 75 Figure 4.4. Sail ammonium and nitrate nitrogen contents and water filled pare
space (WFPS) with tillage across ail nitrogen rates and rotations in Ste. Rosalie (2) and Ormstown soils in the growing season of
1996 76
Figure 4.5. Sail ammonium and nitrate nitrogen contents and water filled pore space(WFPS) with rotations across ail nitrogen rates and tillages in Ste. Rosalie (2) and Ormstown soUs in the growing scason of
1996 '" '" 77
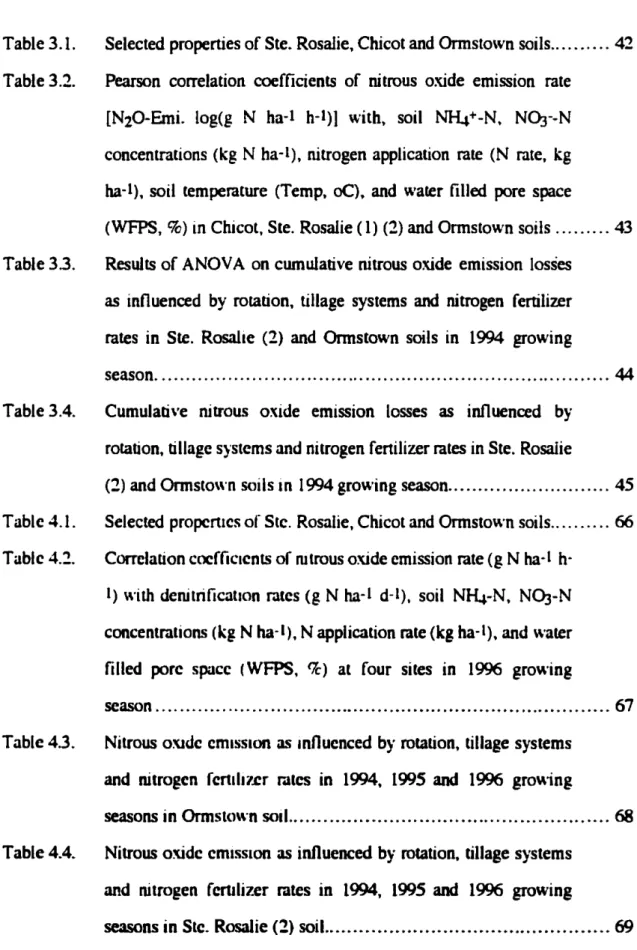
Table3.1. Table 3.2. Table33. Table3.4. Table 4.1. Table 4.:2. Table 43. Table 4.4.
LISTE DES TABLEAUX
Selected properties of Ste. Rosalie, Chicot and Ormstown soils 42 Pearson correlation coefficients of nitrous oxide emission rate
[N20-Emi. log(g N ha-1 h-1)] with, soil
M4+-N.
NO.r-N concentrations (kg N ha-1), nitrogen application rate (N rate, kg ha-l ), soil temperature (Temp, oC),. and water filled pore space(WFPS, %)inChicot,. Ste. Rosalie (1)(2) andOrmstown soils 43 ResuJts ofANOVA oncumulative nitrous oxide emission losses
as influenced by rotation, tillage systems and nitrogen fertilizer rates in Ste. Rosalie (2) and Ormstown soils in 1994 growing
season ",., ,.. , , ,
44-Cumulati\'e nitrous oxide emission losses as innuenced by rOlation, tillagesystemsand nitrogen fenilizer rates in Ste. Rosalie
(2)and Ormstown soils in 1994 growing season ,.,.,., 45 Selected propcrtlcs ofSte, Rosalie,. Chicot and Ormsto\\'n soils 66 Correlation coefficients of mtrous oxide cmission rate (g N ha-l
h-I) with derutrificallon rates (gN ha-l d-l),. soil
M4-N.
NÛJ-N concentrations (kg Nha-I),N application rate (kg ha-l).and water filled porc spacc (WFPS, l7é) at four sites in 1996 gro\\'ingseasen ,.. ,.. , , , 67
Nitrous o:udc cmlSSlon as influenced by rotation, tillage systems and nilrogen fcnlhl.cr rates in 1994, 1995 and 1996 gro\\ing
seasons in Ormst()\\'n S<lll 68
Nitrous oxidc cmlSSlon as influenced by rotation, tillage systems and nitrogen fcnJlizer rates in 1994, 1995 and 1996 growing
TableA.
•
•
Table 4.5. Soil microbial biomass carbon (mg C kg-1), biomass nitrogen (mg N kg-1)and dissolvable organic carbon (mg C kg-1) as influenced by rotation, tillage systems and nitrogen fertilizer rates in Onnstown and Ste Rosalie (2) soUs (sampling on August 9 of
1996) '. 70
Table 4.6. Cumulative nitrous oxide emission and denitrification 1055 as
affected by nitrogen application rates in Ste. Rosalie (1) and Chicot soilsinthe growing season (from April 1 to November 15)
of 1995... 71 Table 4.7. Cwnulative nitrous oxide emission and denitrification loss as
affected by nitrogen application rates in Ste. Rosalie(1) and Chicot soils in the growing season (from April 1 to November 15) of
1996. 72
Nitrous oxide losses from continuous corn (eCCC), continuous soybean (SSSS), com-soybean rotation (CSCS, SCSC) and corn-soybean-alfalfa rotation (CSAC, SACS, ACSA) al three nitrogen
application ratesin 1994 growing season. 89
CHAPITRE 1
1
L'oxyde nitreux (N20) est produit principalement de façon naturelle par les micro-organismes du sol, au cours des processus de nitrification (Bremneret Blackmer 1981) et de dénitrification (Delwiche 1981). Son accumulation dans l'atmosphère contribue à l'effetde serre mais le N20 est également impliqué dans le processus de destruction de l'ozone stratosphérique (Crotzen 1981). Les activités agricoles seraient responsables de 70 à 90% de l'ensemble des émissions anthropiques de N20 (Duxbury 1994; Mosier
1994). L'azote(N)ainsiperdu se traduit également en pertes économiques.
Lespratiques agricoles influencent les flux de N20 en modifiant les différentes propriétés du sol. Plusieurs caractéristiques du sol comme la teneur en eau. la température, la teneur en NI-4+, enNOJ-et enCorganique ainsi que le pH affectent les actÎ\ités microbiennes de nitrification et de dénitrification. La plus grande disponibilité du N dans le sol, provenant soit de l'apport en fertilisants minéraux ou organiques, soit des plantes fixatrices d'azote ou de l'accélération de la minéralisation de l'azote organique, contribue à faire augmenter les émisSlons de N20. De plus, les méthodes de culture actuelles modifient les propriétés du solàdifférents degrés, selon leces. Larégie de la fenilisation azotée, la gestion des résidus. le type de travail du sol et les systèmes culturaux. par exemple. peuvent avoir un impact sur les émissions de N20 d'un même sol.
On estime actuellement que 0.15 à 1.25 tK de l'application de N sous forme d'engrais minéraux, est perdu sous fonne deNzO(OEOCIIPCCIlEA 19(5). Les quantitésémises. dén\'ées du N fixé biologiquement sont encore méconnues. Toutefois, l'introduction de légumineuses dans uncyclede rolauon3\'CCle maïs pourrait faire diminuer les émissions
de N20 en réduisant lesapparu en engrais azotés, comparativementà la monoculture de maïs.
Quant aux techniques de travail du sol, le semis direct permet l'accumulation de résidus de culture à la surface du sol, ce qui limite davantage l'évaporation de l'eau du sol comparativement au travail conventionnel. Ceci peut favoriser le processus de dénitrification et donc à faire augmenter les flux de N20 (Rice et Smith 1982).
Il importe donc dtévaluer les émissions de N20 des sol agricoles afin de déterminer si les systèmesculturau.~ont la capacité de limiter sa production.
1
CHAPITRE Il
REVUE DE LITTÉRATURE
Il
1
1
1. RÉACTIONS MICROBIENNES DANS LE SOL.
L'activité microbienne du sol est la principale source de N20, soit environ 6-8 Tg N2Q-N
an-} (Davidson 1991). C'est avant tout par voies biochimiques qu'il est produit, via la nitrification (Bremner et Blackmer1981)et la dénitrification (Del\\,che 1981).
1.1. La dénitrification
Cette série de réactions correspond à la dernière étape du cycle de l'azote, où le N fixé retournedansPatmosphère sous forme gazeuse,soit enNO, N20 ou N2.
La dénitrification s'effectue en conditions d'anaérobiose. L'absence d'~ comme agent oxydant permet à plusieurs types de bactéries hétérotrophes, dont celles du genre
PseudomonasetAlcaligenes (Paynes 1981) d'avoir recours au NO:J- comme accepteur final d'électrons. Les micro-organIsmes responsables de ces réactions utilisent des
hydr~les de C comme source d'électrons, qui seront oxydés en COz. L'azote du NÛJ-sera progressivement réduit, prodUIsant ainSI des gaz azotés d'état d'oxydation moindre, telsle NO(état d'oxydation duN =+2), leN20 (état d'oxydationdu N =+1)ct le N 2 (état
d'oxydatIon du N =0).
4(CH20) + 4N03- + 4H+ + 5 c-
--->
4COz
+ 2N20 + 6H20 5(CHZO) + 4NOJ- + 4H+ + 5 c.. ---..> SC02 + 1N2 + 7H20La suite de réactions csllaSUlvanle:
1NÛJ----> 1NO:!----> 2NO --->N20 ---> N2 etàchaque étape. des enzymes réductL'iCs sont impliquées.
Un autre processus non biologique peut produire du N20, soit la chémodénitrification où le NÛ2- entre en réaction a\·er: des composés organiques, pour former du N20. du N02
1
ou du N2. Le NÛJ- et le NÛ2- peuvent également réagir avec des composés inorganiques comme le
Fe2+
ou le Cu2+
et produire du N20 (Oranli et B0Ckman 1994).
1.2. Fa~teurs affectant la dénitrin~ation
Teneur en eau et enoxygène
Laprésence d'Û2dans le sol a pour effet de faire diminuer le tau."{de dénitrification, en inhibant l'enzyme responsable de la réduction du NOJ- enNÛ2-(Bryan 1981).
L'eau du sol affecte directement le processus de dénitrification puisque peu de micro-organismes peuvent se développer dans un sol sec. Deplus, l'eau et l'air se partagent les pores du sol de telle sorte que la teneur en Û2 diminue avec la teneur en eau. La diffusion de 1'Û2 dans la phase aqueuse est
lOS
fois plus lente que dans la phase gazeuse (Poth et Focht 1985). Ainsi, l'augmenlation de la teneur en eau du sol limite la diffusion d'Ûl, ce qui favorise le processus de dénitrification. Aulakh etal.(1991 b) ont mesuré des taux de dénitrification plus élevés dans des sols dont les pores étaient saturés à 90% d'eau, comparativementà6OCk.La proportion desgazN20 et N2 change a\'ec la teneur en eau du sol. Laproduction de N20 par dénitrification augmente lorsque le pourcentage de pores saturés d'eau passe de
55tk à 70fk. Au delà de 70fk. le N20 est transformé en N2 (Davidson 1991). La dénitrification cessera évcotuellementSile sol reste saturé d'eau pendant une trop longue période,parmanquedeNOJ·. Des taux élcvés de dénitrification ontété mesurés lorsque la teneur en eau du sol alternait cnlre élc\·éc ct faible (Smith et Patrick 1983).
Teneur en matière organique
Le processus ainsi que letau.~ de dénitrification sont intimement liés à la présence de C organique parce qu'il est la source d'électrons de la réaction (Rolston 1981). Le C organique peut également stimuler indirectement la dénitrification: les micro-organismes responsables de processus de minéralisation duC,consomment1'02 dusol et produisent du CÛ2,créantainsi des conditions d'anaérobiose.
Aulakh etal. (1991 a) ont montré que le taux de dénitrification provenant d'échantillons de sol amendés avec différents types de résidus était inversement proportionnel au rapport
C/N des résidus. Le N des résidus est davantagedisponible pour les micro-organismes lorsque le rapport C1N est inférieur à 20, alors qu'au-delà de 20 le N est immobilisé (Tisdale etal. 19(3).
Le taux de dénitrification est égaIement en assez bonne corrélation avec la teneur en C organique soluble du sol et PU!squcsadisponibilité varie spatialement. ceci peutexpliquer cn grande partie la vanabilité du taux de dénitrification (Granli etB0Ckman19(4).
L'appon en C tend à réduire le rappon N20/N2 par le processus de dénitrification (Sahr.l,,·al cl Keeney 1986). La relation entre la concentration en C et la production de N20 n'est toutefois pas directe. La production de N20 peut, peu après le début du processus de dénitrification.êtresupéncure à celle de N2, jusqu'à ce que l'enzyme N2~
réductase soit synthétisée par la progression des conditions d'anaérobiose, ce qui fa,·orisera la con"crsion du N20 en N2(Sahra"'at etKeeney 1986).
Teneur en NOJ·
Laconcentration de
NÛJ-
danslesol a un
effet variable sur letaux
de dénitrification. Enletau."(de dénitrification augmente avec la concentration deN~'" du sol (réaction d'ordre un, voir fig. l.1, section ascendante de la courbe pertes en N2 + N20). Par contre, lorsque la concentrationde NÛJ-atteintun certainniveau[seuilvariable selon les auteurs: supérieures à 10mgNÛJ--N" kg-1sol (EstaviUo et al. 1994), supérieures à 2S mg
NO.f-N· kg-1 sol (Limmer et Steele 1982)] le taux de dénitrification tend à rester constant
(réaction d'ordre zéro; voir fig. l.1, plateau de lacourbe pertes en N2 + N20). Ceci est principalement dQ au fait que leNO]-est un meilleur accepteur d'électrons que le N20et qu'il sera donc préférentiellement utilisé durant le processus de dénitrification, ce qui fera augmenter le rapportN20/N2(Blackmer et Bremner 1978). Ainsi, la réduction du N20
en N2est inhibéepardes teneurs en NÛJ- élevées, ce qui fait augmenter la production de N20, et diminuer la production deN2(fig. 1.1) (Sahra\\"at et Keeney (986).
Pertes enNpar dénitrification
....
... •...J'Crtes enN., ...-
-
...-...
-
..
tcneur cn NOj -N du sol
Figure 2.1. Schématisation de l'effet de la teneur en NÛJ- du sol sur les pertes cn N2 ct en N20pardénitrification. D'après Granli et B0Ckman ( (994).
Température et pH du sol
L'activité des micro-organismes responsables du processus de dénitrification dépend de la température sol. L'activité de dénitrification aété détectéeàune température minimale de -4·C (Dorland et Beauchamp 19(1). Toutefois, le taux de dénitrification augmente avec la température, jusqu'à des valeurs optimales situées entre 30 et 67·C. Le taux de dénitrification augmente également avec lepHjusqu'à une valeurde pH optimale entre 7 et8. Le rapport N20/N2 diminue cependant avec l'augmentation du pH, ce qui veut dire que l'influence dupHsur la production de N20 est complexe (GranlietB0Ckman 1994).
1.3. La nitrin~ation
Ladénitrification a longtemps été considérée comme étant la principale source de N20,
maisonrecoMait maintenantque lanitrificationpeutégalement contribuer àsaproduction (Bremner el Blackmer 1981).
Elle
peut représenter un mécanisme important de production de N20 comparau"cmcnt à la dénitrification, particulièrement dans les écosystèmesarides, là où les sols sonlplussouvent en conditions d'aérobiose (Mummey cl al. 1(93).Laprocessus de nitrific-.llion permetl'o~ydationdu
Nf4
+en N02- et ce dernier cn NÛJ-, pnnctpalemcnt par des orpnlsmcs autotrophes ainsi que par quelques organismes hétérotrophes (Bergstrom ct al. 1(94). L'éncrgie nécessaire àl'accomplissement de cesréactions est obtenueparlegaIn d'électrons lors de l'oxydation du NH4+enN~- et du N02-en N03- alors que le CO:! est utihsé parces micro-organismes comme source de C
(Bremneret Blackmer 1(81).
Laréaction sefaiten deux étapes. D'abor~ les micnrorganismes autotrophes du genre
Nf4+ + 1.502 - - - > NÛ2- + 2H+ + H20 +
6e-Lorsque la quantité d'oxygène est suffisante, et que le pH du sol est optimum (4.5à 10) leNÛ2- est aussitôt oxydé en NÛJ-
par
des bactéries du genreNitrobacter :NÛ2- + 1/2 02
--->
NÛJ- + '1e-La conversion du NÛ2- en NÛJ- se fait plus rapidement que celle du
Nl4+
en N02-' évitant ainsi des accumulations toxiques deN02-(Tisdale etal. 19(3).L'apparition du N20 au cours de la nitrification peut se produire de deux façons.
D'abord,Yoshida et Alexander(1970. 1971)ont été les premiersàdémontrer que le N20
pouvaitêtreproduitpar la bactérie Nitrosomonas europaea au cours de l'oxydation du NH~+ ou de l'hydroxylamine (NH20H) (fig.!.2, réactions a). Des composés azotés intermédiairescommeleNOHou N2Ü2H2. sont produits durant l'oxydation du
Nf4+
en NÛ2· ou pro\'enant directement du NÛ2· ct se décomposeraient chimiquement en N20(fig.1.2).
Goreau et al. (1980) ont pour leur part montré qu'à de faibles pressions partielles diO! (0.005-0.2 atm), le rapport N2O'NÜI- augmentait Poth ,~t Focht (1985) ont démontré
qU'à de faibles teneurs en Û2. le N02- peut être utilisé comme accepteurd'électrons par
NitrosomoffDS europaea1 produisantainsi du N20 (fig. 1.2,réactionsb).
1.4. Faeteun affectant la nltrlnc.tion
Teneur en alnnron;um
La disponibilité du
Nf4
+. provenant soit de la minéralisation du N organique ou de l'application de fertilisants est le principal facteur affectant le tau:< de nitrificationEtat d'oxydation: -3 -1 +1 +2 +3 +5 NH; - . NH,OH - . NOH
~
NO; • • NO,a
a
a~b
b / t J
NO
~b
N202H2
a~b
Figure 2.2. Représentation des différentes voies du processus de nitrification, menantàla production deN20.
NOH
=
nilroxyletN2Û2H2=acidehyponitreu.x,a
=
effectué par Nitrosonronas europaea au cours de l'oxydation de NI-4+ en
NÛ2-b
=
effectué parNitrosomonas europaea au cours de la réduction du NÜ2- ,(Fircstone et Da,'idson (989) ct donc la production de N20, Yoshida et Alexander (1970, (971) ont démontré que la quanUté de NzO produite par nitrification. augmentait avec la concentration du substrdt (N~+ ou NH20H). Blackmer ct al. (1980) ont
égalementnoté une augmentauon des émiSSions de N20avec la teneur en N"4+ Jusqu'à une teneur de l000J4g deNH.J+-N g.l sol. Au-delà de cette concentration, les émissions deN20ontdiminué. Bcrgstromctal,(1994) suggèrent que la production de N20 durant la nitrification peut être augmentée àla fois par Itappon de
Nf4+
et de glucose. Cedernier stimulerait la croissance ml\.Tobicnoc, réduisant ainsi la teneur en
02
et augmentant la production deCÛ2' Cc<., permettrait auNl4+
d'êtredavantage transfonné enN20,élantdOMéela baisse dum'-eau
d'02
(voir section suivante).Teneur en oxygène
La teneur en Ü2 influence à la fois le taux de nitrification et la production de N20.
Puisque le N20 est pnxluitàpanir du NÛ2- lorsque la teneur en Oz estlimitée~ la baisse d'Û2 dans le sol va faire augmenter le rapport NzO'NÛ2-. Goreau et al. (1980) ont mesuré unehaussede la production deN20 pardes bactériesNitrosomonas sp. de 0.002 àprès de 0.1 (mol N-(N20»/(mol N- (NOz-» lorsque la concentrationen
Oz
du milieu de culture passait de 7 à 0.18 mg 1-1. Cependant le processus de nitrification se fait en aérobiose et la baisse de la teneur en Û2 du sol limitera aussi l'oxydation duNl-4+
(Firestone et Davidson 1989). Ainsi~ la production de N20 par nitrification· reste donc difficile àévaluer.Te1l1pérature etpH du sol
Laproduction deNZOparnitrification augmente avec la température du sol (de IS à 3SOC)
(Yoshidaet Alexander (970). La température optimale des réactions de nitrification se sllue cntre2Set 3S·C (Granlict B0Ckman 1994).
LepH optimaldu processus de nitrificationparles organismes autotrophes varie de 7à 8 alors que la réaction cesse à un pH lnféneur à 4.5 (Granli et 80Ckman 1994). La '·ariationdu pH ne semble pasaffecter le rapport NZO'NO:f etdonc~ la quantité de N20 produiteparnitrificationdC"raJlaugrncnlcra"ec le pH. C'est ce que concluent Yoshida ct
Alexander (1970) qui ont mesuré une augmentation de la pnxluction de N20 par nitrification lorsque le pH pISsait dc 6à8. Certains organismes hétérotrophes peuvent également effectuer lanitnficatlonàdes pH inférieurs et sont ainsi plus souvent associées auxsolsforestiers acides(Grdllh ct 80Clman 19(4).
2. ASPECTS AGRONOMIQUES
2.1 Effet de la fertilisation
L'augmentation de la disponibilité du N pour les micro-organismes suiteàl'application de fertilisants azotés peut stimuler la nitrification et la dénitrification9 si tous les autres
facteurs sont à leur niveau optimal. Ainsi, on note généralement des flux de N20 peu après l'application de fertilisants, pendant une période d'environ six semaines. Après cette période9 le taux d'émission diminue jusqu'à un niveau minimal, indépendamment
de la quantité de N appliquée (Moisier 1994).
Quant aux fertilisants organiques. ds devront d'abord être minéralisés avant que le N
inorganique produise du N20 via la nitrification ou la dénitrification. Cependant, bien que le temps de réponse des micro-organismes diffère selon le typede fertilisant utilisé (minéral ou organique) les pcnes en N au cours d'une saison peuvent être aussi imponantes dans un cas comme dans l'autre (Estavillo et al. 1994). L'ajout de fertilisants organiques contnbueà faire augmenter la disponibilité en C organique pour les mlcro-organismes9ceqUI peut stimuler la dénitrification et la production de N20 par
rutnficauon etpardénitrification.
Le potentielde produclJon de N20 d'un sol agricole fertilisé sera donc plus élevé que celui d'unsol non culti\·é. Elchncr (19lXl) a comparé les résultats de différentes études où on avait mesuré les émiSSions de N20pro\~enantde sols fertilisés. Selon les résultats obtenus.les émissions mondiales annuelles de NzO, pour l'année 1984 imputables à la fertilisation azotée des sols, onl été de l'ordre de 0.2à2.1 Tg N2Q-N, sachant que de 0.5à 1.5%de l'azote appliqué au sol poU\'ait
etre
transformé en NzO. Cependant. des tnl\·au.~ récents (OECDIIPCC/I EA 1995) estiment plutôt les émissions globales de NzO à 63 Tg Nan-l,pourune consommation mondiale moyennede fertilisant de l'ordrede79Il
1
Tg N30-1. Dece total, 2.5 Tg Nan-Iproviennent directement des sols fertilisés, 1.7 Tg
Nan-1des systèmes de traitement des résidus animaux et enfin 2.1 Tg N an-1de sources
indirectes comme de la fixation photochimique, du lessivage, de l'érosion et des systèmes d'épurations. Cette même étude estime que de 1.25 à 2.25 % de l'azote appliqué sera directement émis sous fonne deN20.
2.2 Effet du travail du sol
Plusieurs études ont démontré que la production deN20ainsi que les pertes gazeuses de Npar le sol peuvent diminuer avec l'intensité du travail du sol. Ici, seul le travail conventionneldusol et le semis directneseront considérés.
Lacultureen semis direct laisse sur la surface du sol une couche de résidus de culture. Celle couche permet de limiterà la fois l'érosion ainsi que les pertes d'eau du sol par évaporation, comparativemcnt autra\"ai1con\'entionnel du sol (Tisdale et al. 19(3). Les agricuJteursytirent ainsi un bénéfice en réduisant du coup leur coOts de production et la peneparérosion de la partIe fende de leur sol. Or, il semble que le semis direct puisse également créer des conditions fa\'orables à la production de N20etàlapenede N du sol.
L'cau du sol limite ladiffu.~lon d'~ dans le sol ce qui crée des conditions d'anérobiosc propicesàla production de N20 par nitrification ou pardénitrification. Or, la présence de résidus de cultureàla surface du sol limite les pcrtes d'eau par évaporation. Les sols en semis direct peU\'eRt ainsi passer plus facilement en conditions d'anaérobiose avec un apport en eau inférieur à celui des sols travaillés (Hilton et al. 19(4). Le potentiel de production de N20 d'un sol en semis direct est donc plus éle\'é que celui d'un sol travaillé conventionnellement. C'est ce qu'ont observé Rice et Smith (1982) qui
1
concluent qu'en semis direct, ('activité de dénitrification plus élevée comparativement au travail conventionnel relève d'abord d'une plus grande teneur en eau du sol en semis direct.
On note également une plus grande densité de la surface du sol en semis direct comparativement au travail conventionnel (Pierce et aI. 19(4), ce qui peut nuire entre autre au développement racinaire en profondeur. Or.une densité plus grande du sol peut également limiter la diffusion de l'air dans le sol et ainsi entraîner la création de conditions d'anaérobiose. Ceci peut donc accroître la production de' N20 par dénitrification(AulakhetaI. 1984;Hilton etal. (994).
Les résidus de culture accumulés à la surface du sol en semis direct peuvent fournir au sol une plus grande quantité de substrat en C et ainsi stimuler davantage l'activité microbIenne (Groffman 1984). StaIeyet al. (1990), ont mesuré des émissions de N20 supérieures en semis direct. comparati\'cment au travail conventionnel. Ces auteurs suggèrent que la présence d'une plus grande quantité de C oxydable à la surface du sol cn semis direct peut enparueêtre responsable de cette différence.
Les nutriments ont également tendance à s'accumuler dans les couches superficielles d'un sol en semis direct (Pierce ctal. 19(4) ct la biomasse microbienne yest souvent plus élevée compmui\"cmcnt à un sol tra\-aillé (Aulakh 1984). Cette plus grande accessibilité des nutriments, dont le N Clic C,àune plus grande population microbienne
SitUéeprès de la surface du solpeUlaugmenterlaproductionde N20.
2.3 Effet de la rotation ~ultural~
Peu d'études peu,·ent conclure à un effet précis de larelation de culture sur la production de N20. Groffman ct al. (1987) croient que l'azote provenant des résidus de
1
légumineuses serait plus susceptible à la dénitrification que le Nprovenantde fertilisant synthétiques.
Par contre. Varvel (1994) a comparé l'effet de différents systèmes culturaux et de différents taux d'azote sur l'évolution des teneurs en C et en N d'un sol en travail conventionnel. Après 8ans de monoculture de maïs fertilisé au taux de ISO kg Nha-l, cet auteuramesuré une augmentation de0.75 g kg-l de la concentration enCtotal dans les 7.5 premiers cm du sol. La monoculture de soya a quant à elle, fait diminuer la concentration duC total de 0.15 kg ha-l . De plus les quantités de C et de N séquestrés dans les 15 premiers cm de sol ont augmenté avec la dose de N après 8 ans de monoculture de maïs, alors qu'elles ont diminué à des niveau.''< inférieurs à celles mesurées initialement en monoculture de soya(pertedeCet deN). Lespertes de Cet de N ont été moiDS importantes lorsque le soya et le maïs ont été cultivés en rotation. comparativement à la monoculture de soya. L'auteur conclue que l'augmentation de la fréquence du soya dans un cycle de rotation avec le maïs peut faire diminuer les concentrations de C et de N du sol.
AinSI, la présence de soya dans un cycle de roration avec le maïs pourrait réduire la disponibilité du C et le N pour lesmicf(~·organismes responsables de la dénitrification. el donc limiter la production de N20. De plus, les
appon
en fertilisants azotés pour une culture de légumineusesestgénéralementinférieureàceux pour la culturede mais, ce qui réduit égalementladisponiblhté enNpour les micro-organismes.3. HYPOTHÈSES
1. Les émissions de N20 augmentent avec les doses d'azote appliquées.
2. Les pratiques culturales favorisant l'accumulation de résidus en surface, comme le semis direct, favorisent la production de N20 comparativement au travail conventionnel du sol.
3. L'introduction de légumineusesdans un cycle de rotation a\'ec le maïs (e.g. maïs-soya ou maïs-luzerne) peut réduire les émissions de N20en diminuants les apports en fertilisantsazotés.
4. OBJECTIFS
1. Quantifier les émissions de N 20par les sols agricoles en semis direct et en tm\·ail con\·entionneletsoumisàdifférents systèmes culturaux: la monoculture du maïs ou du soya. la rotation mals-soya sur une période de deux années ou la rotation maïs-soya-luzerne sur une pénodc de trois ans ainsi qu'à différentes doses de fertilisants azotés.
CHAPITRE III
NITROUS OXIDE EMISSION AS AFFECTED BV TILLAGE, CORN·SOYBEAN·ALFALFA ROTATIONS AND NITROGEN
FERTILIZATION
1
1. AB8TRACT
Nitrous oxide (N20) produced from agricultural activities represents a threat to the ozone layerandeconomic lasses. Rates and magnitudes ofN20 emissions of cropping systems must he detennined ta establish corrective management procedures. In 1994, N20 emissions were detennined with corn and com-legume rotations. Continuous corn was studied on four soUs,m'Ofrom a long-term experiment, a Ste. Rosalie hea"y clay (Humic
Gleysol)and aChicot sandy (oam (Gray-Brown Luvisol), al0, 170, 285 and 400 kg N ha-l, and 1\\'0from a corn rotation study,
a
Ste. Rosalie clay (Humic Gley~o1)and an
Ormsto",n silty clay loam (Humic Gleysol). Treatments included no-till (NT) and con\'entional tillage (CT), monocultural corn (eCCe), monoculturaI soybean (SSSS); com-soybean(CSCS, SCSC);and soybean-com-alfalfa phased rotations (SACS, CSAC and ACSA). Nitrogen rates of 0.90,and ISOkg N ha-I for cornand 0, 20, and 40 kg N
ha-1forSSSS were used, and soybcanlalfalfa following corn no fertilizer N. Rates of N20 cmission were measured [rom c10scd chambers through the growing season. Emission rates varied from 1.1 g N ha-Ih- l to 19.7 g N ha-1 h-I. Maximum N20 cmlSSlon occurred with the canunuous corn or corn follo\\'ing soybean and ranged from
1.1108.S kg Nha-l, accounling for0.99 to1.1% of N added. Nitrous oxide emission Increascd with increascd soil walcr content, NOJ concentration and fertilizer N rates. Enusslon of N20 \\'as higher Wlth NT compared \\ith
cr,
and with corn compared to soybcanora1falfa.1
2. INTRODUCTION
Nitrous oxide (N20) May contribute ta global wanning (YuDg et al. 1976)9 and destruction of the ozone layer (Crutzen 1981). About70% ofthe N20 emitted from the biosphere atmosphere is derived [rom sail (Bouwman 1990)9andagriculture accounts for 90% of the total anthropogenic emissions ofN20 (Duxbury 1994). Reduction of these emissions will require information on cropping systemsand fertilizeruse.
Most N20 is naturally produced in soils
as an
intermediate product from microbial nitrification (Bremner and Blackmer 1981) and denitrification (Delwiche 1981). The magnitudes of N20 emissions From a sail are dependent on sail NH* and N03-N concentrations (Rolston 1981), water content (Aulakh etal. 1984), temperature (Manano et al. 1988),availableC (Rolston 1981),pH (Koskinen and Keeney 1982) andaeration(GroffmanandTiedje 1991), asweilastime of yearthe measurements were made (Cates and Keeney 1987). These propcrues depcnd not only on soil type, but also on agncul tural management.
Nltrogen fcrtilization of crops sucha.~corn (Zea ma)'s L.) will increase N20 cmission From the soi1by pro\·iding addilionai N (Mosler 1994). Inclusion of Icgumcs inlo cropplng systems couId reducc fcnJlll.cr Nrcquirements compared "·ith conlinuous corn (Scott ct al. 1987), and N20 cmlSSlon undcr legume-corn rotations might bc lower than under conunuous corn.
N~till soif management accumulatcs a mulch ofcrop residue on soil surfaces. This reduces e\·aporation and often rcsults in higher soil moisture contents. Higher denittification loss was rcponcd with NT than with
cr,
due to higher soil moisturecontents observed in NTsoils9not tillage perse(Mckenneyet aL 19(3). Thus. research
1
is neededtoquantify N20 emission rates inthefield as affectedbysoil properties and sail management such as tillage, crop rotation and N fertilization.
Our objective was to study N20 emission rates and seasonallosses as affected by soil type, no-till and conventional tillage, com-legume rotations, and N fertilizer rates under field conditions.
3. MATERIALS AND METROnS
3.1. Field experiments
Nitrous oxide emission and denitrification were determined in 1994, in(\\'0 experiments,
one with continuous corn on(\\'0soifs, and the second in\'olving crop rotation, tillage and
Nfertilization on two soils.
The continuous corn expcnmenl was inatlated in 1987 on aSte. Rosalie (1) heavy clay (Humic Gleysol) and in 1984 on a Chicot sandy loarn (Gray-Bro\\'o Lu\'isol)al the Emile A. LodsAgronomy Rescarch Center. Macdonald Campus of McGill University, Quebec, Canada (Liang andMacKenlJC 19(4). E~pcrimentaJdesign consisted of four N rates (0, 170,:!85 or 400 kg N hu·() IRarandoml1.cdcomplete black design \\lth four rcplications
(n
=
16). Ail N treatrncnts rcccl'"cd 170 kg N ha-l at planting, 28S kg N rates recci\'ed anadditional sidedress of 115 kg N ha'( ln late June~ and at the 400 kg N ha-1 ratc, addinonal 115 kg N ha-1\,-as apphcd ln both laie June and late July on 1994. Initial N
appllcauonwas asincorplratcd urca.\\1th sldcdressingasammoniumnitrate. High ratcs
of added N \\'ere used tocnsurema.~lmum yields. Plots were seeded in the first week of May,\\'jth corn ro"'s spaccd at O.75m. Each plot was7,5 bySm on Chicotsoitand 6.5 by 5 m on the Ste. Rosalic soil. Corn "'as normally harvested in the second \\'eek of Detober.
1
1
The rotation, tillage and N fertilizer experiment, established in 1991,was canied out on anOrmstown silty clay loam(HumieGleysol) near Ormstown, Quebecanda secondSte. Rosalie (2) clayon Ile Permt, Quebec (Table 3.1). Two tillage systems NT and
cr,
four rotations in seven phases [continuous corn, continuous soybean(Glycyne maxL.), corn-soybean 2-yr rotation, corn-soybean-corn-alfalfa(Medicago sativa L.)3-}T rotation and threelevels of fertilizer N (0, 90, or 180 kg N ha-1 for corn; 0, 20, or 40 kg N ha-1 for continuous soybean; and no fertilizer N for soybean and affalfa in rotation with corn] wereusedto provide42trealment combinatioDSwithtworeplicates(n
=
84). FertilizerN(ammonium nitrate 34-0-0) was broadcast on the sunace of each plot at the lime of seeding. Phosphorus (triple super phosphate0-46-0) was banded at 100 kg P20s ha-l
for corn and soybean. Potassium (muriate of potash 0-0-60) was broadcast at 180 kg K20 ha-1and80kgK
20 00-1for corn andsoybean,respectively.
Theexperiment was arranged in a split-split-plot design, with tillage as the main plot, rotations as the sub--plot, and fertilizcr N rates as the sub-sub plOL Each sub..sub plot \'·as 3 by 5m with four rows spaced al 0.75m. [n 1992 and 1993,conventionally tilled plars were cultivated ":ith 0.36 m Kongskildc mouldboard plough (Kongskilde, E:teter.
ON) to a dcpth of around 10 cm shortly after harvesting (fall-plow
primary
tillage) follo\\'OO by spring culti'"abon at a dcpth of0.10-15 m as secondary tillage, using a Tnple-K \ibra-shank cultl'·alor (Kongskilde, E:<eter, ON). No-lill plais were seeded directly into pre\·ious croprcslducs.Fcnilizers (ammonium nitrate. tnplc superphosphate with 39 kg P ha-l, and muriate of polaSh at ISO kg kha-I) "·cre broadcast on the soif surface and incorporated into soit by discing before seeding. Corn (c'". Funk 4120), soybean (cv. Maple Glen) and alfalfa
(C\.•Impact) were seeded on24Mayalthe rate about 80 000, SSO000 seeds ha-1and 20 kgha-l, respectively.
Nitrous onde emissionnU.~ from the experimental plots was monitored [rom end of April to end of October (weekly in May~ June; biwcekly in July~ August~ and once in September~ and October) following the procedure of Matthias et al. (1980). The chambcr was an open-bottom polyvinyl chloride(PVC)cylinder(102mm i.d. by150 mm height. The top of the chamber was fitted with a rubber septum attached with a 50 mm Tygon tubein the center for air sampling. The PVC cylinder was inserted into soil to 30 mm. After 1 h~ lo-mL air samplcs were taken using 10 mL polypropylenc disposable syringes. Any 10ss of N20 during the transportation and storage was calibrated \\ith standard N20 samples.
The N20 concentration was measurcd using a 5890 Series-II Hewlett-Packard gas chromalograph using a Tracor clectron 6.3Ni capture detector (He\\'lett-PackardCompany~
Avoodale, PA) in the constant current pulsed mode.
The rate of N20 emission pcr chambcr wa~ calcuIated from the folIo\\ing equation (Matthias ct al. 1980):
F
=
k(273/n( VIA )(dcldt) (1)whcrc F IS the rate of N~O Cmls."lon (g N2Q-N ha-1 h-1), k is a factor used for thc
con\'crsionof ppm of N20 loto kg N ha-1, T is the tcmpcrature of the air wlthln thc
chambcr(OK)9 V is the volumc of lhe air \\llhin the chambcr (cm3), A is the area of the soill'O\·crcdbythe chambcr (cm2), and dddt the mte ofchange in concentration of N20 in the atr \\ithin thechambcr(ppb\" N:!Oh-l ).
ACtersampling~soil moisture and tempcrature were measured. Soil samples were taken for the dctermination of bulk dcnsuy. moistul'C, and waler filled pore space (WFPS).
Water filled pore spaee was caleuIated using dry bulk density values, panicle density of 2.65 and volumetrie water content (Vomicil 1965). Soil NH4+and N03--N were extracted from oven-dry soil with 1 M KCland detenninedbythe procedure of Keeney and Nelson (1982).
Total N values fram N20 emission for each sampling period were calculated by multiplying N20 flux with tirne. Total N loss during the growing season was estimated as the sum of the NIasses ofsampling periods.
3.2. Statistical analyses
Statistical analyses were perfonned using analysis of variance (ANOVA) of log transfonned data using generallinear model (OLM) procedures of the SAS lnstitute Inc., (1985). Single degree-of-freedom contrasts were used ta compare the effect of rotations, tillage, and ratation-by-tillageinteractions, and orthogonal polynomial trend comparisons to compare fertilizer N rates in each tillage or rotation. Pearson correlation and regression values were used to detennine relationships of denitrification with N20 emissio~ sail tcmperature.. moisture.. soil NH4 --N.. NOf...N and N fertilizer rates.
4. RESULTS
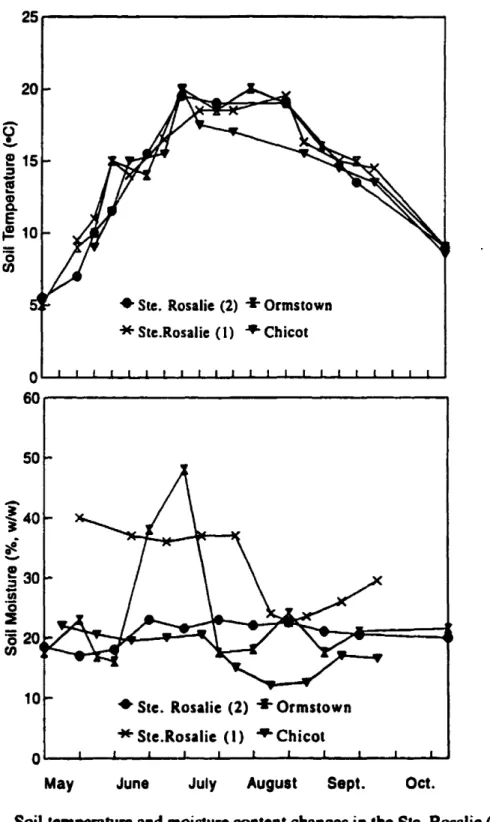
Soil temperatures were similaralail sites.but moisture contentwas generally lowest at the Chicot site, intennediate at the Onnsto\\n and Ste. Rosalie (2) sites and highest at theSte. Rosalie (1) site (Fig. 3.1). Soil moisture at the Onnstown site was variable during the growing season, probably due to field observations of perched water tables after precipitation. Moisture content was higher in the NT plots thaninthe
cr
plots at both the Onnstown and Ste. Rosalie (2) sites in the June to July period (data not shown). Temperaturestended ta he unaffected by tillagepractices.1
1
4.1. Nitrous Oxide Emission Rates
Nitraus oxide emission rates \vere subject ta temporal variability (Fig. 3.2). Emission tendedtaaccur inseparated peak periods largely in the spring andearly summer,and it was during these periods that treatment differences due to N fertilization, tillage managementand soil moisture content were Most pronounced (Figs. 3.2, 33a,b, and 2.4).
Com-Iegunle rotation expennzent
lnthe com-legume rotation experiment, maximumN20 emission fluxes rangea from 0.5 to 0.9g N ha-1h-1albath sites al the endofApril, with a smalt increaseto 1.7 g N ha-1
h-I in mid-May in the Ste. Rosalie (2) site (Figures 3.2, 3.3 and 3.4). After N
fcnilization, ma.~mum N20 emission rates increased to 8.4 g N ha-I h-I for corn follo\\Oing soybean al the Ormstown site; and2.8gN ha-1h-Ifor the Ste. Rosalie (2) site (Figs. 3.2, 33a,b,and 3.4). In late July fluxes decreased ta as low as 0.1 g N ha-1h-I, andremained neac this level for thc rcst of the season.
Nllrous axide emission rates wcrc hlghcr at theOrmstownsite thanatthe Ste Rosalie(2) sllc. Differences, however. \\'crc minima! in early spring and late faU when sail lcmpcraturcwas lo\\"«12 OC) (Fig. 3.:!).
Tillage effccts on N20 emlSSIon nU\CS wcre noted al varied periods with NT always grcater Iban
cr
for bothsites. Slgmflcanldifferencestended tobefound inearly ta mid-Mayalthe Ste.Rosalie (2)andcarly June to mid-July atOrmstown(Fig.3.2).Thcrc were nosignificant diffcrenccsamong rotation trealments in N20 emissionrates al the Ormsto"·n site prior toNfertilizer applications (Fig.3.3~b). At bath the Ste. Rosalie (2) and Ormsto\\"o siles during peak emissions. com following soybean had bigher
emission rates than continuous soybean, with alfalfa the lowest emission. Comparisons among the corn plots showed that emission rates ",'ere similar regardIess of previous crop (Fig. 33b). Emission rates were affected by added N rates (Fig. 3.4) when a\'eraged over aIl rotations. Rates of emission increased as fertilizerN rates increased, pnmarily \vith corn plots but only when there were peak emissions (Figs. 3.4 and 3.5). T\\'o
peaksofN20 emission were found al the continuous corn sites (Fig.3.5). Followingthe
initialaddition ofNfertilizer,N20 cmission increased with increasing Nin late May. In lateJune, fluxes increased inail trcalments and reached 2.6 to 6.7 g N ha-1h-1• These peaks lasted about 2 wk and were related ta rates of added N. Auxes \\'cré low from August ta end of October, with no differences amongNlevels.
In soybean or affalfa plots recci\lng 10"' N rates or rel)ing on residual fenilizer N,
incrcases in emission with added N wcrc generally small and not significant.
Carre/arion ofNzOemission rares and soi1attributes
Emission of N20 "'as corrclatcd \\llh NH~-N (except Chicot soil); N03-N (exccpt Ormslown soil); WFPS [except Ste. Rosalie C!») tcmpcrature [except Ste. Rosalie (1) and
Ormslown soils) and wüh N fcrtihzcr ratcs in Chicot and Ste. Rosalie (1) sites (Table 3.2).
4.2. Total N losses from NIO emission
ln the com·lcgume rotation c'pcnmcnt. total seasonal N20 emissions werc significanlJy affecœdby tillage and rolaUon lrCalmcnLfitat both Ste. Rosalie (2) and Ormstown sites. and byN application rate al theOrm~to\\n site (Table 33). Interactions bcl\\'ccn rOlation and N rate, among tillage, rotation and N rates \\'ere found at the Ste. Rosalie (2) site,
\\·hile al the OrmstO\\'n site, signifiant interactions were round bet\\'een tillage and
rotation.andtillageandN fcnilizer rate. 37
Total seasonal N20 emissionwas greaterattheOrmstown site than altheSte. Rosalie (2) site, and greater for NT plots than
cr
plots, allhough al the Ormstown site the greater lasseswithNTwere found in corn plots ooly (Table3.4). Continuous corn plots had the highest emission rates which increased with added N, and affalfa plots had the lowest emission rates (Table3.4). Withcontinuous soybeanatSte. Rosalie (2), emissions were aquadratic function of addedN, with greatest lasses of 8.2% al 20 kg ha-1added N, decreasing to0al40 kg Nha-Io Withcornfollo\\'ing soybean plots at the Ormstown site, there was alinear response of emlssion to added N (Table 3.4), equivalent to 2.1% ofaddedN.
Emission was related to addedN as follows:
Ormstown sile, corn after soybean
N20-N
=
2.34+0.021NSte. Rosalie(2)site. continuous so)'bean
R2:0.99*
R2:0.99*
1
whcrc: N20
=
N20 cmlSSlon (kg N2Q-N ha-Iscason-l)and N=
N fenilizer rate(kgNha-1)0
TOIaI cmission from corn followlng alfalfa did not change \\ith added N, and emission with soybean or alfalfa did not change \\otth residual N from previous crops.
1
Ineontinuous cornplots from ail sites, total N lossesthroughN20 emission wereIinearly related to added fertilizer N, and emission values were hem'een 0.99 and 1.3% of fertilizer N (Fig. 3.6),
5. DISCUSSION
Emission rateswere variable,bUlhighestrates wereassociated with N fertilizer additions
combined with warming soils andhighwater contents, [nereases in N20 emission fluxes at orduring soil freeze-tha\\' periods have been noted by Burton and Beauchamp (1994) as a result of release of trapped gases upen thawingof the soil. Cbristensen and Tieje ( 1990)concluded that thesepeakswcre due to warming of saturated sails, and enhanced
microbial activity.
Higher N20emissian fluxes foundduring the June period were enhanced by N fertilizer applied ta the carn plots, The high N20 emission from corn plots compared with
soybcan and aJfaJfa and the ancreascd cmission \Vith increased fertilizer Nwith corn was largely relatcd ta incrcascd N03' Ic\"cls. Nitrogen fenilizer could stimulate soi1 mtrification and denitrificaUon,WhlChresults in the production of N20. However, N20
emlSSlon was related to WFPS ln thrce of the four soils, with temperature being corrclated less strongly in two sotls only. 80th NH4and NÛJ le\'els were related to N20 emission in three of four sitcs. and thus fcnilizer N rates would be expected to combine with high water contents to cnhanl'C cmlsslon rates in the spring. This pattern of N20 emission "'as noted in Saskatchewan by \'an Kessel et al. (1993) who found that dcnitrification was related closely 10hydrologie processes and landscape. as weil as ta
soil NH~and N03le\'els.
In continuous corn plots differences in cumulative emission were related to background emission levels at rates of increase of emission with added N were similar among the sites. Initial emission lasses were related ta texture, with the higher clay soils (Ste. Rosalie) having the lowest initial lasses, and the lowest clay soil, Chicot, having the highest initial emission rates. Sail having higher clay contents \vould have higher soil moisture, moderating sail temperature. The Ste. Rosalie soils had higher N~ levels indicating less active nitrification, and this couldMeanlessN20 emission.
Higher seasonal N20 emission losses in NT treatments compared with
cr
with cornmight he related ta increased soil moisture and temperature with NT and higher soil minerai N with fertil ization. StaIey el al. (1990) round that the NT treatment increased denitrification activity when compared \\ith CT. They speculated that a contributing factor causingthedifferencewas thepresence of a greater amount of oxidizable C in the surface soils underNTconditions. Howcver, no significant difference was round in the water soluble C contents bet\"eenthe NT and
cr
treatments in either Ste. Rosalie (2) or Ormstown sites (data not sho\\'n).Talai cmlSSlon losses from cropplng systems in the growing season werc cn\lronmenlally important alS.5 kg Nha-1al high N (400 kg Nha-I) rates, 4.7 kg N in continuous corn (180 kg Nha'I). 6.1 wllh com-soybean rotation and 3.8 kg N \\'ith the com-soybcan-alfalfa rotation. Lussesa'\a percent of added N ranged "idely from 0 to
8.2tk, but lhere was sorne conslslcncy among crops. Losses of 0.99 ta l.3tft-of added N
in continuous corn wcre bct\\'ccn the \'alues of 0 la 2.1% found in corn follo\\lng
soybcan. These values were "lthln the range of those reported by Eichner (1990). Emission relatedtoresidual N fmm corn in soybean or alfalfa residues seems ta be low or absent so lbat emission from fcrtilizcr N "ilb these crops is minimal. [n contrasl, continuoussoybeanlosses as rclated to fertilizer addition were \'ariable alO 108.2%, but
these values should he used with caution. Combining all the corn emission values, a 13% loss from fertilizer N emerges, which is similar ta values reported by Echner (1990). Our results sbould he restricted to urea or ammonium nitrate incorporated before planting or to ammonium nitrate broadcast applications.
Generally, corn N fertilization played a major role in N20 emission in agricultural production,especiaJly under NT, and reduced fertilization of corn would result in reduced emissions. A corn system using CT and legumes or other crops in rotation could reduce N fertilizer and decrease N20 emission from agricultural fields.
1
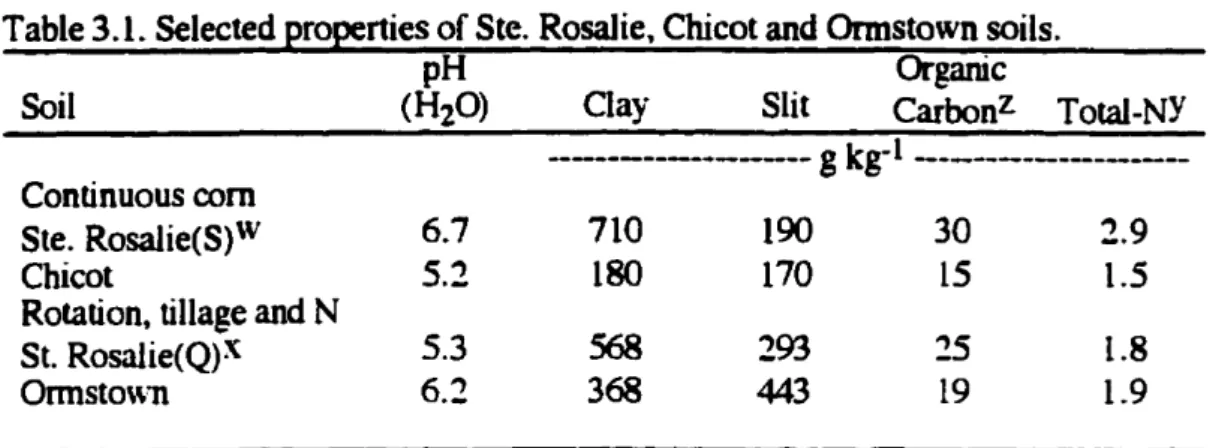
Table 3.1. Selected properties of Ste. Rosalie,ChicotandOrmstown soils.
pH Organic
Soil (H20) Clay Slit Carbonz Total-NY
--- g kg-1 ---Continuous corn
Ste.Rosalie(S)W 6.7 710 190 30
2.9
Chicot
5.2
180 170L5
1.5Rotation, tillage and N
St. Rosalie(Q)X
5.3
568293
25 1.8Ormsto\\ll 6.2 368 443
L9
1.9
Z Walkley-Black procedure (Nelson andSommers, 1982).
y H2S04-CuS04Kjeldhl digestion method (Bremner,1965). x Soil from Quinn Farm.
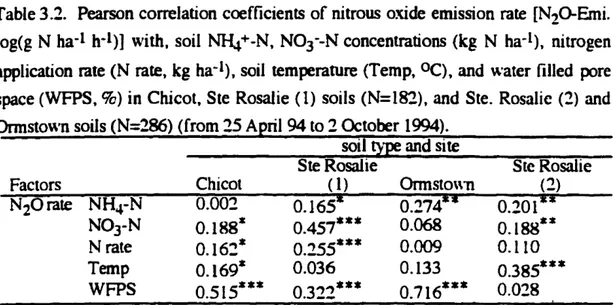
Table3.2. Pearson correlation coefficients of nitrous oxide emission rate [N2Q-Emi. log(g N ha-1h-1)] with, soil N}4+-N, N0
3--Nconcentrations (kg N ha-Il, nitrogen application mte (N rate, kgha-I), soil temperature (Temp, OC), and \\'ater filled pore space(WFPS, %) in Chicot, Ste Rosalie(1) soils (N=l82), and Ste. Rosalie (2) and Onnsto"'n soils(N=286)(from25April 94to2October19(4).
soiltypeand site Factors NH4-N N03-N Nrate Temp WFPS Chicot 0.002 0.188* 0.16~* 0.169* 0.515*** SteRosalie (1) 0.1651 0.457*** 0.255*** 0.036 0.322*** Onnslo\\'D 0.2741i 0.068 0.009 0.133 0.716*** SteRosalie (2) 0.201l i 0.188** 0.110 0.385*** 0.028
*.
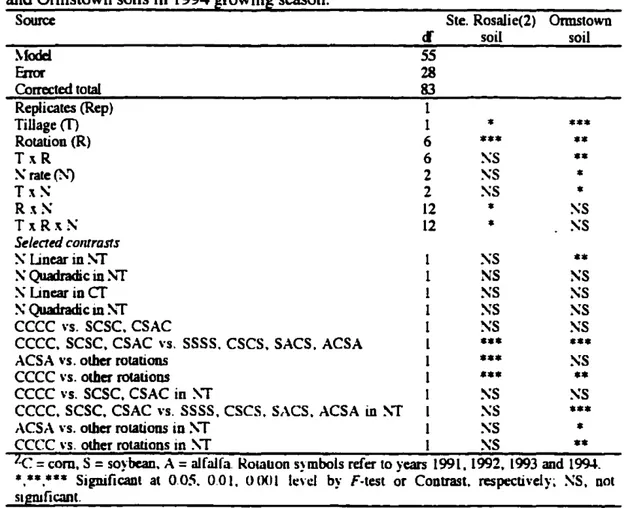
** and ***SignificantalP=0.05. P=O.OI andP=O.OOllevel, respectivel}'.Table 33. Results of ANOVA on cumulative nitrous oxide emission losses as influenced by rotation, tillage systems and nitrogen fenilizer rates in Ste. Rosalie (2) and Ormstown soils in 1994 growing season.
Source ~Iodcl Fnor Corrccted total cf 5S 28 83
Ste. Rosalie(2) Ormstown
soil soil
*
*
** ** *** SS :\S **
*
*** 1 1 6 6 2 2 12 12 Replicates (Rep) Tillagem
Rotation(R) TxR ~raleC'J Tx~ Rx~ TxRx!': Selecred contraSfs ~linearin~T 1 ~S**
~Quadradicin~ï 1 NS ~S :\ linear incr
1 ~S ~S :\ Quadradicin~ï 1 ~S SS ecce \·s. scsc. eSAC 1 ~s SSeecc. SCSC. CSAC \·s. SSSS. CSCS. SACS. ACSA 1
***
***
AeSA
\'s.other rotations 1***
SSeccc\·s. other rotations 1
***
••
ecce
vs. SCSC, CSAC in ~T 1 SS SSecce, sesc.
CSAC \'5. SSSS, CSCS, SACS. ACSA in ~T 1 ~S***
ACSr\\'5.olherrotations in~T 1 SS
*
ecce
\'s. other rotations in ~T 1 SS**
'-<:
=
corn, S=
soybean.A
=
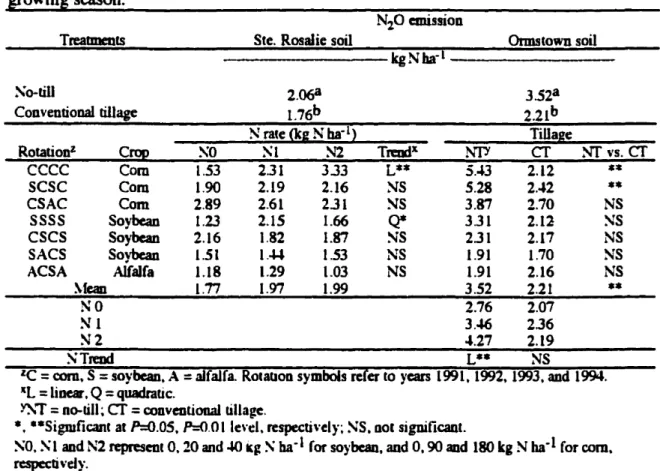
alfaJfa. ROlallOns~'mbo1s reCer to)'ears 1991. 1992, 1993 and lm,. *.*.,*.- Signïficanl al 0,05. 0,01. 0001 lt:n:l by F·lesl or CODtrast. respecli\'el}'~ SS, DotTable 3.4. Cumulative nitrous oxide emission lasses as influencedby rotation. tillage systems and nitrogen fertilizer rates in Ste. Rosalie (2) and Ormstown soils in 1994 gro\\'ing seasOD.
NZO emission
TreabDeDlS Ste. Rosalie soil Ormstown soil kgNba-i
So-till 2.068 3.528
Conventional tillage 1.76b 2.21b
N rate<kgNha-1) Tillage
Rotationz Crop ~o SI S2 Tn:odx ~".
cr
NI'vs.cr
ecce Com 1.53 2.31 3.33 L** 5.*3 2.12
**
SCSC Com 1.90 2.19 2.16 NS 5.28 2..J2 ** eSAC Com 2.89 2.61 2.31 NS 3.87 2.70 NS SSSS Soybean 1.23 2.15 1.66 Q* 331 2.12 SS eses Soybean 2.16 1.82 1.87 SS 2.31 2.17 NS SACS Soybean 1.51 1.014 1.53 NS 1.91 1.70 NS ACSA Alfalfa 1.18 1.29 1.03 NS 1.91 2.16 NS ~feao 1.77 1.97 1.99 3.52 2.21 ** NO 2.76 2.07 SI 3.46 2.36 N2 .J.27 2.19 STreod L** NSle
=
corn. S=
soybcan. A=
alfalfa. Rotation symbolsreeerto years 1991. 1992. 1993.and1994.tl
=
linear.Q=
quadratic.~,.
=
no-till;cr
=coDventiooa1 tillage.1
*. ··SigmficantatP=O.OS.,0=<>.01 le",:I.respecti\'el)'~ SS.Dot significaot.so.
~1 and N2 repre5ent0.20and.wkg~ba-1 forso~·bcan. andO.90 and ISO kg Nba-1forcom. respectivd)·.25---ë (J)
• Ste. Rosalie (2)
+
Ormstown*
Ste.Rosalie (1) ... ChicotOL....l--L...""""-..L....I~-...-...L_.Io..."""""_~"__IIo""""I,, _a...L._~
60---..-,
~40
Jai
-
~ 30en
ë 2 020 (J)• Ste. Rosalie (2)
+
Ormslown'*
Ste.Rosalie (1) ... ChicotOct. July August Sept.
June
OL.----\.-"""---lL...~_ ..."Io-...- ...- ...-~
May
Figure3.1. Soil temperature and moisture content changes in the Ste. Rosalie (1), (2), Chicot, and Ormstown sites in the 1994
sm\\;ng
season.10.0,..---...,
A. Ormltown Site ..., 11: CT cultlva'ed "a, 31: fenillzed
B. Ste. Ro••
ne
(2) Site-
·
J: 1-.e Z ca-
•
•
..
•
2.0 CI: c 0..
.! E III 0 • Z O.OL....Ao...- -...- - - - -...- ...&.-~--...u.,
June Jul, Augu.t Sepl. Oct.Figure 3.2. Nittous oxide emission rates from NT and CT in Onnstown and Ste. Rosalie
(2)sites inthe 1994 gfo\\'ing season. (Standard errer shownbybar).
10.0---...
A. Onnltown Site
8.0
2.0
May June Jul, Auguat Sept. Oct.
Fig. 3.3(a). Nitrous oxide emission rates from continuous soybean (SSSS), soybean-c:om rotation (SCSC) and alfalfa-com-soybean rOlation (ACSA) in Ormstown and Sie. Rosalie (1) sites in the 1994 growing season (Standard enor shown by bar).
10.0.---..
A. OnnatownSite 6.0··-ecce
.SCSC 4.0,
"·CSAC-
~,
~ .â: ~ \ ~z
2.0,
al-
•
•
-
•
0.0a:
c: 4.0 0B. Ste. Ao••lle (2) Site
•
.!e
May 16: CT cultivated lU May 31: fertflized 0.
3.0z
2.0June July lugu•• Sept. Oct.
Fig. 3.3(b). Nitrous olide emission raies from conlinuous corn (CCCC). soybean-com rotation (SCSC) and com-soybean-alfalfa rolation (CSAC) in Ormslown and Ste. Rosalie (2) sites in the 1994 growing seasan (Standard error shawn by bar).
sn.
May 16: CTeuillvaied May 31: fertilized 2.5 2.0 0.0 "--"-'-...~.-...-..-'-I...-"-...~...~May June Juy Auguat Sept. Oct.
0.5 1.5 1.0 p
..
.t: Z al-
•
•
•
a:0.0
L...-!E::::f~...:~._.._...Je~~~=_=:t::I:::::c:~..J c o 3.0---ii•
ë
lUo
•z
1
Fig. 3.4. Nitrous oxide emission rates as affected by nitrogen rate in Onnstown and Ste. Rosalie (2) sites in the 1994 Irowing season. NO.NI.N2
=
0.20.40 kg N ha'· for soybean. and 0.90.180 kg N ha-· for corn (Standard error shown by bar).Oct.
Sept.
10
N1-3 N2-3 A. Ste Ao••". Soli
e
•
•
6 • NO (0"'JI".
H) . . N' (170IIg'''.
H) '6'N'l ('M5Ir.'".
")1
4 '9-NS (400 1Ig.'''. ").c
2as
~z 0May Jun. July Aug. S.pt. Oet.
a fi 25
..
8. Chicot 5011 ~ 0 t'li ZSampllng tlme
Figure3.5. Nitrous o~ide cmission rates from monoculture corn fields as affected by
nitrogen rates inSte.Rosalie (1) and Chicot sites in the 1994 growing
season.
(NI·3
=
170kgN ha-I for NI, N2and N3 plors; N2·3=
115 kg Nha-I for N2and N3;N3
=
115 kg N ha·1for N3 plors.(Standard error sho\\'obybar).
10 - - - ,
8
6
4
-
..
ca
2
~
Chicot .=3.5, b=O.013 Rl=O.9S·· Ormatown ••2.91, baO.010 RI=O ..99··"
Ste.Ao••lle (2) _=1.45, b=O.0099 R'=O.91··"
Ste.Rosane (1) Â • •1..14,b:.012 fII.O.7.·· 0~----~---T---r----__1o
100
200
300
Added N (kglha)400
500
1
Figure3.6. Emission of nitrous oxide from continuous corn fertilized with nitrogen on four soils in 1994.