HAL Id: hal-00470387
https://hal.archives-ouvertes.fr/hal-00470387
Submitted on 6 Apr 2010HAL is a multi-disciplinary open access
archive for the deposit and dissemination of sci-entific research documents, whether they are pub-lished or not. The documents may come from teaching and research institutions in France or abroad, or from public or private research centers.
L’archive ouverte pluridisciplinaire HAL, est destinée au dépôt et à la diffusion de documents scientifiques de niveau recherche, publiés ou non, émanant des établissements d’enseignement et de recherche français ou étrangers, des laboratoires publics ou privés.
Critical knowledge map as a decision tool for knowledge
transfer actions
Jean-Louis Ermine, Imed Boughzala, Thierno Tounkara
To cite this version:
Jean-Louis Ermine, Imed Boughzala, Thierno Tounkara. Critical knowledge map as a decision tool for knowledge transfer actions. Electronic Journal of Knowledge Management, Academic Conferences and Publishing International, 2006, 4 (2), pp.129-140. �hal-00470387�
ISSN 1479-4411 1 ©Academic Conferences Ltd
Transfer Actions
Jean-Louis Ermine, Imed Boughzala and Thierno Tounkara National Institute of Telecommunications, France
[email protected] [email protected] [email protected]
Abstract: Knowledge transfer is no longer reducible to classical solutions such as face-to-face training, technical
education or tutoring. Knowledge to be transferred is professional knowledge (Business Knowledge). It involves the whole Knowledge Capital within an organization. Identifying the knowledge components that are worthwhile transferring is not an easy task. This is the problem addressed in this paper.
Keywords: knowledge transfer, knowledge management, knowledge mapping, and knowledge capitalization.
1. Introduction
1.1 Knowledge management for knowledge transfer
Knowledge Management has been defined as the setting up of a management system of cognitive flows, which allow all the components of an organization to use and enrich its corporate knowledge. Therefore, Knowledge Management allows knowledge in the firm to be located, formalized, shared, enriched and developed specifically knowledge with critical and strategic characteristics (Boughzala and Ermine 2004, Ermine 2002). The aim is to stimulate innovation and the creation through a better productivity of knowledge. A very serious problem is now growing in industrial countries: ageing of professional generations. This is a global problem but Knowledge Management focuses on some important aspects:
How to identify critical knowledge that is worthwhile transferring to new professional generations
How to capitalize and transfer professional knowledge from one generation to another.
In this paper we deal with the first question of identifying valuable knowledge in a company. We give a case study of knowledge capital analysis performed in the Hydro Québec Company, in order to have a clear plan of transferring knowledge between generations. Identifying valuable knowledge is the beginning of the solution, implementing devices for knowledge transfer is the next step, but that is another (long!) story.
1.2 Cartography of knowledge
Knowledge cartography (or knowledge mapping) allows the value of the firm’s critical knowledge to
be enhanced (Pachulski & al 2000, Saad & al 2003). It is a step to be performed before any operation of knowledge management. Cartography is an identification of the corporate knowledge. We refer to the definition of knowledge cartography given by (Speel & al 1999): “knowledge mapping is defined as the process, methods and tools for analyzing knowledge areas in order to discover features or meaning and to visualize them in a comprehensive, transparent form such that the business-relevant features are clearly highlighted”. Companies wishing to manage their corporate knowledge must make a precise analysis in order to determine the knowledge they must preserve, develop, abandon etc. Thus, cartography becomes a decision support tool. To this end, there is a need to establish specific criteria in order to evaluate, in the cartography, the most critical knowledge for the company. This is the so-called “cartography of critical knowledge”. It is such an analysis tool that we describe here. The M3C methodology described here is the result of various experiences (we describe one of them in this paper) and issues developed in a working group of the Knowledge Management Club (www.club-gc.asso.fr) (Aubertin & al 2003).
1.3 Content of the paper
The paper begins by giving an overview of existing knowledge mapping methods and by underlining the contribution of the M3C methodology. Then, we present a case study performed in The Hydro Quebec Company. Our goal is, using this case, to describe and to illustrate our “methodology of construction of the critical knowledge cartography” (cf. §4).
Electronic Journal of Knowledge Management Volume 4 Issue 2 2006 (129-140)
2. About knowledge mapping
methods
Knowledge cartography helps to discover the location, value and use of organizational knowledge in the sense of (Tshuchiya 1993). It is a new research field in knowledge management and there are few academic papers. Knowledge mapping methods can be categorized into two approaches:
• A “ Process” oriented approach
This approach deals with knowledge cartography methods, which use modeling, description and analysis of business processes to determine critical knowledge.
• A “ Domain” oriented approach
In this approach, we try to make an analysis from a mass of information in order to organize it in logic different from the functional approach. In fact, the goal is to ignore the functional structure of the firm, grouping activities into knowledge domains. This task demands an important capacity of analysis because it’s not a natural process.
2.1 GAMETH
GAMETH (Global Analysis METHodology) is an approach focusing on business processes that connects knowledge to action (Grundstein & al 2003).
GAMETH includes three main stages i.e. those presenting problems:
Identifying the sensitive process; Identifying the determining problems; Identifying the crucial knowledge.
The first stage of the GAMETH approach consists in determining the sensitive processes. A sensitive process presents the stakes, which are collectively recognized by those involved. Independent of the company’s stakes, this process presents its own stakes and includes activities. The constraints and the dysfunction of these activities give rise to problems, which can weaken them and endanger the process they belong to. A risk assessment, carried out for the sensitive process, allows the critical activities to be determined. The problems connected to these activities are called “determining problems”. Identifying them constitute the second stage of the GAMETH approach. Some of them can be solved easily by eliminating some constraints. The other ones lead to the knowledge necessary to their resolution. According to the value of this knowledge with regard to its vulnerability (scarcity, accessibility, cost and delay of acquisition) and to its influence on the company’s life, markets and strategy, this knowledge can be identified as
“crucial knowledge”. Identifying crucial knowledge constitutes the third and last stage of the GAMETH approach.
2.2 The method proposed by Tseng and Huang
Tseng and Huang (Tseng and Huang 2005) propose a cartography method to determine crucial knowledge necessary for the design of a knowledge management system. The authors define “crucial knowledge” as: "the necessary knowledge to solve problems dealing with a given objective, and that should be capitalized ". Their approach is "process" oriented and is guided by problems. It is based on a quantitative analysis of collected information while interviewing some experts. Different acquisition techniques are used (DELPHI, NGT, etc.) to collect and classify the needs in knowledge for the problem solving. Tseng and Huang propose an algorithmic procedure from the data collected to determine four sets characterizing the importance of knowledge:
Set I (Vital knowledge): this type of knowledge is very important and should be located. Set II (The prompt acquisition knowledge set):
this knowledge set is important for some problems.
Set III (Seasonal knowledge): the seasonal knowledge set is not important for the majority of the problems.
Set IV (Insignificant knowledge): this category of knowledge is not collected and no action is recommended unless there is a special need.
2.3 A method for the evaluation of tacit and/or explicit knowledge
Pomian and Roche propose evaluating the corporate knowledge by distinguishing between tacit and explicit knowledge (Pomian and Roche 2002).
Here, we present the criteria they use to analyze tacit and explicit knowledge:
Criteria of analysis for tacit knowledge The principle of analysis consists in
mixing the survey of the knowledge vulnerability with the criteria linked to their utility and their re-usability.
Criteria of analysis for explicit knowledge Pomian and Roche consider that most explicit knowledge is contained in available documents. The stake of the analysis consists in ensuring the quality of documentary communication. Thus, they propose four criteria for documents analysis: legibility, clarity, relevance and accessibility. However, the authors don't propose a method to identify and collect knowledge. They consider that
the" operational manager" is able to draw up a list of the knowledge to be evaluated.
2.4 Knowledge trees
The goal of knowledge trees is to provide a cartographic representation of the knowledge considered as an element of the "human capital" for an organization (Authier and Lévy 1992). Knowledge trees are the expression and the consequence, evolving in real time, of training courses and experiences of all members of a given community. The underlying principles of their development are mathematical, philosophical and sociological. The creation of these knowledge trees can guide and sustain knowledge transfer.
2.5 Contribution of the M3C methodology
M3C is based on a «process” oriented approach. The cartography and the evaluation of knowledge domains are based on knowledge acquisition from experts. Thus, M3C is also a knowledge engineering method and it completes other methods used for the modeling of descriptive and operational knowledge of an expert (Tounkara & al 2002). M3C relies on robust models, which have been performed in industrial research centers and also in industrial operational units (GTIE group, Schindler, DGA, PSA Peugeot Citroën, etc.). A formal and a graphic model characterize the cartography model we propose.
2.5.1 The formal model of the cartography
The formal model described in a UML class diagram is a hierarchical representation that classifies the knowledge domains of the firm in several levels. A knowledge domain can be
defined as a field of activity of a group of people from whom information and knowledge can be gathered. The central point of the cartography is the core activity or “core knowledge” which corresponds to the strategic knowledge capital, corresponding to its fundamental mission. Around this central point are the knowledge axes, which define the strategic domains of knowledge, often corresponding to the different detailed missions of the organization. The final knowledge domains in the classification are grouped according to a common finality on the same theme of knowledge, along the knowledge axes. According to the precision required, a domain can be divided into sub-domains and a theme into sub-themes.
2.5.2 The graphic model
The graphic representation of the knowledge cartography is based on the principle of visualization, which makes navigation easier and gives a global view of the knowledge domains in the firm. For example, the choice of an Ishikawa diagram allows the presentation of the hierarchy of different levels in the form of branches starting from the common trunk (Aubertin & al 2003). A tool of cartographic representation (Mind Manager, for example) can also be used. It can also be interesting to point out on the map the source of the knowledge that is the name of the owner of the knowledge as noted by Davenport in 1998 “knowledge maps typically point to people as well as to documents and databases. The employee with a good knowledge map has access to knowledge sources that would otherwise be difficult or impossible to find”. (Davenport and Prusak 1998).
ISSN 1479-4411 1 ©Academic Conferences Ltd Reference this paper as:
Ermine J-L, Boughzala I and Tounkara T (2006) “Critical Knowledge Map as a Decision Tool for Knowledge Transfer Actions” The Electronic Journal of Knowledge Management Volume 4 Issue 2, pp 129-140, available online at www.ejkm.com
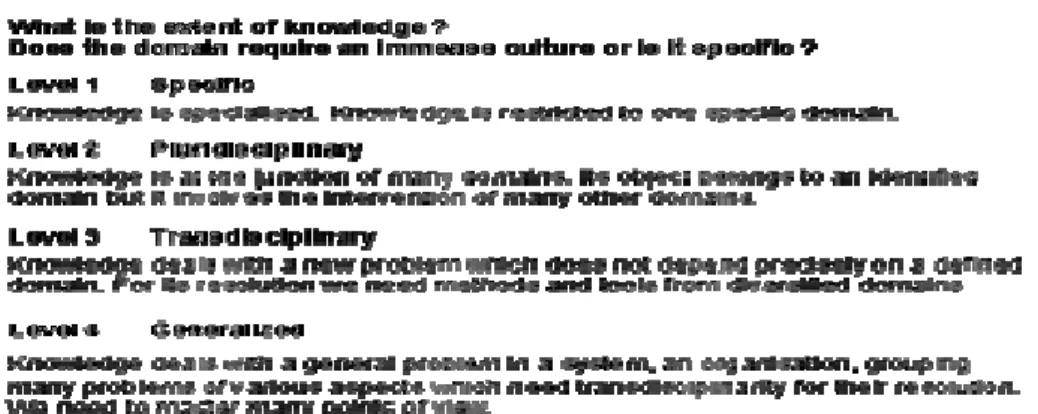
2.5.3 The criticality model
The criticality of a domain is an evaluation of risks/opportunities. It may, for example, be the risks of loss of knowledge that can have harmful consequences; the interest in developing a domain to obtain advantages for the firm (productivity gains, new market share, etc.). We now need to define what may be “objectively” the criticality of knowledge and to give a model of evaluation to identify the most critical knowledge domains in the cartography. The Knowledge Management Club has developed a grid of generic evaluation, called CKF (Critical Knowledge Factors) that is available to the members of the club. This grid has been used and validated in many French and foreign companies. The CKF grid contains 20 criteria around 4 thematic axes (cf. Figure 2). Each criterion is evaluated according to a scale composed of 4 levels, representing the degree of realization of the criterion. Each evaluation of a criterion is based on one question. Each level is expressed by a clear and synthetic sentence by avoiding the vague terms and which lead to confusion (“rating description”) (cf. Figure 3).
3. Hydro Quebec case study
Inter-Generation Knowledge Transfer is an emerging issue linked to massive retirements planned for the coming years. There is a great risk of knowledge loss. The massive retirements are principally due to the ageing of populations and also to the decrease in demographic growth. States such as Canada and Belgium have already taken into account the necessity of knowledge transfer between generations. In this context, Hydro Quebec is implementing knowledge management projects to facilitate knowledge transfer to new generations of its employees.
3.1 Hydro Quebec presentation
Hydro Quebec is one of the biggest electricity producer and distributor in North America. Hydro Quebec is a public company and its principal shareholder is the Quebec Government. Hydro Quebec has about 21000 employees and is facing difficulties linked to massive retirements and particularly the departures of the most experienced employees:
• - 500 per year from 2003 to 2008 • - 800 per year from 2008 to 2011
We can notice also that the « age curve » is very unbalanced (cf. Figure 4).
Thematic axes Criteria
Rarity Number and availability of experts Externalization
Leadership Originality Confidentiality
Utility Corresponding to strategic objectives Value creation
Emergence Adaptability Use
Difficulty to capture knowledge Identification of knowledge sources Mobilization of networks
Tacit knowledge
Importance of tangible knowledge sources Rapidity of obsolescence
Nature of knowledge Depth Complexity
Difficulty of appropriation Importance of past experiences Environment dependency
Figure 3: Evaluation grid of a factor
3.2 The study
The Hydro Quebec study is part of a bigger project « Expertise Management Plan » leaded by the Human Resources Department in collaboration with the CEFRIO.
These were the objectives:
-Identifying strategic knowledge
-Making a diagnosis of the vulnerability of strategic knowledge
-Making recommendations about pertinent KM projects for capitalization, sharing, knowledge transfer, etc.
Figure 4: Age curve in Hydro Quebec Company
The study lasted 6 months and concerned three operational units of Hydro Quebec. We performed M3C methodology to achieve the objectives. Our global approach is described below:
For each unit, we built and validated with experts the cartography of knowledge domains.
We interviewed the experts to evaluate the criticality of each domain (over 30 interviews for the three domains). We used the Critical Knowledge Factors grid.
With the data collected, we made an analysis and put forward recommendations for future actions to achieve the « Expertise Management Plan ».
In the next point, we describe the M3C methodology as it was performed in Hydro Quebec.
4. The M3C methodology
The construction of knowledge cartography and the analysis of criticality may be a difficult operation and can mobilize a great number of people, if it is carried out in order to enable a strategic decision. In addition to having concepts and tools, one needs a methodological and efficient process to build the cartography and the criticality analysis. To do this, we propose a new knowledge cartography method: M3C. We describe the M3C methodology as it was performed in Hydro Quebec.
4.1 Framing
The goal is to define the real strategic objectives of the cartography within the global knowledge management plan. This also enables the limits of the action field to be fixed inside the corporate knowledge. Framing consists also in replacing the cartography approach according to other
Electronic Journal of Knowledge Management Volume 4 Issue 2 2006 (129-140)
transversal approaches in the Organization. Knowledge Management is complementary to other domains such as Quality Management, Skills Management and Information System Management. In the four approaches, the processes and the roles performed by the actors are the articulation points. Quality defines procedures by determining the roles and the recorded information. The Skills Management organizes the necessary competencies to operate a role. Information System distributes computing resources according to the information needs of agents in order to help them accomplish their role. Finally, knowledge cartography detects and organizes the agents’ knowledge necessary to the implementation of their role in the Organization.
4.2 Location of knowledge domains
The location of knowledge domains consists, from documentation of reference and eventually interviews, in highlighting knowledge domains by the successive analysis of activities, projects, products, etc. This task demands a great capacity for analysis. Here, knowing the activities of the firm can be a brake. In fact, we try to ignore of the functional structure of the firm, grouping activities into knowledge domains. The reference documentation is composed of:
The documents of the organization (status, organization chart, description of departments activities, etc.);
The strategic documents (medium term plan, synthesis, etc.);
The documents about the production (publications, studies, activities results, etc.); The quality documents.
4.3 Construction of the first version of the cartography
This point deals with the construction of the physical representation of the knowledge cartography. The first step concerns an in depth analysis of the activities of the firm. The analysis is put into form in order to make it accessible and more usable. The representation must be adapted to the operational vision of the people concerned. The construction of the map is an iterative process and the operational managers validate it. These managers are able to locate and describe knowledge domains in the organization and they know the functional needs.
We realize a constant feedback in 3 phases: Appropriation of the problem
Co-construction of the representation Validation of the map
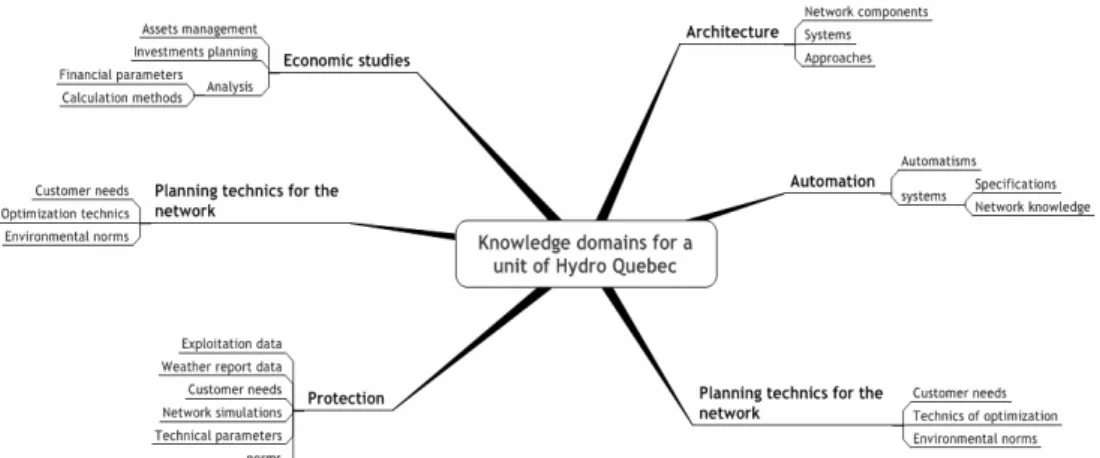
In this context, it is vital to have a solid and constant representation structure, which allows the ideas to be fixed and to make the interviews efficient. The cartography will be the basis for individual and collective interviews of the experts concerned with the knowledge domains located. During these interviews, the experts can modify the cartography. The map presented below is the first version we drew up for one of Hydro Quebec units: it evolved with the corrections and additions of experts.
Figure 5: Example of a knowledge map
4.4 Elaboration of the criticality criteria
Here, we refer to the Critical knowledge Factors grid established by the Knowledge Management Club. This grid must be adapted by taking into account the specificities of the organization, the expectations of the cartography project, the vocabulary used by the organization (e.g.
Quebecois expressions in the Hydro Quebec case study).
The adaptation of the CKF grid can consist in: Adding new thematic axes,
Adding new criticality criteria,
Modifying the evaluation scale of a criterion, Modifying the definition of a criterion.
4.5 Sampling
The choice of experts to be interviewed, using the CKF grid, is important for the success of the cartography project. In this step, we constitute a representative sample of experts for each knowledge domain. Operational chiefs can help to make the right choices. The diversity of profiles is important for the pertinence of the analysis and the interpretation of the data collected. For each expert, we prepare a document to include information such as:
Profile (diplomas, certificates, qualifications, etc.)
Position, age, year of entry in the company Past experiences (before joining the
company)
Experience in the knowledge domain
Role in the knowledge domain (contributor, user, etc.)
Etc.
4.6 Collection of data
The evaluation of the criticality is tackled on the basis of the CKF evaluation grid. The choice of experts to be interviewed in order to fill in this grid and the modalities of data collection are tricky. The efficiency and the pertinence must be targeted, but we must avoid overloading the operational managers.
4.6.1 Preparation of interviews
The preparation of an interview plan is suggested to ensure the homogeneity of all interviews.
For a better understanding of the domain (vocabulary, past experiences, etc.), we strongly recommend, during interviews, the participation of a person who belongs to the company. The recording of interviews is also very useful for the data analysis but we must get the expert’s prior approval.
4.6.2 Individual and collective scoring
Interviews, using the CKF grid, can be performed individually (one expert) or collectively (a group of experts). The choice depends on parameters such as: context and cartography project type, experts’ availabilities, project deadline, etc. The goal is to evaluate each criterion of the CKF grid according to a scale composed of 4 levels (scoring such as “0.5”; “2.5”; “3.5” are accepted). If the expert interviewed can’t answer a question, we give “0” as evaluation: this score is not taken into account during the analysis step. We list below (cf. Table 1) the advantages and inconveniences of individual and collective interviews.
4.7 Data analysis
The analysis of data recorded may represent a considerable volume: it depends on the number of knowledge domains to be evaluated and the number of experts to be interviewed. That’s why a tool is very useful for the processing and the representation of these data, particularly with radar diagrams (Kiviat diagrams for example) and graphs. The cartographic representation tool, with the visualization of different criticality factors, is important for the synthesis and the representation of the results.
Table 1: Advantages and inconveniences of individual/collective interviews
ADVANTAGES INCONVENIENCES
INDIVIDUAL INTERVIEWS (one expert)
Experts are more comfortable. More qualitative data are collected.
Many interviews to perform (more time). Additional step for the comparison of experts’ arguments.
COLLECTIVE
INTERVIEWS (group of experts)
Exchanges and discussions between experts.
We are sure to ask the same questions to all experts of the group.
Knowledge domain analysis is faster.
Sometimes, one expert can take the leadership and then there is a great risk of having a poor argument. Difficult to manage interviews.
A collective interview takes more time than an individual one.
4.7.1 Automatic analysis
After the data collection, we make an automatic analysis using an Excel tool we have developed. It’s an analysis tool that helps:
To fill in all the experts’ scorings in one single table;
To get automatically, the average of all experts’ scorings, for a knowledge domain
(average sorted by criterion and by thematic axe).
This tool also generates for each knowledge domain:
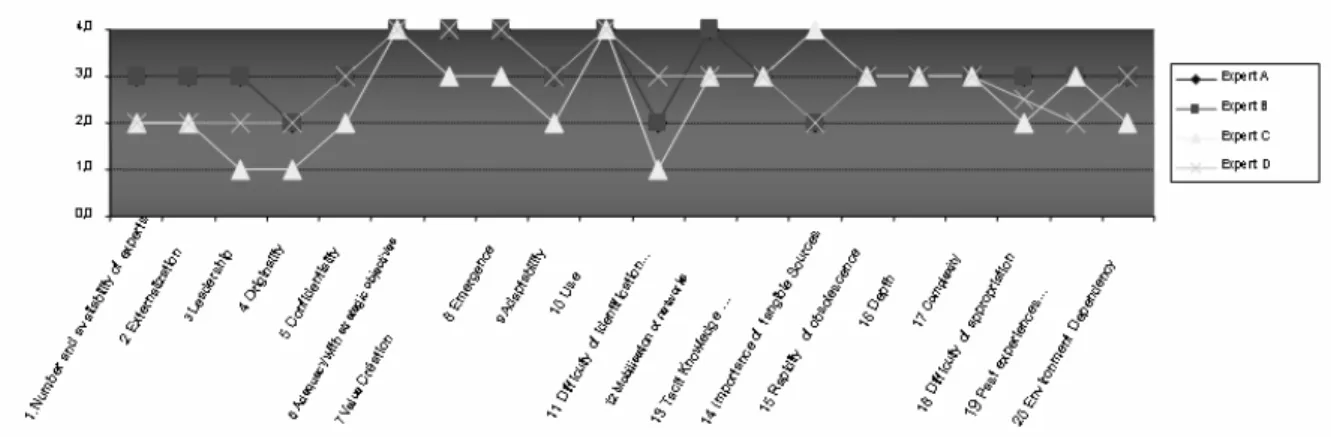
Comparison curves (cf. Figure 6) which allow the visualization of gaps between experts while evaluating the same criterion; the goal is to locate criteria that need additional information before the interpretation step.
Figure 6: Example of comparison curves generated by the Excel tool
The radar diagrams (by criterion and by thematic axis, (cf. Figure 7) which are the visualization of each expert’s evaluation
A final radar diagram which is a visual synthesis of the collective perception (all experts) about the knowledge domain criticality
The criticality of a knowledge domain with regards to a criterion (mcriterion) is obtained by calculating the average of experts’ scorings.
ert ert criterion
n
m
m
exp exp∑
=
nexpert is the number of experts interviewed for the
knowledge domain
The average criticality of a knowledge domain (M) is obtained by calculating the average of criticality values for each criterion:
∑
∑
=
i i i criterion ik
m
k
M
.
ki is the coefficient corresponding to the criterion « i » used for the average calculation. This coefficient is a weight given to the criterion according to its importance in the analysis.
Advantages and inconveniences of an automatic analysis are listed in the table below (cf. Table 2):
4.7.2 “Levelling out” step
“Levelling out” consists in making an interpretation of existing divergences between experts. In this step, analysts must:
Take into account the position, the role, the expertise level of the people interviewed; Listen again to the recorded interviews. At the end of the “polishing” step, we obtain the final scorings and averages. A synthesis is written for each knowledge domain.
Figure 7: Diagrams for the automatic analysis
ISSN 1479-4411 1 ©Academic Conferences Ltd
Reference this paper as:
Ermine J-L, Boughzala I and Tounkara T (2006) “Critical Knowledge Map as a Decision Tool for Knowledge Transfer Actions” The Electronic Journal of Knowledge Management Volume 4 Issue 2, pp 129-140, available online at www.ejkm.com
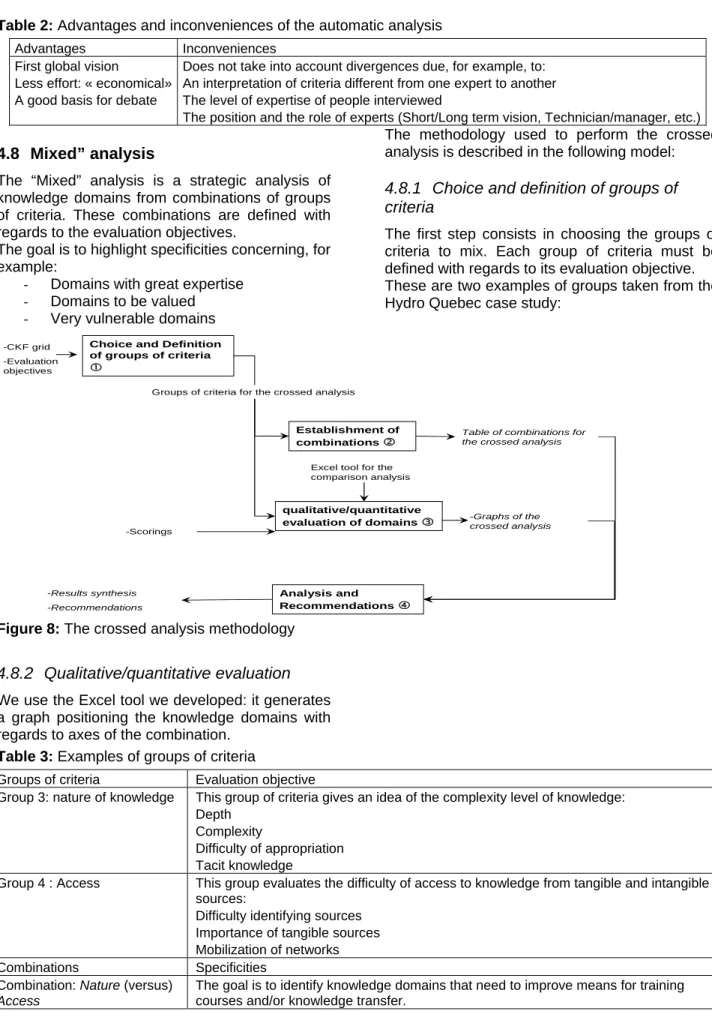
Table 2: Advantages and inconveniences of the automatic analysis
Advantages Inconveniences First global vision
Less effort: « economical» A good basis for debate
Does not take into account divergences due, for example, to: An interpretation of criteria different from one expert to another The level of expertise of people interviewed
The position and the role of experts (Short/Long term vision, Technician/manager, etc.) 4.8 Mixed” analysis
The “Mixed” analysis is a strategic analysis of knowledge domains from combinations of groups of criteria. These combinations are defined with regards to the evaluation objectives.
The goal is to highlight specificities concerning, for example:
- Domains with great expertise - Domains to be valued - Very vulnerable domains
The methodology used to perform the crossed analysis is described in the following model:
4.8.1 Choice and definition of groups of criteria
The first step consists in choosing the groups of criteria to mix. Each group of criteria must be defined with regards to its evaluation objective. These are two examples of groups taken from the Hydro Quebec case study:
Choice and Definition of groups of criteria c Establishment of combinations d qualitative/quantitative evaluation of domains e Analysis and Recommendations f -CKF grid -Evaluation objectives
Table of combinations for the crossed analysis
-Scorings
-Graphs of the
crossed analysis
-Results synthesis -Recommendations
Excel tool for the comparison analysis Groups of criteria for the crossed analysis
Figure 8: The crossed analysis methodology
4.8.2 Qualitative/quantitative evaluation
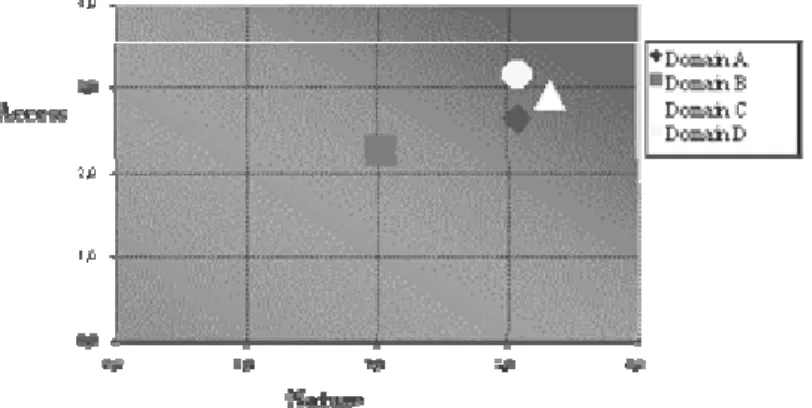
We use the Excel tool we developed: it generates a graph positioning the knowledge domains with regards to axes of the combination.
Table 3: Examples of groups of criteria
Groups of criteria Evaluation objective
Group 3: nature of knowledge This group of criteria gives an idea of the complexity level of knowledge: Depth
Complexity
Difficulty of appropriation Tacit knowledge
Group 4 : Access This group evaluates the difficulty of access to knowledge from tangible and intangible sources:
Difficulty identifying sources Importance of tangible sources Mobilization of networks Combinations Specificities Combination: Nature (versus)
Access
The goal is to identify knowledge domains that need to improve means for training courses and/or knowledge transfer.
Electronic Journal of Knowledge Management Volume 4 Issue 2 2006 (129-140)
Figure 9: Graph for the qualitative/quantitative evaluation
4.8.3 Results synthesis and recommendations
We list in a table, using the graphs of crossed analysis, knowledge domains concerned by
specificities we want to highlight. This table is the basis for a more refined analysis and for recommendations.
Table 4: Example of results
Knowledge domains
Domains with great expertise
Domains to be valued
Very vulnerable domains
Domains that need to improve/adapt methods for training courses, knowledge transfer
Domain A X X X X
Domain B X X X
Domain C X X
5. Conclusion
Knowledge cartography is a new issue. Its importance is increasing with the needs in Knowledge Management, especially in Knowledge Transfer between professional generations. There are few academic papers and experiments in this domain. The M3C methodology and the tools, which have been described here, have shown their interest and their credibility. The Hydro Quebec case study has allowed them to be validated. The basis is now ready for new developments in the cartography domain and in
criticality studies. The cartographic tool reveals itself to be interesting. More than the analysis of critical knowledge, it can be a basis for :
- Communities of Practice structuring
- Knowledge elicitation
- Environment scanning actions The knowledge map can also be used as an access portal to the knowledge capital by indicating at the expert, the publications or the attached documents.
References
Aubertin G., I. Boughzala, J-L. Ermine (2003) Cartographie des connaissances critiques Extraction des connaissances et apprentissage, Hermès.
Authier M. et Lévy P. (1992) Les arbres de connaissances, Editions la découverte.
Boughzala I. , J-L Ermine (2004) Management des connaissances en entreprise, Collection technique et scientifique des télécommunications, Hermes.
Club Gestion des Connaissances, J-L Ermine, H. Laude (2000) A Knowledge Maturity Model, Actes du Workshop “Knowledge Management; Theory and Practice” (J-L Ermine ed.), in PKDD’2000 (Principles of Knowledge Discovery from Data), 12 september 2000, Lyon, pp 13-18.
Davenport T. and Glaser J. (2002) Just-in-Time Delivery Comes to Knowledge Management, Harvard Business Review, July, pp 107-111.
Davenport T. and Prusak L. (1998) Working knowledge: how organizations manage what they know, Harvard Business School Press.
Drucker P. (1993) Post-Capitalism Society, Oxford.
Earl M. (2001) Knowledge Management Strategies: toward a taxonomy, Journal of Management Information Systems, Summer, Vol.18, N°1, pp. 215-233.
Ermine J.-L. (2002). La gestion des connaissances. Hermès sciences publications.
Godbout A. (1999) Cartographie des connaissances, la fondation de l’organisation des connaissances. Article de Godbout Martin Godbout et Associés.
Grundstein M. and Rosenthal-Sabroux C. (2003) A Way to Highlight Crucial Knowledge For Extended Company's employees. Annales du Lamsade Paris.
Nonaka I. and Takeuchi. (1995) The Knowledge Creating Company, Oxford University Press, 1995.
Pachulski A., Michel Grundstein, Camille Rosenthal-Sabroux (2000) GAMETH : A Methodology Aimed To Locate The Company’s Crucial Knowledge. ECKM 2000, 26-27 october 2000, Bled (Slovénie).
Pomian J. et Roche C. (2002) Connaissance Capitale : Management des connaissances et organisation du travail, L’Harmattan.
Saad I., Grundstein M., Rosenthal-Sabroux C. (2003) Locating The Company’s Crucial knowledge to Specify Corporate Memory : A Case Study in an Automotive Company, Workshop Knowledge Management and Organisational Memory, IJCAI’2003, International Joint Conference on Artificial Intelligence, 9-16 august, Acapulco.
Speel PH,. Shadbolt N., De Vries W., Van Dam PH, O’hara K. (1999) Knowledge Mapping for industrial purpose. October 99, Banff, Canada. Conférence KAW99.
Sveiby K. (2002) Creating Knowledge Focused Strategies: Good and Bad Practices, Henley KM Forum, 2nd Annual Conference, Henley Management College, UK.
Teece D. (1998) Capturing Value from Knowledge Assets: the New Economy, Markets for Know-how, and Intangible Assets, California Management Review, 40 (3), pp. 55-79.
Tounkara T., Matta N., Ermine J-L. et Coppens C. (2002) L’appropriation des connaissances avec MASK, EGC’2002, Montpellier, 21-23 january.
Tseng B. and Huang C. (2005) "Capitalizing on Knowledge: A Novel Approach to Crucial Knowledge Determination," IEEE Transactions on Systems, Man, and Cybernetics Part A: Systems and Humans (to appear).
Tsuchiya S. (1993) Improving Knowledge Creation Ability through Organizational Learning, In Proceedings International Symposium on the Management of Industrial and Corporate Knowledge, UTC, Compiègne.
Electronic Journal of Knowledge Management Volume 4 Issue 2 2006 (129-140)