Journal of Diabetes Science and Technology 1 –9
© 2016 Diabetes Technology Society Reprints and permissions: sagepub.com/journalsPermissions.nav DOI: 10.1177/1932296816648344 dst.sagepub.com
Original Article
The World Health Organization (WHO) defines normal gly-cemia as fasting glucose less than 6.1 mmol/L and recom-mends that glucose be <7.8 mmol/L 2 hours after a 75 g oral glucose tolerance test (OGTT) test.1 The American Diabetes Association (ADA) considers those with a fasting glucose of 5.6-6.9 mmol/L and blood glucose (BG) > 7.8 -11.0 mmol/L after an OGTT at increased risk of diabetes.2 However, as the WHO guidelines explain, there is no definitive cut off for “normoglycemia.”1
Continuous glucose monitoring (CGM) devices, with their 1-5 minute measurement interval, allow BG concentra-tion dynamics to be captured far more frequently and less invasively than traditional BG measures. CGM devices typi-cally consist of a small pager-like monitoring device that receives a signal from a sensor inserted into the subcutane-ous layer. The sensor creates a signal using the glucose oxi-dase reaction and produces a current proportional to the glucose concentration in the surrounding interstitial fluid. The signal is converted into a BG value by using calibration BG measurements, which are entered into the monitor by the user every ~6-8 hrs.
These devices are primarily designed for use in individuals with type 1 and type 2 diabetes to aid BG regulation and are well studied in this cohort.3,4 However, because of the increased measurement frequency and reduced invasiveness they have recently been applied to other cohorts, such as inten-sive care patients and neonates, with varying success.5-12 Another, perhaps overlooked, cohort where the more intensive metabolic monitoring provided by CGM may be beneficial is athletes.
Athletes are traditionally encouraged to consume a diet rich in carbohydrates to ensure adequate glycogen stores and improve performance.13-15 Physical training is known to 1Department of Mechanical Engineering, University of Canterbury,
Christchurch, New Zealand
2GIGA—In Silico Medicine, University of Liege, Belgium
Corresponding Author:
Felicity Thomas, BE(Hons), Department of Mechanical Engineering, University of Canterbury, Private Bag 4800, Christchurch, 8140, New Zealand.
Email: [email protected]
Blood Glucose Levels of Subelite
Athletes During 6 Days of Free Living
Felicity Thomas, BE(Hons)
1,2, Chris G. Pretty, PhD
1,
Thomas Desaive, PhD
2, and J. Geoffrey Chase, PhD
1Abstract
Background: Continuous glucose monitoring (CGM) devices, with their 1-5 min measurement interval, allow blood glucose (BG) concentration dynamics to be captured more frequently and less invasively than traditional BG measures. One cohort CGM could provide insight is athletes. This study investigates what impact their heightened energy expenditure and dietary intake may have on their ability to achieve optimal BG.
Methods: Ten subelite athletes (resting HR<60 bpm, training>6 hrs per week) were recruited. Two Ipro2 CGM devices (Medtronic Minimed, Northridge, CA) were inserted into the abdomen and remained in place for ~6 days. Time in band was calculated as the percentage of CGM BG measurements with in the 4.0-6.0 mmol/L. Fasting glucose was calculated using CGM calibration BG measurements and postprandial glucose response was also calculated using the CGM values.
Results: 4/10 athletes studied spent more than 70% of the total monitoring time above 6.0 mmol/L even with the 2-hour period after meals is excluded. Fasting BG was also in the ADA defined prediabetes range for 3/10 athletes. Only 1 participant spent substantial time below 4.0 mmol/L which was largely due to significantly lower energy intake compared to recommendations. Conclusions: Contrary to expectations high BG appears to be more of a concern for athletes then low BG even in those with the highest energy expenditure and consuming below the recommended carbohydrate intake. This study warrants further investigation on the recommended diets and the BG of athletes to better determine the causes and impact of this hyperglycemia on overall athlete health.
Keywords
cise is known to increase circulating concentrations of catecholamines, such as adrenalin and noradrenaline, to near pathological levels,17,18 resulting in hyperglycemia and hyperinsulinemia post–intense exercise.17,19,20
This study aims to use the CGM BG profiles and dietary habits of subelite athletes to investigate if this cohort is achieving optimal BG levels during normal free living and training. The CGM data provide a unique insight in to the day to day BG levels of Athletes that could not be achieved without the application of this technology. In particular, it asks what impact their increased insulin sensitivity, height-ened energy expenditure and increased exposure to stress hormones have on their BG levels.
Methods
Ten fit, healthy subelite athletes (resting HR <60 bpm) were recruited under informed written consent for a study into opti-mal athlete nutrition (henceforth referred to as athletes). Table 1 summarizes the cohort demographics. All subjects regularly trained > 6 hours per week in a range of endurance based sports, predominantly running and cycling. Participants were free living during the monitoring period and did not have tai-lored nutritional programs from this study or an existing coach. The research procedures and use of data were approved by the University of Canterbury Human Ethics Committee.
Two Ipro2 and 1 Guardian Real-time CGM devices (Medtronic Minimed, Northridge, CA, USA) were inserted into the abdomen of each athlete ~24 hours prior to the first ‘fasted exercise test’. The CGM device remained in each sub-ject for 4-6 days. For all athletes, the Ipro CGM devices were both inserted in to the left side of the abdomen and the Guardian in the right side. These devices are referred to as sensor 1 (SG1), the lower left abdomen sensor, sensor 2 (SG2), the upper-left abdomen sensor, and the real-time sensor in the right abdomen sensor (SGrealtime). Figure 1 shows these locations which are typical for these devices. The Guardian real-time data were not used in this analysis. Two Ipro2 sensors were worn to provide redundancy in case of sensor failure, which is not immediately apparent with these retrospective devices.
During the ~6 days of CGM per athlete:
ments were used to calibrate the device (calibration BG) •
• All meals and snacks were recorded (self-reporting) and carbohydrate, sugar, fiber, protein and fat intake was calculated.
•
• Any exercise was also recorded (self-reporting) and energy expenditure estimated.
•
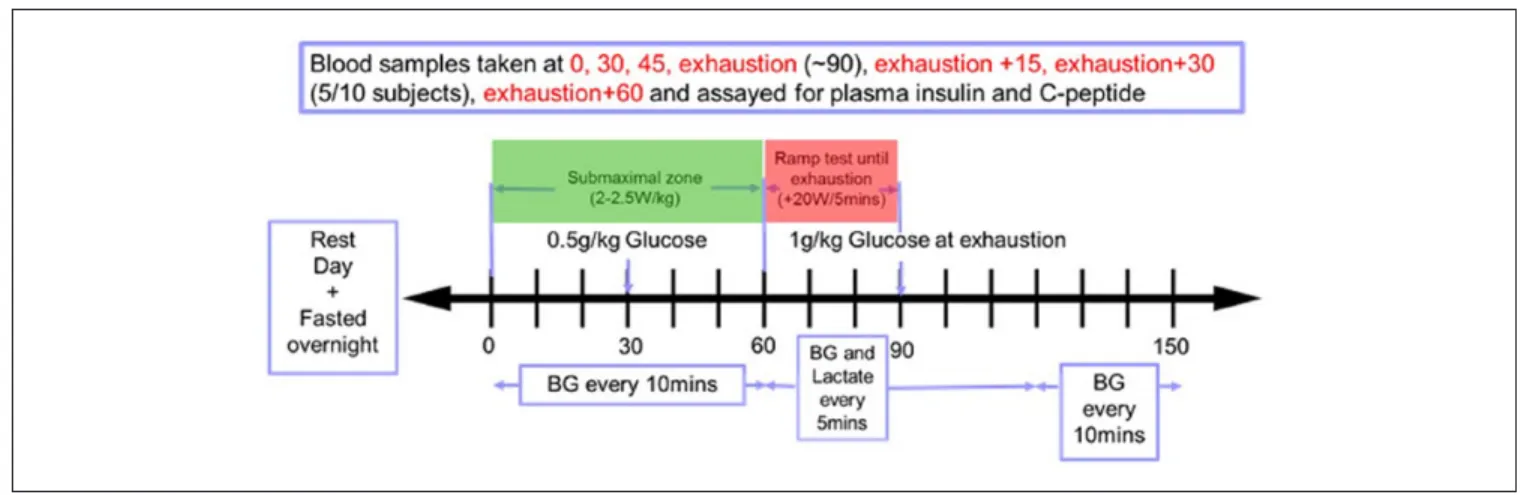
• A fasted exercise test was carried out on Day 2, as shown in Figure 2.
Calibration BG measurements were taken using capillary finger stick measurements and the Abbott Optimum Xceed (Abbott Diabetes Care, Alameda, CA) glucometer. The Abbott device has reported error of 5-10%.9,21-23 A body composition analysis was undertaken by 8 of the 10 partici-pants prior to the fasting test using a body composition ana-lyzer (InBody230, InBody Bldg, Seoul, Korea).
Analysis
Sensor glucose (SG) data from measured CGM traces of the 2 Ipro2 devices were analyzed. These devices have shown to have very good accuracy and sensor agreement in active individuals.8,24 The 2 signals were averaged at each time step for the time period they were worn to provide a single, reli-able trace of BG. For Ath04, Ath09, and Ath10 only 1 CGM trace was available due to sensor failure.
For each athlete, the cumulative distribution of BG data was analyzed for the entire 5-6 days of monitoring, and rean-alyzed with the 2-hour period following any meal or snack removed. Time in band was calculated as the percentage of SG with in the 4.0-6.0 mmol/L during the 2 different moni-toring periods. Although a consensus has yet to be reached on what normal glucose levels, intensive insulin therapy studies show achieving higher time in this band results in improved patient outcomes25-27 and it lies below typical thresholds for diabetes diagnosis.1,2 Many studies have also demonstrated the linearly increasing risks associated with hyperglycemia, regardless of diabetes status, with lower lim-its between 4.0 and 6.0 mmol/L.1,28-33
The average carbohydrate, sugar, and fiber intake (g/day) while using CGM were calculated. First, daily caloric intake
was calculated using basal metabolic rate (BMR) as esti-mated by the body composition analysis. For 2/10 athletes, Ath02 and Ath03, body composition analysis results were not available. Therefore, BMR was estimated using the stan-dard equations34 that take in to account height, weight, and age. This BMR was then multiplied by an activity factor35 considering the amount of exercise undertaken by the athlete during the monitoring period. This process and relating caloric requirements are shown in Table 2.
US dietary guidelines36 recommend 45-65% of total calo-rie intake be from carbohydrates and the recommended amount of added sugars is also related to calorie level in these guidelines. Added sugar content of food consumed during the monitoring period was calculated using the US Department of Agriculture (USDA) database.37 If the added sugar content was not available from the database it was assumed to be zero, providing an overall conservative estimate.
Fasting blood glucose (FBG) was calculated as the median value of the calibration measurements taken prior to break-fast over the 5-6 days of CGM monitoring. Fasting plasma insulin (FPI) was determined by the first plasma insulin
measurement taken prior to starting the fasted exercise test on Day 2 (Figure 2). Fasting insulin secretion (FIS) was cal-culated from the initial C-peptide measurement taken prior to starting the fasted exercise test using the method of Van Cauter et al38 assuming steady-state, as subjects were fasted.
Postprandial glucose response (PPGR) was calculated as the incremental area under the BG curve after a meal.39 Only the area above the starting glucose value was considered. PPGR was only considered for meals that had greater than 30 g of carbohydrate, and where there was no meal of greater than 15 g carbohydrate in the 2 hours prior to or after this meal. If meals were consumed within 15 minutes then carbo-hydrate content was combined and the 2-hour area under the curve considered from the start of the second meal. Postprandial glucose (PPG) was the glucose value recorded 2 hours after a meal under the same conditions as above.
Results
Individual SG profiles are shown in Figure 3 and Figure 4. These profile highlight the very unique response of each
Figure 2. Schematic displaying experimental procedure for the fasted exercise test the participants undertook.
Table 2. The Process of Calculating the Caloric Requirements Based on BMR and Activity Level and the Average Calorie Intake
Achieved by Each Subject.
Subject (kcal)BMR Average exercise (min/day) Activity factor Calories required (kcal/d) Average calorie intake per day (kcal/d)
Ath01 1342 84 1.9 2550 2147 Ath02 1868a 41 1.7 3176 3864 Ath03 1927* 68 1.9 3661 1877 Ath04 1770 93 2.1 3717 3555 Ath05 1680 158 2.3 3864 2568 Ath06 1694 28 1.5 2541 2654 Ath07 1780 20 1.5 2670 2838 Ath08 1895 24 1.5 2843 4144 Ath09 1379 102 2.1 2896 2726 Ath10 1400 42 1.7 2380 2363
individual to exercise and carbohydrates. Ath02 and Ath04 both show very little variation in SG but Ath02 SG is centered on a higher glucose value resulting in more time out of the 4.0-6.0 mmol/L. Other subjects such as Ath03 and Ath09 show a large variation in SG, once again centered on different glucose levels resulting in Ath03 displaying the most hypo-glycemia and Ath09 displaying the most hyperhypo-glycemia. Also individual plots for each SG profile can be found in the sup-plementary material accompanying this article. These plots show both SG profiles and the resulting averaged SG.
In Figure 5 it is further evident participants spend a sig-nificant amount of time outside the normoglycemic 4.0-6.0 mmol/L range. Once meals are removed, in the bottom plot, there is a distinct separation between 4/10 of the subjects (Ath05, 07, 08, 09) who have less than 30% time in the 4.0-6.0 mmol/L. In contrast, the remaining 6/10 participants achieve over 85% time in the desired 4.0-6.0 mmol/L range, which is clear when comparing the distributions.
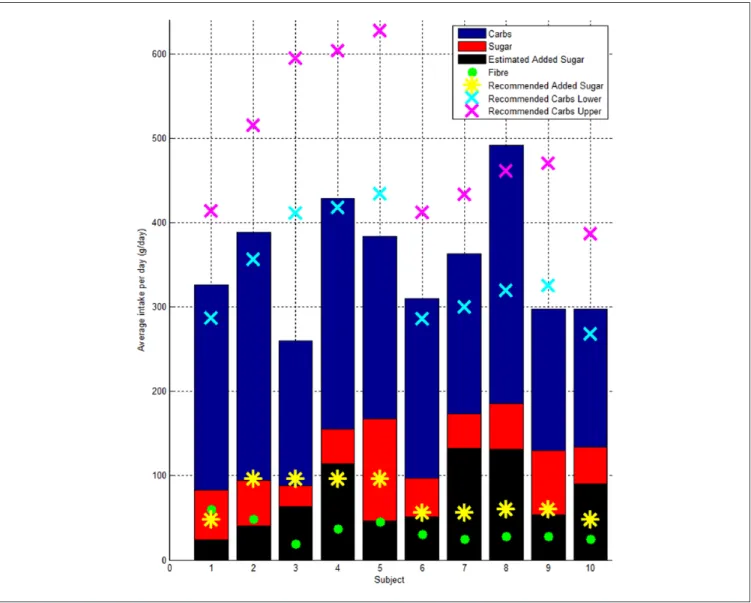
All but 4 participants consumed on average an amount of carbohydrate that was between 45 and 65% of their recom-mended daily calorie intake. Ath03, Ath05, and Ath09 did not reach the minimum recommended amount of carbohydrate. Ath08 consumed more than 65% of their recommended
intake as carbohydrate. All participants achieved their recom-mended fiber intake of >25 g. Some participants, such as Ath07 and Ath08, have a very low fiber to sugar ratio and nearly double the recommended intake of added sugars (Figure 6). Ath03 consumed on average ~150 g of carbohy-drate less than the lower recommended limit, 1770 kcal less than required (Table 2) and was the only participant to dem-onstrate a significant amount time below 4.0 mmol/L.
Table 3 shows Ath05, Ath07 and Ath09 have elevated fast-ing glucose within the prediabetes range 5.6-6.9 mmol/L sug-gested by the ADA. However, none of the subjects met the prediabetes criteria of PPG > 7.8 mmol/L. Although this crite-ria is based on the BG 2 hours after a 75 g glucose tolerance test rather than after an uncontrolled meal. The mean PPGR ranges from 0.2 to 2.0 mmol/L.hr displaying a wide range intra and inter of carbohydrate sensitivity. High PPGR did not necessar-ily correlate with time out side of the 4.0-6.0 mmol/L band.
Discussion
Physical training is known to improve insulin sensitivity, both immediately postexercise (up to 2 hrs) and through mul-tiple adaptations in glucose transport and metabolism.16
Figure 3. CGM profiles for the first 5 subjects. The 2-hour postprandial meal response is highlighted in red, and periods of exercise are
Therefore, it could be expected high BG would not be fre-quently seen in athletes and low BG would be of greater con-cern due to increased energy expenditure. However, this hypothesis does not appear to be the case in the data we have collected.
In particular, 4/10 subjects spent more than ~70% of the total monitoring period with SG > 6.0 mmol/L even with the 2-hour period after meals removed. Only 1 athlete experi-enced a significant time below 4.0 mmol/L and this behavior appears largely due to a considerably decreased calorie intake compared to recommended guidelines.
Ath09 and Ath05 undertook the most exercise during the monitoring period, averaging 102 and 158 min/day respec-tively. This high training load could have contributed to the low time in the 4.0-6.0 mmol/L band, as exercise is known to increase BG and induce hyperglycemia and hyperinsu-linemia as a result of this catecholamine response.17,19,20 Both subjects have the lowest FPI and insulin secretion recorded suggesting efficient glucose uptake. In addition, both achieved VO2max values that put them in the excellent cat-egory based on their gender and age.
Ath07 and Ath08 carried out the least amount of exercise during the monitoring period only averaging 20 and 24 min/
day of exercise, while over consuming added sugars1 and Ath08 over consuming on the recommended carbohydrate intake. Lowering physical activity is known to impact the glycemic control of healthy individuals and the increased insulin sensitivity witnessed due to training wanes with 5 days of detraining.16,40-42 The large amount of time spent out of band by Ath07 and Ath08 is likely to be attributed to these diet and lifestyle choices. This conclusion is supported by Ath07 and Ath08 showing the highest FPI levels and FIS and only achieving average or above average category VO2max levels based on gender and age.
An individual’s tolerance of carbohydrate is highly vari-able and is related to a number of factors including age and genetics.43,44 A differing ability to tolerate carbohydrates in this cohort is demonstrated with the wide range of cohort values of mean PPGR and mean PPG, 0.2-2.0 mmol/L.h and 5.5-7.4 mmol/L respectively. Also PPGR and PPG do not necessarily correlate with time in band or FBG. A subject can achieve good overall control or even experience low BG, such as Ath03, but still demonstrate a high mean PPGR indi-cating a high sensitivity to carbohydrates. A subject like Ath09 also appears to have a very high sensitivity to carbo-hydrates achieving high PPGR and low time in band while
Figure 4. CGM profiles for the last 5 subjects. The 2-hour postprandial meal response is highlighted in red, and periods of exercise are
under consuming on the recommended carbohydrate intake. However, a subject like Ath04 displays a very high tolerance of carbohydrates, achieving the greatest time in band and very low PPGR, while still over consuming added-sugars. It is interesting to note that normalizing results by grams of carbohydrate consumed did not change the trends seen.
Athletes are traditionally encouraged to consume high carbohydrate diets to replenish muscle glycogen stores and improve performance, with a particular focus on postexer-cise carbohydrate consumption.13-15 However, this advice may be negatively impacting the blood sugar levels of ath-letes predisposed to have a low tolerance of carbohydrates. In addition it is unlikely that low BG in day to day life is a real concern for athletes, unless they are significantly under consuming calories. Hence, the potential for a more
personalized nutrition plan aided by CGM to optimize the BG levels during different phases of athletes training is high-lighted by these results.
This study warrants further investigation on the recom-mend diets and the BG levels of athletes, in particular those in the subelite category studied here. Subelite athletes are unlikely to have the same nutritional and dietary support from trained professionals as elite athletes. Hence, their nutritional intakes are more perhaps likely to be suboptimal, as demonstrated in this study.
Limitations
This study is limited by the small cohort size. However, this initial pilot investigation has highlighted some interesting
Figure 5. Cumulative distribution plots of measured CGM values. The top plot is the cumulative distribution of the entire averaged
CGM signal. The bottom plot is the CGM signal with 2 hours from the beginning of each meal and snack removed. The green band represents the normal range.
Figure 6. Bar plot showing the average intake per day of carbohydrate, sugar, fiber, and the recommended daily intake of carbohydrate,
upper (65% of calorie intake) and lower (45% of calorie intake).
Table 3. Summary Table of Measured Physical and Metabolic Variables.
Subject Sex Age BMI PBF (%) FFM (kg) (mmol/L)FBG (mU/L)FPI FIS (mU/L.
min) TIB-MR (%) Mean PPGR (mmol/L.hr)
Mean PPG
(mmol/L) (min/day)Exercise
VO2max (mL/kg/ min) Ath01 F 23 21.6 25.3 45 5.2 9.0 1319 86.6 1.1 6.1 84 39 Ath02 M 23 21.9 — — 5.1 6.3 913 90.7 0.5 6.0 41 60 Ath03 M 50 26.4 — — 4.7 11.8 1878 76.1 1.9 6.0 68 39 Ath04 M 23 20.4 5.1 64.8 4.6 6.5 832 99.2 0.5 5.5 93 67 Ath05 M 28 24.2 14.1 60.6 6.0 6.3 820 30.7 0.9 6.8 158 59 Ath06 M 36 22.4 15.5 63.3 4.4 8.3 1844 94.3 1.2 5.9 28 59 Ath07 M 37 26.0 19.7 65.3 6.7 10.5 1553 23.9 1.1 7.1 20 42 Ath08 M 22 24.5 13.2 70.6 5.5 11.0 1550 31.7 0.2 5.5 24 37 Ath09 F 37 21.1 17.8 46.7 6.0 6.0 936 9.7 2.0 7.4 102 47 Ath10 F 27 22.2 28.3 47.7 5.2 9.5 1344 86.6 1.0 6.7 42 44
FBG, fasting blood glucose; FFM, fat free mass; FIS, fasting insulin secretion; FPI, fasting plasma insulin; Maxppg, maximum blood glucose value reached after a meal; PBF, percentage body fat; PPG, blood glucose value 2 hours after a meal; PPGR, postprandial glucose response; TIB-MR, time in band, with meals removed. Body composition analysis results were not available for Ath02 and Ath03, hence PBF and FFM values are missing.
be expected sustained high BG during free living would not be frequently seen in athletes and low BG would be of greater concern due to increased energy expenditure. However, this hypothesis does not appear to be the case in the data we have collected. When the SG profiles of 10 trained, subelite letes were analyzed over a 6 day monitoring period 4/10 ath-letes studied spent more than 70% of the total monitoring time above 6 mmol/L even with the 2-hour period after meals removed. FBG was also in the range of prediabetes for 3/10 athletes as defined by the ADA. Only 1 participant spent sub-stantial time below 4 mmol/L and this was largely due to a significantly lower overall calorie intake compared to rec-ommendations. A differing ability to tolerate carbohydrates in this cohort is demonstrated with the wide range of cohort values of mean PPGR and mean PPG, 0.2-2.0 mmol/L.h and 5.5-7.4 mmol/L respectively. Therefore, a diet rich in carbo-hydrates may not be beneficial in some athletes, especially as low BG is unlikely to be of concern to an athlete consuming adequate calorie intake. This study provides a unique insight in to the day to day glucose levels of athletes that could only be achieved through the use of CGM devices highlighting the need for further investigation on the recommend diets of athletes to better determine the causes and impact of the hyperglycemia seen on health and performance.
Abbreviations
ADA, American Diabetes Association; BG, blood glucose; CGM, continuous glucose monitoring; FBG, fasting blood glucose; FFM, fat free mass; FIS, fasting insulin secretion; FPI, fasting plasma insulin; OGTT, oral glucose tolerance test; PBF, percentage body fat; PPG, postprandial glucose; PPGR, postprandial glucose response; SG, sensor glucose; TIB, time in band; T2DM, type 2 diabetes; WHO, World Health Organization.
Declaration of Conflicting Interests
The author(s) declared no potential conflicts of interest with respect to the research, authorship, and/or publication of this article. Funding
The author(s) disclosed receipt of the following financial support for the research, authorship, and/or publication of this article: This
S62-S69.
3. Gandhi GY, Kovalaske M, Kudva Y, et al. Efficacy of con-tinuous glucose monitoring in improving glycemic control and reducing hypoglycemia: a systematic review and meta-anal-ysis of randomized trials. J Diabetes Sci Technol. 2011;5(4): 952-965.
4. Hoeks LB, Greven WL, de Valk HW. Real-time continuous glucose monitoring system for treatment of diabetes: a system-atic review. Diabet Med. 2011;28(4):386-394.
5. Chee F, Fernando T, van Heerden PV. Closed-loop glucose control in critically ill patients using continuous glucose moni-toring system (CGMS) in real time. IEEE Trans Inf Technol
Biomed. 2003;7(1):43-53.
6. Holzinger U, Warszawska J, Kitzberger R, et al. Real-time continuous glucose monitoring in critically ill patients: a pro-spective randomized trial. Diabetes Care. 2010;33(3):467-472. 7. Brunner R, Kitzberger R, Miehsler W, et al. Accuracy and
reliability of a subcutaneous continuous glucose-monitoring system in critically ill patients. Crit Care Med. 2011;39(4): 659-664.
8. Thomas F, Pretty CG, Signal M, et al. Accuracy and perfor-mance of continuous glucose monitors in athletes.
IFAC-PapersOnLine. 2015;48(20):1-6.
9. Signal M. Continuous glucose monitoring and tight glycaemic control in critically ill patients in bioengineering. Canterbury, England: University of Canterbury; 2013.
10. Signal M, Pretty CG, Chase JG, et al. Continuous glucose monitors and the burden of tight glycemic control in critical care: can they cure the time cost? J Diabetes Sci Technol. 2010;4(3):625-635.
11. Beardsall K, Ogilvy-Stuart A, Ahluwalia J, et al. The continu-ous glucose monitoring sensor in neonatal intensive care. Arch
Dis Child. 2005;90(4):F307-F310.
12. Harris DL, Battin MR, Weston PJ, et al. Continuous glucose monitoring in newborn babies at risk of hypoglycemia. J
Pediatr. 2010;157(2):198-202.
13. International Olympic Committee. Nutrition for Athletes. Lausanne, Switzerland: International Olympic Committee; 2010. 14. Position of the American Dietetic Association, Dietitians
of Canada, and the American College of Sports Medicine: nutrition and athletic performance. J Am Diet Assoc. 2000;100(12):1543-1556.
15. Jacobs KA, Sherman WM. The efficacy of carbohydrate sup-plementation and chronic high- carbohydrate diets for improv-ing endurance performance. Int J Sport Nutr. 1999;9(1):92-115.
16. Borghouts LB, Keizer HA. Exercise and insulin sensitivity: a review. Int J Sports Med. 2000;21(1):1-12.
17. Bloom SR, Johnson RH, Park DM, et al. Differences in the metabolic and hormonal response to exercise between racing cyclists and untrained individuals. J Physiol. 1976;258(1):1-18. 18. Rehrer NJ, Brouns F, Beckers EJ, et al. Physiological changes
and gastro-intestinal symptoms as a result of ultra-endurance running. Eur J Appl Physiol Occup Physiol. 1992;64(1):1-8. 19. Ivy JL, Katz AL, Cutler CL, et al. Muscle glycogen synthesis
after exercise: effect of time of carbohydrate ingestion. J Appl
Physiol. 1988;64(4):1480-1485.
20. Marliss EB, Vranic M. Intense exercise has unique effects on both insulin release and its roles in glucoregulation: implica-tions for diabetes. Diabetes. 2002;51(suppl 1):S271-S283. 21. Abbott. Abbott Optium test-strip packet insert. 2010.
22. Brunner R, Kitzberger R, Miehsler W, et al. Accuracy and reli-ability of a subcutaneous continuous glucose-monitoring system in critically ill patients. Crit Care Med. 2011;39(4):659-664. 23. Thomas F, Pretty CG, Shaw GM, et al. Glucometer
perfor-mance in the intensive care unit. Paper presented at: 14th Annual Diabetes Technology Meeting; 2014; Bethesda, MD. 24. Bailey TS, Ahmann A, Brazg R, et al. Accuracy and
accept-ability of the 6-day Enlite continuous subcutaneous glucose sensor. Diabetes Technol Ther. 2014;16(5):277-283.
25. Krinsley JS. Effect of an intensive glucose management pro-tocol on the mortality of critically ill adult patients. Mayo Clin
Proc. 2004;79(8):992-1000.
26. Chase JG, Shaw G, Le Compte A, et al. Implementation and evaluation of the SPRINT protocol for tight glycaemic control in critically ill patients: a clinical practice change. Crit Care. 2008;12(2):R49.
27. Van den Berghe G, Wouters P, Weekers W, et al. Intensive insulin therapy in the critically ill patients. N Engl J Med. 2001;345(19):1359-1367.
28. Brunner EJ, Shipley MJ, Witte DR, et al. Relation between blood glucose and coronary mortality over 33 years in the Whitehall Study. Diabetes Care. 2006;29(1):26-31.
29. Jee SH, Ohrr H, Sull JW, et al. Fasting serum glucose level and cancer risk in Korean men and women. JAMA. 2005;293(2):194-202.
30. Kijak E, Foust G, Steinman R. Relationship of blood sugar level and leukocytic phagocytosis. South Calif Dent Assn. 1964;32:349-351.
31. Levitan EB, Song Y, Ford ES, et al. Is nondiabetic hypergly-cemia a risk factor for cardiovascular disease? A meta-anal-ysis of prospective studies. Arch Intern Med. 2004;164(19): 2147-2155.
32. Nishida T, Tsuji S, Tsuji M, et al. Oral glucose tolerance test predicts prognosis of patients with liver cirrhosis. Am J
Gastroenterol. 2006;101(1):70-75.
33. Tirosh A, Shai I, Tekes-Manova D, et al. Normal fasting plasma glucose levels and type 2 diabetes in young men. N
Engl J Med. 2005;353(14):1454-1462.
34. Harris JA, Benedict FG. A biometric study of human basal metabolism. Proc Natl Acad Sci USA. 1918;4(12):370-373. 35. Black AE. Critical evaluation of energy intake using the
Goldberg cut-off for energy intake: basal metabolic rate. A practical guide to its calculation, use and limitations. Int J Obes
Related Metab Disord. 2000;24(9).
36. US Department of Agriculture. Scientific Report of the 2015
Dietary Guidelines Advisory Committee. Washington, DC: US
Department of Agriculture; 2015.
37. US Department of Agriculture. Food-A-Pedia. Washington, DC: US Department of Agriculture; 2015.
38. Van Cauter E, Mestrez F, Sturis J, et al. Estimation of insulin secretion rates from C-peptide levels. Comparison of individ-ual and standard kinetic parameters for C-peptide clearance.
Diabetes. 1992;41(3):368-377.
39. Wolever TM, Jenkins DJ. The use of the glycemic index in predicting the blood glucose response to mixed meals. Am J
Clin Nutr. 1986;43(1):167-172.
40. Mikus CR, Oberlin DJ, Libla JL, et al. Lowering physical activity impairs glycemic control in healthy volunteers. Med
Sci Sports Exerc. 2012;44(2):225-231.
41. Heath G, Gavin JR, Hinderliter JM, et al. Effects of exercise and lack of exercise on glucose tolerance and insulin sensitiv-ity. J Appl Physiol. 1983;55(2):512-517.
42. Mikines KJ, Sonne B, Tronier B, et al. Effects of training and detraining on dose-response relationship between glu-cose and insulin secretion. Am J Physiol Endocrinol Metab. 1989;256(5):E588-E596.
43. Zeevi D, Korem T, Zmora N, et al. Personalized nutrition by prediction of glycemic responses. Cell. 2015;163(5):1079-1094. 44. Vrolix R, Mensink RP. Variability of the glycemic response to
single food products in healthy subjects. Contemp Clin Trials. 2010;31(1):5-11.