The threshold-photoelectron spectrum of NH
3R. Locht
Département de Chimie Générale et de Chimie Physique, Institut de Chimie, Bâtiment B6, Université de Liège, Sart-Tilman par, 4000 Liege 1, Belgium
K. Hottmann, G. Hagenow, W. Denzer and H. Baumgartel
Institut fiir Physikalische und Theoretische Chemie, Freie Universität Berlin, Takustrasse 3, W-1000 Berlin 33, Germany
Abstract
Using synchrotron radiation, we have investigated the threshold-photoelectron spectrum of NH3 between 10 and
30 eV photon energy. In contrast to the He(I)-photoelectron spectrum, the threshold-photoelectron spectrum shows three bands between 10 and 21 eV photon energy. The first band is dominated by the vibrational autoionization of the 5sa1, the 6sa1 and the 6pe Rydberg series. Between the first and second band, a new
contribution, starting at 13.26 eV, is assigned to the autoionization of (a) member(s) of Rydberg series converging to the e-l ionization continuum. Its (their) autoionization populates the upper vibrational levels of the NH3+ ( 2A1 ) state. From about 14.5 eV the Ã2E band structures are identified. However, differences between
the à 2E band shapes in the He(I)- and the threshold-photoelectron spectra suggest that very likely autoionization contributions are involved in the latter spectrum. These phenomena could play a role in the production of the NH2
+
and NH+ fragment ions. The last very weak band, at about 25 eV in the photoelectron spectrum, is assigned to the NH3
+
( 2A1) state.
1. Introduction
In the framework of our study devoted to the dissociative ionization of NH3 [1-3], the photoionization
efficiency and the translational energy of NH2 +
and NH+ fragment ions were measured. Weak structures were observed in the photoion yield curve NH2
+
above the onset energy at 15.75 eV [4]. Furthermore, in the energy range of the NH2
+
onset energy, the photoionization efficiency curve of NH3 +
shows several weak structures [4]. To pursue our effort to understand these phenomena, the autoionization in NH3 has been investigated in
detail. For this purpose, first the photoionization efficiency curves of NH3 and its three isotopomers have been
measured in the energy range of the first ionic 2A1 state [5]. The abundant autoionization structure has been
analyzed in terms of Rydberg series converging to the first ionization limit. These superexcited states, characterized by extensive vibrational progressions, autoionize vibrationally. To interprete the autoionization spectrum, it was assumed that autoionization occurs through transitions to the nearest ionization continuum, giving rise to low-energy electrons.
To test this assumption and to investigate the autoionization at higher energies, essentially in the vicinity of the appearance energies of NH2
+
at 15.7 eV [1,4], and of NH+ at 16.9 eV [1,4], the threshold photoelectron spectrum of NH3 has been measured. For comparison, a high-resolution He(I)-photoelectron
spectrum has also been recorded. 2. Experimental
The experimental setup and the experimental conditions used in this work have been outlined earlier [6] and will be described in detail in a forthcoming paper [7]. Only the most salient features will be laid out here.
Both the He(I)- and the threshold-photoelectron spectra were measured by means of the same high-resolution tandem electron spectrometer made of two 180° electrostatic deflectors. The dispersion being 104, a theoretical resolution ∆E/E=0.5% is obtained with 0.5 mm slitwidths.
For the threshold-photoelectron spectra, recorded at a pass energy of 10 V, the resolution (at fwhm) is 25-30 meV as measured on the asymmetric zero-kinetic energy Ar+ (2P
1/2) peak. This signal is used for the
grating of 1200
l
/mm, and used to disperse the synchrotron radiation provided by the electron storage ring BESSY (Berlin). Owing to the low transmission of the Pt-grating, particularly in the 100-120 nm wavelength region, the entrance and the exit slits were set at 200 and 600 µm, respectively. The threshold-photoelectron spectra were normalized to the light intensity measured by a sodium salycilate-sensitized photomultiplier.For the He(I)-photoelectron spectrum, measured at a band pass energy of 1.9 V, a resolution of 15 meV is obtained (at fwhm of the Xe 2P3/2) peak. A microwave discharge lamp is used as a light source. The energy
calibration is the result of a linear regression on the four peaks observed in the spectrum of a NH3, Xe and Kr
mixture. The accuracy is about 2 meV for the first band and somewhat less for the second band.
The ammonia sample used in this work was of commercial quality (Linde A.G.) of 99.95% purity and introduced without further purification. The sample pressure in the ionization region was about 5xl0-6mbar.
Fig. 1. Threshold-photoelectron spectrum of NH3 in the 10-30 eV photon energy range. 2
Al, Ã 2
E and 2A1
refer to the energy ranges of the corresponding ionic states in the He(I)-photoelec-tron spectrum.
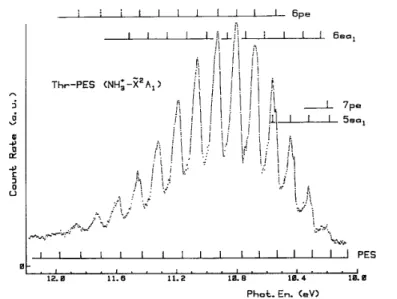
Fig. 2. Threshold-photoelectron spectrum of NH3 in the 10-12 eV photon-energy range. Vertical bars locate the
vibrational progressions of the He(I) potential energy surface (PES) and the 5sa1, 6sa1, 6pe and 7pe Rydberg
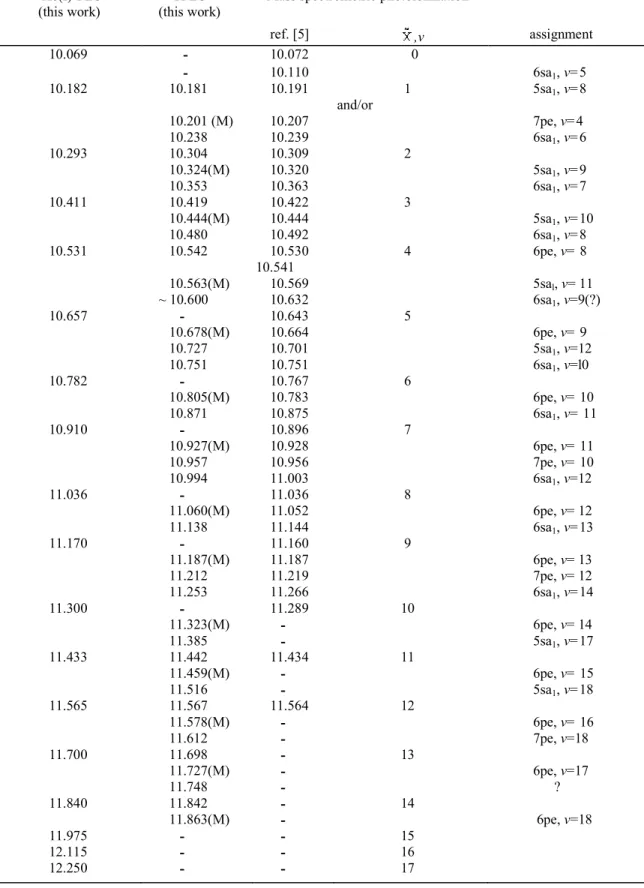
Table 1. Energy (eV) and assignment of the structure observed in the first threshold-photoelectron band of NH3.
Comparison is made with the mass spectrometric photoionization [ 5 ] and He(I )-photoelectron spectroscopic results. The symbol refers to the 2A1 state of NH3
+
. The error in the data of the present PES-work is ±0.002 eV and of the TPES- and Pi-work is ±0.010 eV. (M) refers to the maxima of the peaks
He(I)-PES (this work)
TPES (this work)
Mass spectrometric photoionization
ref. [5] ,v assignment 10.069 - 10.072 0 - 10.110 6sa1, v=5 10.182 10.181 10.191 1 and/or 5sa1, v=8 10.201 (M) 10.207 7pe, v=4 10.238 10.239 6sa1, v=6 10.293 10.304 10.309 2 10.324(M) 10.320 5sa1, v=9 10.353 10.363 6sa1, v=7 10.411 10.419 10.422 3 10.444(M) 10.444 5sa1, v=10 10.480 10.492 6sa1, v=8 10.531 10.542 10.530 10.541 4 6pe, v= 8 10.563(M) 10.569 5sal, v= 11 ~ 10.600 10.632 6sa1, v=9(?) 10.657 - 10.643 5 10.678(M) 10.664 6pe, v= 9 10.727 10.701 5sa1, v=12 10.751 10.751 6sa1, v=l0 10.782 - 10.767 6 10.805(M) 10.783 6pe, v= 10 10.871 10.875 6sa1, v= 11 10.910 - 10.896 7 10.927(M) 10.928 6pe, v= 11 10.957 10.956 7pe, v= 10 10.994 11.003 6sa1, v=12 11.036 - 11.036 8 11.060(M) 11.052 6pe, v= 12 11.138 11.144 6sa1, v=13 11.170 - 11.160 9 11.187(M) 11.187 6pe, v= 13 11.212 11.219 7pe, v= 12 11.253 11.266 6sa1, v=14 11.300 - 11.289 10 11.323(M) - 6pe, v= 14 11.385 - 5sa1, v=17 11.433 11.442 11.434 11 11.459(M) - 6pe, v= 15 11.516 - 5sa1, v=18 11.565 11.567 11.564 12 11.578(M) - 6pe, v= 16 11.612 - 7pe, v=18 11.700 11.698 - 13 11.727(M) - 6pe, v=17 11.748 - ? 11.840 11.842 - 14 11.863(M) - 6pe, v=18 11.975 - - 15 12.115 - - 16 12.250 - - 17
3. Discussion
The threshold-photoelectron spectrum of NH3, in the 10 to 30 eV photon energy range, is displayed in
fig. 1. This spectrum exhibits three bands covering roughly the energy ranges of the 2Al, the à 2
E and the 2A1
states of NH3+ at about 11, 16 and 25 eV, respectively. However, on the low-energy side of the second band, and
starting at 13 eV, a fairly intense shoulder is observed in the threshold-photoelectron spectrum. This feature is absent in the well-known He(I)-photoelectron spectrum of NH3 [8] where the Ã
2
E state is characterized by an adiabatic ionization energy of 14.725 eV [8].
The first threshold-photoelectron band has been recorded on a more expanded energy scale for a detailed analysis (see fig. 2).
Owing to the unfavourable transmission of the Pt-grating in the wavelength region of 100-120 nm, very long measuring times were required to obtain an acceptable signal-to-noise ratio. The general band shape looks quite similar to the He(I)-photoelectron spectrum of the 2A1 state. However, each partially resolved vibrational
band, separated by 120-140 meV intervals, clearly shows fine structures. On the other hand, the photoelectron spectrum recorded at fixed wavelength (65 nm or 19.929 eV) and under the same experimental conditions showed a quasi fully resolved smoothly shaped vibrational structure at 110-120 meV intervals.
The adiabatic ionization transition is not observed in the present work, probably on account of the weakness of the signal, whereas it is observed by photoionization [5], in the He(I)-photoelectron spectrum and in the 65 nm photoelectron spectrum recorded during this work. Above the 0←0 transition at 10.072 eV [5] fourteen structured peaks are detected and the position in energy of these features is listed in table 1 together with the results obtained for the He(I)-photoelectron spectrum.
The first four peaks show a steeply rising shoulder or a slightly resolved peak on the low-energy side. The fairly good agreement between the present measurements and the earlier data [5] allows us to ascribe these features to the production of zero-kinetic energy electrons through the direct ionization of NH3 to NH3
+
( 2Al, v=1 to 4).
However, at 10.181 eV, a contribution of the 5sal, v=8←3a1 cannot be excluded. At 10.542 eV, the assignment is
uncertain: both NH3+ ( 2A1, v=4), measured at 10.531 eV by photoelectron spectroscopy, and the autoionization
of the (6pe, v=8), measured at 10.541 eV [5], could be involved. The remaining structure has to be assigned to autoionization electrons from mainly the 5sa1 and 6sa1 Rydberg states. At 10.201 eV, the 7pe, v=4 is probably
involved.
Up from the fifth peak, broadened and irregularly shaped peaks are observed. Weak shoulders are detected on the high-energy side. For the interpretation and assignment of these features, their energies have to be compared to the photoionization results [5] listed in table 1. In most cases, the good agreement between the present data and the mass spectrometric photoionization measurements indicates autoionization contributions from mainly the 5sa1(v), the 6sa1(v) and 6pe(v) Rydberg states. The position of the maxima of the peaks agrees
with the 6pe vibrational progression from v=9 to v=13. The zero-kinetic-energy electrons corresponding to NH3+
( 2Al, v=5 to 10) are not resolved as clearly as at lower energies. These are probably buried in the signal of the
autoionization electrons.
Above v= 10 in table 1, a number of structures are identified in the threshold-photoelectron spectrum, whereas the autoionization observed in the photoionization work could only be analyzed up to 11.2 eV photon energy [5]. However, to interprète and assign the features above 11.3 eV, data obtained from photoionization will be used, i.e. the term values T characterizing the 5sa1 (T=0.859 eV), 6sa1 (T=0.548 eV), 6pe (T=0.511 eV)
and 7pe (T= 0.353 eV) Rydberg series [5].
As shown in table 1 up from v= 11, besides the direct ionization to NH3+ ( 2A1, v= 11 to 14), which is
again resolved, the maxima of the peaks are well fitted by the 6pe vibrational progression up to v= 18. Less accurately, the remaining structure is assigned to 5sa1 (v=17 and 18) and 7pe (v=18).
The second threshold-photoelectron band, represented on an expanded energy scale in fig. 3, starts at 13.26 eV and extends to 19 eV. As mentioned earlier in this paper the most important difference between the present result and the NH3
+
(Ã2E)-photoelectron band [8] is the broad and quasi-structureless shoulder on the low-energy side of the band starting at 13.26 eV. The NH3
+
[8] or 14.776 eV as measured in this work (marked by a vertical line in fig. 3). Noteworthy is also the difference in band shape. The He(I)-photoelectron spectrum of the Ã2E band shows a low-intensity structure superposed on a fairly flat plateau between 16 and 17.1 eV. In the threshold-photoelectron spectrum, the second band peaks at 16.2 eV and decreases continuously to 19 eV.
Fig. 3. Threshold-photoelectron spectrum of NH3 in the 12-18 eV photon-energy range. Dashed lines indicate
presumed fine structure. Full lines correspond to the energy position of the structures in the Ã2E He(I)-PE band.
The shoulder observed between 13.26 and 14.6 eV could be interpreted in two different ways: (i) the adiabatic ionization of the NH3
+
(Ã2E) state is not reached in the Franck-Condon transition as observed by He(I)-photoelectron spectroscopy or (ii) through autoionization, the NH3
+
( 2A1) state is populated in the upper region
of its potential hypersurface, outside the Franck-Condon region. The shoulder or slope change at about 14.6 eV would argue for the latter interpretation. A more regular band shape would be expected in the case of the former hypothesis. The same kind of observations has already been made in the threshold-photoelectron spectra of N2O
[9] and C2H2 [10].
On the other hand, in both cases the new contribution should be ascribed to autoionization of NH3*
superexcited state(s). This (these) state(s), probably of Rydberg character, should be (a) member(s) of series converging to the e-1 ionization continuum, i.e. 14.725 eV [8] or 14.776 eV was measured in this work. Using the onset at 13.26 eV and the adiabatic ionization energy of the Ã2E state, we obtain a term value T= 1.465 eV, which is compatible with the term value for a 4s Rydberg orbital, i.e. T= 1.532 eV using δ= 1.02 [5].
The existence of superexcited state(s) in this energy range could find strong support by the observation of a fairly intense and broad band between 13.3 and 14.5 eV in the electron energy-loss spectrum (EELS) of NH3
obtained by Furlan [11]. This up-to-now unassigned band is followed by a second broad band of about the same intensity, peaking at 15 eV and decreasing smoothly to 18 eV electron energy. No fine structure is observed in both features, though the electron energy resolution obtained in that work was about 25 meV [11]. If a few discrete structures, i.e. peak and step-like features (see dashed lines in fig. 3) are recognized, the additional band observed in the threshold photoelectron spectrum looks essentially structureless at the present level of resolution. The observation of the band spreading from 14.5 to 18 eV in the electron energy-loss spectrum could suggest its contribution to the threshold-photoelectron spectrum through autoionization to the NH3
+
(Ã2E) state. This phenomenon could be responsible for the particular shape of the Ã2E band in the threshold-photoelectron spectrum. Indeed, subtraction of a signal reproducing the electron energy-loss band from the threshold-photoelectron spectrum, replicates qualitatively the He(I)-photo-electron band shape. Nevertheless, the position in energy of all the features observed in the energy range of 14.7-17 eV (marked by vertical lines in fig. 3) is in very good agreement with those measured in the He(I)-photoelectron spectrum. In fig. 3, the onset energies for NH2+ and NH+ fragment ions are inserted. From the foregoing discussion, autoionization would presumably
contribute to the decay of NH3+ in both channels.
The very weak band observed in the 22-29 eV photon-energy range corresponds to the NH3 +
( 2A1)
band looks structureless also, but its intensity is weaker. Though it is difficult to estimate, this band spreads from about 23-30 eV. About the same range is observed in the He(II)-photoelectron spectrum. Very likely, only direct ionization phenomena are involved in this energy range.
Acknowledgement
We acknowledge the Bundesministerium für Forschung und Technologie and the Fonds National de la Recherche Scientifique for financial support. We are indebted to Dr. H.W. Jochims for his valuable assistance and helpful discussions. One of us (RL) wishes to thank the European Community for a grant (No. GE1-0018-D(B) ) in the framework of its LSI-program.
References
[1]] R. Locht, Ch. Servais, M. Ligot, Fr. Derwa and J. Momigny, Chem. Phys. 123 (1988) 443. [2] R. Locht, Ch. Servais, M. Ligot, M. Davister and J. Momigny, Chem. Phys. 125 (1988) 425. [3] R. Locht and J. Momigny, Chem. Phys. 127 (1988) 435.
[4] R. Locht, G. Hagenow, W. Denzer and H. Baumgärtel, Chem. Phys, to be submitted for publication. [5] R. Locht, B. Leyh, W. Denzer, G. Hagenow and H. Baumgärtel, Chem. Phys. 155 (1991) 407. [6] G. Hagenow, K. Hottmann and H. Baumgärtel, Chem. Phys. Letters 164 (1989) 395. [7] K. Hottmann and H. Baumgartel, to be published.
[8] J.W. Rabalais, L. Karlsson, L.O. Werme, T. Bergmark and K. Siegbahn, J. Chem. Phys. 58 (1973) 3370. [9] T. Baer, P.M. Guyon, I. Nenner, A. Tabche-Fouhaille, R. Botter, L.F.A. Ferreira and T.R.Govers, J. Chem. Phys. 70 (1979) 1585.
[10] D.M.P. Holland, J.B. West, A.C. Parr, D.L. Ederer, R. Stockbauer, R.D. Buff and J.L. Dehmer, J. Chem. Phys. 78 (1983) 124.
[11] M. Furlan, Thèse de doctorat, Université de Liège (1988).