HAL Id: tel-02304602
https://tel.archives-ouvertes.fr/tel-02304602
Submitted on 3 Oct 2019
HAL is a multi-disciplinary open access archive for the deposit and dissemination of sci-entific research documents, whether they are pub-lished or not. The documents may come from teaching and research institutions in France or abroad, or from public or private research centers.
L’archive ouverte pluridisciplinaire HAL, est destinée au dépôt et à la diffusion de documents scientifiques de niveau recherche, publiés ou non, émanant des établissements d’enseignement et de recherche français ou étrangers, des laboratoires publics ou privés.
Anomaly detection and root cause diagnosis in cellular
networks
Maha Mdini
To cite this version:
Maha Mdini. Anomaly detection and root cause diagnosis in cellular networks. Artificial Intelligence [cs.AI]. Ecole nationale supérieure Mines-Télécom Atlantique, 2019. English. �NNT : 2019IMTA0144�. �tel-02304602�
T
HESE DE DOCTORAT DE
L’ÉCOLE NATIONALE SUPERIEURE MINES-TELECOM ATLANTIQUE
BRETAGNE PAYS DE LA LOIRE - IMT ATLANTIQUE
C
OMUEU
NIVERSITEB
RETAGNEL
OIREECOLE DOCTORALE N°601
Mathématiques et Sciences et Technologies de l'Information et de la Communication Spécialité : Informatique
ANOMALY DETECTION AND ROOT CAUSE DIAGNOSIS IN
CELLULAR NETWORKS
Thèse présentée et soutenue à Rennes, le 20/09/2019 Unité de recherche : IRISA
Thèse N° :
2019IMTA0144
(8)Par
Maha Mdini
Rapporteurs avant soutenance :
M. Damien Magoni Professeur, Université de Bordeaux M. Pierre Parrend Professeur, ECAM Strasbourg
Composition du Jury :
Président : M. Eric Fabre Directeur de recherche, INRIA Rennes Examinateurs : M. Damien Magoni Professeur, Université de Bordeaux
M. Pierre Parrend Professeur, ECAM Strasbourg
Mme. Lila Boukhatem Maitre de conférences, Université de Paris XI M. Alberto Blanc Maitre de conférences, IMT Atlantique Directeur de thèse : M. Gwendal Simon Professeur, IMT Atlantique
Maha Mdini: Anomaly Detection and Root Cause Diagnosis in Cellular Networks, PhD Thesis, © October 2, 2019
To my beloved family, Mariem and Hedi, Houda and Mohamed,
Jawher, and Ahlem.
A B S T R A C T
With the evolution of automation and artificial intelligence tools, mobile networks have become more and more machine reliant. Today, a large part of their management tasks runs in an autonomous way, without human intervention. The latest standards of the Third Generation Partnership Project (3GPP) aim at creating Self-Organizing Network
(SON) where the processes of configuration, optimization and healing are fully auto-mated. This work is about the healing process. This question have been studied by many researchers. They designed expert systems and applied Machine Learning (ML) algorithms in order to automate the healing process. However this question is still not fully addressed. A large part of the network troubleshooting still rely on human experts. For this reason, we have focused in this thesis on taking advantage of data analysis tools such as pattern recognition and statistical approaches to automate the troubleshooting task and carry it to a deeper level. The troubleshooting task is made up of three pro-cesses: detecting anomalies, analyzing their root causes and triggering adequate recov-ery actions. In this document, we focus on the two first objectives: anomaly detection and root cause diagnosis.
The first objective is about detecting issues in the network automatically without in-cluding expert knowledge. To meet this objective, we have created an Anomaly Detec-tion System (ADS) that learns autonomously from the network traffic and detects anoma-lies in real time in the flow of data. The algorithm we propose, Watchmen Anomaly Detection (WAD), is based on pattern recognition. It learns patterns from periodic time series and detect distortions in the flow of new data. We have assessed the performance of our solution on different data sets andWADhas been proven to provide accurate re-sults. In addition,WAD has a low computational complexity and very limited memory needs.WAD has been industrialized and integrated in two commercialized products to fill the functions of supervising monitoring systems and managing service quality.
The second objective is automatic diagnosis of network issues. This project aims at identifying the root cause of issues without any prior knowledge about the net-work topology and services. To address this question, we have designed an algorithm, Automatic Root Cause Diagnosis (ARCD) that identifies the roots of network issues.ARCD
is composed of two independent threads: Major Contributor identification and Incom-patibility detection. Major contributor identification is the process of determining the elements (devices, services and users) that are causing the overall efficiency of the net-work to drop significantly. These elements have inefficiency issues and contribute to a non-negligible amount of the traffic. By troubleshooting these issues, the network perfor-mance increases significantly. The second process, incompatibility detection, deals with more fine and subtle type of issues. An incompatibility is an inefficient combination of efficient elements. Incompatibilities cannot be diagnosed by human experts in a reason-able amount of time. We have tested the performance ofARCDand the obtained results are satisfactory. An integration ofARCDin a commercialized troubleshooting product is
WAD and ARCD have been proven to be effective. However, many improvements of these algorithms are possible. This thesis does not address fully the question of self-healing networks. Nevertheless, it contributes to the understanding and the implemen-tation of this concept in production cellular networks.
R É S U M É
Grâce à l'évolution des outils d'automatisation et d'intelligence artificielle, les réseaux mobiles sont devenus de plus en plus dépendants de la machine. De nos jours, une grande partie des tâches de gestion de réseaux est exécutée d'une façon autonome, sans intervention humaine. Les dernières normes de la Third Generation Partnership Project (3GPP) visent à créer des réseaux dont l'organisation est autonome (Self-Organizing Network (SON)). Dans ces réseaux, les procédures de configuration, d'optimisation et de restauration (healing) sont entièrement automatisées. Ce document a pour objet l'étude du processus de restauration. Dans cette thèse, nous avons focalisé sur l'utilisation des techniques d'analyse de données dans le but d'automatiser et de consolider le processus de résolution de défaillances dans les réseaux. Pour ce faire, nous avons défini deux objectifs principaux: la détection d'anomalies et le diagnostic des causes racines de ces anomalies (root cause diagnosis).
Le premier objectif consiste à détecter automatiquement les anomalies dans les réseaux sans faire appel aux connaissances des experts. Pour atteindre cet objectif, nous avons créé un système autonome de détection d'anomalies qui extrait de l'information du trafic réseau et détecte les anomalies en temps réel dans le flux de données. L'algorithme qu'on propose, Watchmen Anomaly Detection (WAD), est basé sur le concept de la reconnaissance de formes (pattern recognition). Cet algorithme apprend le modèle du trafic réseau à partir de séries temporelles périodiques et détecte des distorsions par rapport à ce modèle dans le flux de nouvelles données. Nous avons évalué les perfor-mances de notre solution sur des données venant de différents réseaux. Les résultats fournis par WAD font preuve de précision. Outre cela, WAD est efficace en termes de temps d'exécution et d'utilisation d'espace mémoire. Nous avons intégréWADdans deux produits commercialisés pour contrôler les systèmes de supervision (monitoring systems) ainsi que pour gérer la qualité de service.
Le second objectif de la thèse est le diagnostic des causes racines. Ce projet a pour but la détermination des causes racines des problèmes réseau sans aucune connaissance préalable sur l'architecture du réseau et des différents services. Pour ceci, nous avons conçu un algorithme, Automatic Root Cause Diagnosis (ARCD), qui permet de localiser les sources d'inefficacité dans le réseau.ARCDest composé de deux processus indépendants: l'identification des contributeurs majeurs à l'inefficacité globale du réseau et la détection des incompatibilités. L'identification des contributeurs majeurs consiste à déterminer les éléments (équipements, services et utilisateurs) qui sont à l'origine d'une chute im-portante de l'efficacité globale du réseau. Ces éléments ont une faible performance et contribuent à une quantité de trafic non négligeable. En résolvant ces défaillances, les performances du réseau augmentent considérablement. La détection des incompatibil-ités traite des problèmes plus fins. Une incompatibilité est un ensemble d'éléments fonc-tionnels dont la combinaison est non fonctionnelle. Les incompatibilités ne peuvent pas être identifiées par un expert en un délai raisonnable. Nous avons testé les performances d'ARCD et les résultats qu'on a obtenus sont satisfaisants. L'intégration d'ARCDdans un
produit commercialisé de diagnostic de réseau est en cours et les premiers résultats de tests sont prometteurs.
WAD et ARCD ont fait preuve d'efficacité. Cependant, il est possible d'améliorer ces algorithmes sur plusieurs aspects. Cette thèse ne donne pas une réponse complète à la question de l'auto-restauration (self-healing) dans les réseaux. Néanmoins, elle con-tribue à la compréhension et l'implémentation de ce concept dans les réseaux mobiles opérationnels. Dans ce qui suit, nous décrivons le fonctionnement deWADet d'ARCD.
l a d é t e c t i o n d'anomalies
Nous avons créé une solution de détection d'anomalies qui permet d'identifier les prob-lèmes survenant dans un système de supervision en temps réel et d'une façon dy-namique. Le but duWAD est de détecter des changements brusques tels que les crêtes et les creux dans des séries temporelles périodiques. Ces anomalies peuvent provenir de problèmes de configuration, de pannes d'équipements conduisant à une perte de trafic réseau, d'évènements de masse (tels que les évènements sportifs) à l'origine d'une saturation d'équipements, etc.
Notre solution doit répondre à un ensemble d'exigences spécifiées par les utilisateurs finaux de la solution qui sont les administrateurs systèmes et les techniciens réseaux. En premier lieu, la solution doit être facile à mettre en place, à configurer et à piloter. Deuxièmement, contrairement aux méthodes basées sur des seuils fixes, cette solution doit s'appliquer à des données périodiques. De plus, le modèle généré par l'algorithme doit être ajusté dynamiquement pour refléter l'évolution naturelle du trafic. La solution doit être aussi proactive pour détecter les anomalies en temps réel. En outre, la solution doit être non supervisée: Elle ne doit nécessiter aucun effort humain une fois déployée. La configuration doit être facile. En d'autres termes, la solution doit inclure un nombre réduit de paramètres pouvant facilement être compris et modifiés par les utilisateurs finaux. Outre cela, le but principal de la solution est d'avoir un taux de détection proche de 100% avec un faible taux de faux positifs. Enfin, et ce n'est pas le point le moins important, il est primordial que l'algorithme ait une complexité faible pour que le temps de calcul ainsi que les ressources requises soient raisonnables.
WADrépond aux exigences citées précédemment en analysant des métriques collectées par le système de supervision. Ces métriques peuvent être le débit du trafic en entrée des sondes, le nombre de comptes rendus de communication (Call Data Record (CDR) et Session Data Record (SDR)) en entrée/sortie des équipements de supervisions, le taux de déchiffrement, etc. Ces métriques forment des séries temporelles unidimensionnelles et sont fortement corrélées avec le comportement des abonnées. Ainsi, elles présentent une périodicité journalière avec des pics autour de 12h et 18h.
Pour chaque métrique, WAD génère un modèle de référence (pattern) décrivant l'évolution normale du trafic. Ensuite, il mesure l'écart entre le modèle de référence et les données temps réel. Si l'écart excède le seuil calculé, une alerte est déclenchée au-tomatiquement pour prévenir les administrateurs réseaux de l'apparition d'une anoma-lie. WADcomprend deux phases: une phase d'apprentissage et une phase de détection. La phase d'apprentissage est exécutée une seule fois par jour dans le cas d'une péri-odicité journalière. Dans cette phase, WAD crée un modèle de référence pour chaque métrique et le stocke dans une base de données. Ce modèle sera utilisé durant la phase
de détection, qui s'exécute en continu. Avant de lancer l'algorithme, une étape de pré-traitement (preprocessing) est exécutée dans le but de compléter les valeurs manquantes et de normaliser l'intervalle de temps entre les échantillons consécutifs. Pour ce faire, nous appliquons simplement une interpolation linéaire.
Vu qu'on ne s'intéresse qu'aux données périodiques, la phase d'apprentissage com-mence par un test de la périodicité des donnés. Pour ce faire, nous appliquons la Transformée de Fourier dans le but d'identifier une fréquence dominante. Si une telle fréquence a été détectée, on peut affirmer que la métrique est périodique et que sa péri-ode est égale à l'inverse de la fréquence dominante. Dans ce cas, nous passons à l'étape suivante du WAD qui est le calcul du modèle de référence. Ce calcul se fait en deux temps. Dans un premier temps, on segmente l'historique de la métrique en périodes et on calcule la moyenne point à point de toutes les périodes. Cette moyenne présente un modèle de référence provisoire. On écarte ensuite toutes les valeurs extrêmes par rap-port à ce modèle et on recalcule la moyenne point à point. Cette moyenne représente le modèle de référence final de la métrique. Cette méthode nous permet d'obtenir un modèle de référence non biaisé par les valeurs extrêmes. Nous appliquons, par la suite, une transformation que l'on appelle Difference over Minimum (DoM) caractérisant les ations de la métrique durant une période. Cette transformée permet d'amplifier les vari-ations brusques et de réduire les varivari-ations de faible amplitude. Cette transformée est appliquée également à l'historique des données. En étudiant la distribution de la trans-forméeDoM des données autour de la transformée du modèle de référence, on calcule un seuil de normalité au delà duquel un échantillon est considéré comme très différent du modèle de référence et par la suite anormal. Le modèle de référence et le seuil calculé sont stockés dans la base de données.
Durant la phase de détection, on compare les échantillons arrivant dans le flux de données au modèle de référence construit durant la phase d'apprentissage. Si l'écart dé-passe le seuil calculé durant la phase d'apprentissage, les nouvelles données présentent des anomalies. Pour ce faire, on applique la transforméeDoMaux échantillons arrivant
dans le flux de données. Après, on calcule la distance euclidienne entre la transformée de l'échantillon et la transformée du modèle de référence qu'on extrait de la base de données. Si cette distance est supérieure à la valeur du seuil calculé durant la phase d'apprentissage, une alerte est déclenchée. Le modèle de référence et le seuil sont mis à jour en début de chaque période lors de l'exécution de la phase d'apprentissage.
Nous avons évalué les performances de WAD en utilisant des données provenant de différents réseaux d'opérateurs. Nous avons comparé les performances deWAD à deux algorithmes de référence qui sont Symbolic Aggregate Approximation (SAX) et Principal Component Analysis (PCA). Pour appliqer laPCA qui exige des données multidimension-nelles, nous avons transformé les séries temporelles unidimensionnelles à des séries multidimensionnelles en introduisant des décalages temporels. Dans notre contexte où on traite des séries temporelles collectées par un système de supervision,WADest le seul parmi les algorithmes testés à offrir un bon compromis entre le taux de détection et la précision.
WADa été industrialisé et déployé dans des réseaux opérationnels en tant que plugin de détection d'anomalies dans deux produits commercialisés d'EXFO. Les techniciens réseaux ont confirmé que WADleur a permis de gagner en temps et en productivité et leur a facilité la tâche de dépannage du réseau. En effet,WADautomatise l'analyse
répéti-tive des métriques de supervision, effectuée manuellement par les experts. La précision et la réactivité de cet outil confirme l'avantage de l'utilisation du Machine Learning dans les réseaux mobiles.
l e d i a g n o s t i c d e s c au s e s r a c i n e s
La structure des réseaux mobiles est très complexe. Les opérateurs interfacent des tech-nologies différentes (3G, 4G et 5G). Les équipements utilisés viennent de différents con-structeurs. Les services proposés par les fournisseurs d'accès sont très variés. Les abon-nés utilisent des téléphones différents avec des systèmes d'exploitation variés. Ces faits complexifie le diagnostic des réseaux et la détermination des causes racines des prob-lèmes. Dans leur analyse, les opérateurs se basent sur les comptes rendus de commu-nication pour expliquer les problèmes réseaux. Un compte rendu trace les équipements réseaux impliqués dans la communication, la nature et les caractéristiques du service requêté ainsi que des données liées à l'abonné tel que le type du téléphone utilisé dans la requête. Grâce à ces informations, les experts sont capables de déterminer l’origine des problèmes survenus. Cependant, cette analyse telle que faite aujourd'hui est très fastidieuse. Elle demande une grande expertise, du temps et un effort important de la part des experts. Pour cette raison, des recherches ont été menées pour automatiser cette tâche. Cependant, ces propositions ne répondent pas complètement à cette question.
La solution qu'on propose doit répondre à plusieurs contraintes. En premier lieu, elle doit être applicable à différents types de communications tels que les appels voix et les connections Transmission Control Protocol (TCP). Deuxièmement, la solution doit s'appliquer à des données ayant un nombre de dimensions très élevé. Actuelle-ment, le nombre dimensions d'un CDR peut être supérieur à 100. Ces dimensions sont hétérogènes. On peut distinguer des dimensions de type réseau (les équipements réseaux), des dimensions de types service tels que le type du service ou l'identifiant du fournisseur et des dimensions de types abonné tels que le type du téléphone et la version du système d'exploitation. La solution doit prendre en considération les dépen-dances entre différentes dimensions. Ces dépendépen-dances sont expliquées par l'architecture du réseaux et des différents services. Outre cela, un problème réseaux n'est pas forcé-ment expliqué par un seul éléforcé-ment mais pourrait résulter d'une combinaison d'éléforcé-ments comme dans le cas des incompatibilités. Enfin, notre solution doit hiérarchiser les dif-férents problèmes selon leurs impacts et ne retourner que les plus pertinents.
On peut résumer les objectifs de notre solution,ARCDen trois points. Le premier point concerne l'identification des contributeurs majeurs. On appelle contributeur majeur tout élément à l'origine d'une baisse importante de l'efficacité globale du réseau. Par exem-ple, un Mobility Management Entity (MME) non fonctionnel peut bloquer la transmission d'un grand nombre d'appels. Une fois identifiés, les contributeurs majeurs peuvent être dépannés par des experts. Le deuxième point concerne la détection des incompatibil-ités. Une incompatibilité est un ensemble d'éléments fonctionnels lorsqu'ils sont pris séparément et non fonctionnels quand ils sont combinés. Citons à titre d'exemple une version d'un système d'exploitation incompatible avec un service à cause d'un bug dans l'implémentation de ce service. Le dernier objectif de notre solution est la création de classes d'équivalence. Une classe d'équivalence est un ensemble d'éléments liés au même problème. La corrélation des éléments d'une même classe d'équivalence peut provenir
de l'architecture du réseau. Après avoir identifié les contributeurs majeurs et les incom-patibilités, une analyse statistique des dépendances nous permet de créer différentes classes d'équivalence. L'étude de ces classes nous permet de réduire chaque problème à sa cause racine.
La détermination des contributeurs majeurs se fait en cinq étapes. On commence par la labellisation des comptes rendus de communication s'ils ne sont pas labellisés. Pour ceci, on se base sur des critères liés à la qualité de service. Par exemple, si le temps de réponse est supérieur à un seuil minimal, on considère que la connexion a échoué. Après, on identifie les éléments qui sont suffisamment présents dans les comptes ren-dus des communications échoués et le sont beaucoup moins dans les communications correctement abouties. Pour ce faire, nous avons créé un système de classement (scor-ing system) qui permet d'identifier les éléments les plus importants. Par la suite, ces éléments sont groupés dans des classes d'équivalence. Une classe d'équivalence est un ensemble d'éléments impliqués dans les mêmes communications. On explore, ensuite, les dépendances hiérarchiques entre différentes classes d'équivalence et on produit un graphe de dépendances. Pour créer le graphe, on connecte les classes selon leurs dépen-dances hiérarchiques. Pour rendre le graphe lisible et exploitable, on supprime les liens superflus entre les nœuds (les liens qui portent une information redondante). Pour ceci, on utilise l'algorithme de parcours en profondeur pour déterminer tous les chemins pos-sibles entre nœuds et on ne garde que le chemin le plus long. En utilisant cette méthode, on supprime les redondances tout en gardant la totalité de l'information. On termine par l'élagage du graphe de façon à ne garder que les causes racines des problèmes réseaux. Pour identifier les incompatibilités, on procède en six étapes. On commence par la la-bellisation des comptes rendus de communication s'ils ne sont pas labellisés. Après, on parcourt tous les comptes rendus de communication pour identifier les combinaisons de deux éléments incompatibles. En d'autres termes, on cherche les éléments qui ont cha-cun un taux d'échec global faible, mais dont la combinaison a un taux d'échec important. L'étape suivante consiste à écarter les fausses incompatibilités. Une fausse incompatibil-ité est une combinaison ayant un taux d'échec important. Cependant, ce taux d'échec est expliqué par la présence d'un troisième élément non fonctionnel dans les comptes rendus contenant la combinaison. Par la suite, pour chaque élément présent les com-binaisons restantes, on identifie l'ensemble d'éléments qui sont incompatibles avec lui. Puis, on groupe ces éléments dans des classes d'équivalence. Comme pour les contribu-teurs majeurs, on crée un graphe de dépendance et on procède à l'élagage pour ne garder que les racines des incompatibilités.
Nous avons évalué les performances d'ARCD dans la détermination des contributeurs majeurs et des incompatibilités. Les résultats sont prometteurs. Nous avons testé notre solution sur des données réelles venant de trois opérateurs différents. Avec les deux processus de détection de contributeurs majeurs et d'incompatibilités, nous avons pu expliquer respectivement 95%, 96% et 72% des échecs d'appels et de connexions TCP
rencontrés par les abonnés des trois opérateurs. La précision dans le diagnostic des con-tributeurs majeurs est supérieure à 0.9 dans les trois cas et celle des incompatibilités est supérieure à 0.86. Nous avons comparé ARCD avec l'algorithme Learning from Examples Module, version 2 (LEM2) et nous avons conclu qu'ARCD est plus performant en termes de précision et de couverture de problèmes.ARCDest en cours d'industrialisation pour être intégré dans une solution d'analyse de performance de réseaux. ARCD sera aussi
connecté àWADpour que le processus de détection d'anomalies déclenche automatique-ment le diagnostic des causes racines.
P U B L I C AT I O N S
M.Mdini, G.Simon, A.Blanc, and J.Lecoeuvre. Automatic Root Cause Diagnosis in Telecommu-nication Networks. Patent Pending, 2018.
M.Mdini, G.Simon, A.Blanc, and J.Lecoeuvre, ARCD: a Solution for Root Cause Diagnosis in Mobile Networks, in CNSM, 2018.
M.Mdini, A.Blanc, G.Simon, J.Barotin, and J.Lecoeuvre, Monitoring the Network Monitoring System: Anomaly Detection using Pattern Recognition, in IM, 2017.
A C K N O W L E D G E M E N T S
I would like to thank, first and foremost, Professor Gwendal Simon and Professor Al-berto Blanc without whom this thesis could not be done. During three years, they were guiding me through each step of the PhD and supporting me with every single task I had to accomplish. I am grateful to them for their help with the design and the valida-tion of technical soluvalida-tions. I would also thank them for their patience while reviewing and correcting my documents. I have learned a lot from their technical knowledge and personal qualities and I feel honored for the great opportunity I had to work with them. I would like also to thank IMT Atlantique for opening its doors to me for both my engineering degree and my PhD.
I had also the privilege to conduct my PhD in EXFO, the company which offered the perfect environment for this work. I would like to thank the members of my team, especially, Mr. Sylvain Nadeau, Mr. Loïc Le Gal and Mr. Jérôme Thierry for their support and help during these three years. I could not forget to thank Mr. Julien Lecoeuvre and Mr. Jérôme Barôtin with whom I worked during the first part of my PhD. I am also grateful to the Data Science team, namely, Mr. Nicolas Cornet, Mr. Fabrice Pelloin and Mr. Thierry Boussac as well as the Support team for their help on validating the thesis results. I would like to thank as well Ms. Isabelle Chabot for her help and assistance on the documentation aspect. Finally, I would like to thank all EXFO staff for their collaboration and for the great moments we have shared.
I would conclude with thanking my dear family members for their constant love and support. They are the best gift I have ever had.
C O N T E N T S i b a c k g r o u n d 1 1 i n t r o d u c t i o n 3 1.1 Motivation . . . 3 1.2 Context . . . 4 1.3 Objectives . . . 5 1.4 Challenges . . . 5 1.5 Contribution . . . 6 1.6 Document structure . . . 7 2 t e l e c o m m u n i c at i o n b a c k g r o u n d 9 2.1 Cellular networks . . . 9 2.1.1 Architecture . . . 9 2.1.2 Procedures . . . 11 2.1.3 External networks . . . 11
2.1.4 Cellular network requirements . . . 12
2.2 Monitoring systems . . . 12 2.2.1 Main functions . . . 12 2.2.2 Structure . . . 13 2.2.3 Data types . . . 14 2.2.4 Requirements . . . 14 2.2.5 Limitations . . . 14 3 d ata a na ly s i s b a c k g r o u n d 17 3.1 Time series . . . 17 3.1.1 Definitions . . . 17
3.1.2 Seasonal time series . . . 17
3.1.3 Time analysis . . . 18
3.1.4 Frequency analysis . . . 19
3.1.5 Forecasting in time Series . . . 21
3.1.6 Patterns in time series . . . 22
3.2 Multidimensional analysis . . . 22
3.2.1 Numerical vs categorial data . . . 22
3.2.2 Sampling . . . 23 3.2.3 Dimensionality reduction . . . 23 3.2.4 Statistical Inference . . . 24 3.2.5 Machine Learning . . . 24 3.2.6 Validation aspects . . . 25 ii a n o m a ly d e t e c t i o n 27 4 s tat e o f t h e a r t 29 4.1 Problem statement . . . 29 4.2 Techniques . . . 30 4.2.1 Knowledge based . . . 31
xviii c o n t e n t s 4.2.2 Regression . . . 31 4.2.3 Classification . . . 32 4.2.4 Clustering . . . 33 4.2.5 Sequential analysis . . . 34 4.2.6 Spectral Analysis . . . 35 4.2.7 Information Theory . . . 36 4.2.8 Rule Induction . . . 36 4.2.9 Hybrid Solutions . . . 36 4.3 Evaluation Methods . . . 38 4.3.1 Confusion Matrix . . . 38 4.3.2 Evaluation Metrics . . . 38 4.3.3 Evaluation Curves . . . 39 4.3.4 Validation Techniques . . . 41 4.4 Summary . . . 41 5 p r o p o s e d a l g o r i t h m: wad 45 5.1 Introduction . . . 45 5.1.1 Motivation . . . 45 5.1.2 Objective . . . 45 5.1.3 Requirements . . . 46 5.1.4 Data types . . . 46
5.2 The WAD Algorithm . . . 47
5.2.1 Learning Phase . . . 47
5.2.2 Detection Phase . . . 52
5.3 Validation Tests . . . 52
5.3.1 Parameters Setting . . . 52
5.3.2 Accuracy . . . 53
5.3.3 Memory and Computation Needs . . . 57
5.3.4 Discussion . . . 58
6 i n d u s t r i a l i z at i o n 59 6.1 Monitoring the monitoring system: Nova Cockpit™ . . . 59
6.1.1 The scoping phase . . . 59
6.1.2 The deployment phase . . . 61
6.1.3 Sample Use Case . . . 62
6.2 Service Quality Management: Nova Analytics™ . . . 65
6.2.1 The scoping phase . . . 65
6.2.2 The deployment phase . . . 66
6.3 Anomaly detection Timeline . . . 68
6.4 Conclusion . . . 69 iii r o o t c au s e d i a g n o s i s 71 7 s tat e o f t h e a r t 73 7.1 Problem statement . . . 73 7.2 Analysis scope . . . 74 7.3 Analysis approaches . . . 75 7.4 Feature dependency . . . 75
c o n t e n t s xix 7.4.2 Dependency-Based Diagnosis . . . 76 7.5 Techniques . . . 77 7.5.1 Expert Systems . . . 77 7.5.2 Machine Learning . . . 77 7.6 Recapitulation . . . 78 8 p r o p o s e d a l g o r i t h m: arcd 81 8.1 Introduction . . . 81
8.2 Data Model and Notation . . . 83
8.2.1 Data Records . . . 83
8.2.2 Notation . . . 84
8.3 Objectives of the Diagnostic System . . . 85
8.3.1 Major Contributors . . . 85
8.3.2 Incompatibilities . . . 86
8.3.3 Equivalence Classes . . . 86
8.4 Major Contributor Detection . . . 87
8.4.1 Labeling . . . 87
8.4.2 Top Signature Detection . . . 88
8.4.3 Equivalence Class Computation . . . 88
8.4.4 Graph Computation . . . 89
8.4.5 Graph Pruning . . . 90
8.5 Incompatibility Detection . . . 92
8.5.1 Identifying incompatible signatures . . . 93
8.5.2 Filtering False Incompatibilities . . . 93
8.5.3 Equivalence Class Computation . . . 94
8.5.4 Graph Computation . . . 94
8.5.5 Pruning . . . 94
8.6 Evaluation . . . 95
8.6.1 Data Sets . . . 95
8.6.2 Expert Validation . . . 96
8.6.3 Major Contributor Detection . . . 96
8.6.4 Incompatibility Detection . . . 100
8.6.5 Comparison with the LEM2 Algorithm . . . 102
9 i n d u s t r i a l i z at i o n 107 9.1 Online root cause diagnosis: Nova Analytics™ . . . 107
9.1.1 The scoping phase . . . 107
9.1.2 Preliminary results . . . 107
9.2 A complete Big Data troubleshooting solution: WAD-ARCD . . . 110
9.3 Root cause diagnosis timeline . . . 110
9.4 Conclusion . . . 110
iv c o n c l u s i o n 111 10 r e s u lt s 113 10.1 Contributions . . . 113
10.1.1 Anomaly detection . . . 113
10.1.2 Root cause diagnosis . . . 113
xx c o n t e n t s
10.3 Commercialized products . . . 114
11 f u t u r e w o r k 117
11.1 Potential improvements . . . 117
11.2 Next steps . . . 117
11.3 Open research questions . . . 118
v a p p e n d i x 119
a d e v e l o p m e n t e n v i r o n m e n t 121
a.1 General description . . . 121
a.2 Python libraries . . . 121
a.3 Big Data environment . . . 121
b s a x a l g o r i t h m 123
b.1 Piecewise Aggregate Approximation . . . 123
b.2 Transformation into symbols . . . 123
b.3 SAX applications . . . 123 c p c a a l g o r i t h m 125 c.1 Steps . . . 125 c.2 Applications . . . 125 d l e m 2 a l g o r i t h m 127 d.1 Steps . . . 127 d.2 Applications . . . 127 b i b l i o g r a p h y 129
L I S T O F F I G U R E S
Figure 1 SONframework: Main functions . . . 4
Figure 2 Cellular network infrastructure showingRANand core elements . 10
Figure 3 An example of time series: The CDR number in an interface of a monitoring probe over time . . . 18
Figure 4 The decomposition of a time series into its trend, seasonal and residual components. . . 18
Figure 5 Time seriesACF . . . 19
Figure 6 Time seriesPACF . . . 20
Figure 7 Time seriesFFT . . . 20
Figure 8 Examples of hybridADSwith a serial topology . . . 37
Figure 9 HybridADS: Parallel topology . . . 37
Figure 10 An example of a ROCcurve . . . 40
Figure 11 An example of a PRcurve . . . 40
Figure 12 The different anomaly types . . . 46
Figure 13 Overall Architecture:MMEmonitoring . . . 47
Figure 14 The CDRnumber at an output interface of a hub . . . 48
Figure 15 The learning phase for a metricRGRi . . . 48
Figure 16 The FFTof the metric in Figure14 . . . 49
Figure 17 Daily pattern: Rough pattern and anomly free pattern after re-moving extreme values. . . 50
Figure 18 DoM transform applied to the metric in Figure14. . . 51
Figure 19 The histogram of distances between the transformed training data and the transformed pattern. . . 51
Figure 20 Detection phase for the kth sample of theRGRi. . . 52
Figure 21 Detection of two anomalies in the 30th day of the metric in Fig-ure14. . . 53
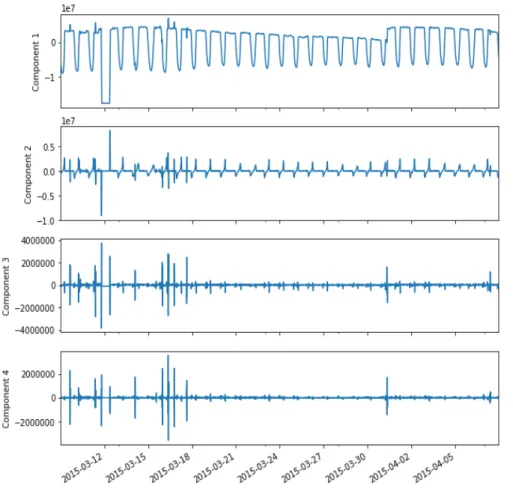
Figure 22 PCAdecomposition applied to the metric in Figure14 . . . 54
Figure 23 SAX applied to the metric in Figure14 . . . 54
Figure 24 The PRcurve of SAXresults . . . 56
Figure 25 The PRcurve of PCAresults . . . 56
Figure 26 The PRcurve of WADresults . . . 56
Figure 27 Anomalies in the number of Tuples – probe output . . . 57
Figure 28 EXFO monitoring system. Cockpit™ collects data from Neptune™ probes, Nephub™, and Mediation™ interfaces. . . 60
Figure 29 Cockpit™ capture of a Neptune™ probe Input Rate . . . 63
Figure 30 Cockpit™ capture of Nephub™CDRInput . . . 63
Figure 31 Cockpit™ graph of the deciphering rate of a Neptune™ probe. An abnormal value drop. . . 64
Figure 32 Cockpit™ capture of a Neptune™ probe input rate. A zoom on a detected anomaly. . . 64
xxii List of Figures
Figure 34 Anomaly Logs in Nova Analytics™ detected byWAD . . . 66
Figure 35 HTTPmonitoring . . . 67
Figure 36 Youtube monitoring . . . 68
Figure 37 The timeline of Watchmen Anomaly Detection (WAD) develop-ment and industrialization . . . 68
Figure 38 System architecture of anLTEnetwork with a subset of the moni-tored elements . . . 81
Figure 39 Major contributor detection steps . . . 87
Figure 40 Examples of multiple paths between nodes containing signatures 90
Figure 41 Pruning Scenario . . . 91
Figure 42 Incompatibility detection steps . . . 92
Figure 43 System Architecture . . . 95
Figure 44 Box-plots of failure ratio and signature proportion as function of scoring parameter for Sets 1 and 3 . . . 97
Figure 45 Pruned Graph of Major Contributors for Set 2 . . . 99
Figure 46 Incompatibilities pruned graph of the 1-signature (content_category, 795f) . . . 101
Figure 47 ARCD vsLEM2: Output from Set 3 . . . 104
Figure 48 Overview of major contributors toKPIdegradation on User Plane 108
Figure 49 Multi-level view of major contributors toKPIdegradation on User Plane . . . 109
Figure 50 Incompatibilities behind latency issues on User Plane . . . 109
Figure 51 A troubleshooting solution with WADandARCD . . . 110
Figure 52 The timeline of Automatic Root Cause Diagnosis (ARCD) develop-ment and industrialization . . . 110
L I S T O F TA B L E S
Table 1 Feature selection techniques by input/output type. . . 24
Table 2 Confusion matrix. . . 38
Table 3 Comparison of anomaly detection approaches . . . 43
Table 4 Lab Evaluation Results . . . 55
Table 5 WAD CPUUsage . . . 57
Table 6 WADMemory Usage . . . 58
Table 7 Cockpit™ Metrics by monitoring component. . . 62
Table 8 Root cause diagnosis: main papers . . . 80
Table 9 Example of a Data Record on a few features . . . 83
Table 10 Validation Data Sets . . . 96
Table 11 Major contributor results . . . 98
Table 12 Incompatibility results . . . 100
Table 13 LEM2example rules . . . 103
Table 14 LEM2accuracy results . . . 103
A C R O N Y M S
3GPP Third Generation Partnership Project
5G Fifth Generation of Cellular Network Technology ACC Accuracy
ACF Autocorrelation Function ADS Anomaly Detection System AI Artificial Intelligence
AIC Akaike Information Criterion
ANOVA Analysis of Variance
AR Autoregressive
ARCD Automatic Root Cause Diagnosis
ARIMA Autoregressive Integrated Moving Average
ARMA Autoregressive Moving Average ARP Address Resolution Protocol AUC Area Under the Curve BDR Bearer Data Record BI Business Intelligence BSC Base Station Controller
BSD Berkeley Software Distribution BTS Base Transceiver Station CDR Call Data Record
CP Control Plane
CPU Central Processing Unit CS Circuit Switched
CSFB Circuit Switched Fallback CSV Comma Separated Values
a c r o n y m s xxv
DDoS Distributed Denial of Service DET Detection Error Tradeoff DoM Difference over Minimum DPI Deep Packet Inspection DSL Digital Subscriber Line DWT Discrete Wavelet Transform E2E End to End
EC Equivalence Class EF Extra Features
EM Expectation Maximization
eNodeB Evolved Node B
EPC Evolved Packet Core
EUTRAN Evolved Universal Terrestrial Radio Access Network
EV Extra Values
FFT Fast Fourier Transform FN False Negative
FNR False Negative Rate FP False Positive FPR False Positive Rate FTP File Transfer Protocol
GERAN GSM EDGE Radio Access Network
G Gain
GGSN Gateway GPRS Support Node GMM Gaussian Mixture Model GUI Graphical User Interface GUI Graphical User Interface
HDFS Hadoop Distributed File System HLR Home Location Register
xxvi a c r o n y m s
HPC High Performance Computing HSS Home Subscriber Server HTTP Hypertext Transfer Protocol
IDE Integrated Development Environment I Inefficiency
IMEI International Mobile Equipment Identity IM Instant Messaging
IMSI International Mobile Subscriber Identity IMS IP Multimedia Subsystem
IMT Institut Mines Telecom IoT Internet of Things IP Internet Protocol
IPTV Internet Protocol Television
IPython Interactive Python
ISP Internet Service Provider IT Information Technology KNN K Nearest Neighbors KPI Key Performance Indicator LDA Linear Discriminant Analysis
LEM2 Learning from Examples Module, version 2 LSTM Long Short-Term Memory
LTE Long Term Evolution M2M Machine to Machine MA Moving Average MCC Mobile Country Code
MIT Massachusetts Institute of Technology ML Machine Learning
MME Mobility Management Entity MMS Multimedia Messaging Service
a c r o n y m s xxvii
MNC Mobile Network Code
MRLS Multiscale Robust Local Subspace MSC Mobile Services Switching Centre
MSISDN Mobile Station ISDN Number
OS Operating System P2P Peer to Peer
PAA Piecewise Aggregate Approximation PACF Partial Autocorrelation Function PCA Principal Component Analysis PGW Packet data network Gateway PIP PIP Installs Packages
PLMN Public Land Mobile Network PPV Positive Predictive Value PR Precision-Recall
PS Packet Switched QCI QoS Class Identifier QoE Quality of Experience QoS Quality of Service RAN Radio Access Network RAT Radio Access Technology RDR Residual Data Rate
REST Representational State Transfer RGR Record Generation Report RI Residual Inefficiency RL Reinforcement Learning RNC Radio Network Controller RNN Recurrent Neural Network ROC Receiver Operating Characteristic RPCA Robust Principal Component Analysis
xxviii a c r o n y m s
SAX Symbolic Aggregate Approximation SDR Session Data Record
SGSN Serving GPRS Support Node SGW Serving Gateway
SIP Session Initiation Protocol SMS Short Messaging Service SMTP Simple Mail Transfer Protocol
SNMP Simple Network Management Protocol SOM Self-Organizing Maps
SON Self-Organizing Network SQM Service Quality Management SSL Secure Sockets Layer
SVM Support Vector Machine SVR Support Vector Regression SV Software Version
TAC Type Allocation Code
TCPDR TCP Data Record
TCP Transmission Control Protocol TLS Tranport Layer Security TNR True Negative Rate TN True Negative TPR True Positive Rate TP True Positive UE User Equipment
UMTS Universal Mobile Telecommunications System UP User Plane
USSD Unstructured Supplementary Service Data
UTRAN Universal Terrestrial Radio Access Network
a c r o n y m s xxix
VLR Visitor Location Register VoIP Voice over IP
VoLTE Voice over LTE
VoWIFI Voice over WIFI
WAD Watchmen Anomaly Detection WiFi Wireless Fidelity
Part I
B A C K G R O U N D
In this part, we give an overview of the main topic of thesis. We present its context, objectives along with the related challenges. Then, we go briefly through some basic notions in telecommunication and data analysis, which are essential to the understanding of the technical content of the thesis.
1
I N T R O D U C T I O N1.1 m o t i vat i o n
The Long Term Evolution (LTE) mobile networks provide very diverse services including classical voice calls, video conferences, video gaming, social networking, route planning, email, and file transfer, to name a few. With the Fifth Generation of Cellular Network Technology (5G), mobile operators aim to extend their activities to provide more
ser-vices related to health care, public and private transport, and energy distribution. The performance of mobile networks has also significantly increased and mobile operators still work towards attaining higher bandwidth, lower latency, denser connections, and higher speed.
To provide various services with high Quality of Service (QoS), researchers in the area of cellular networks introduced new paradigms to ease the management tasks and the implementation of new functionalities. One of the key concepts introduced inLTEand 5G is the concept of Self-Organizing Networks (SONs) [38], [64]. The idea of self-organization
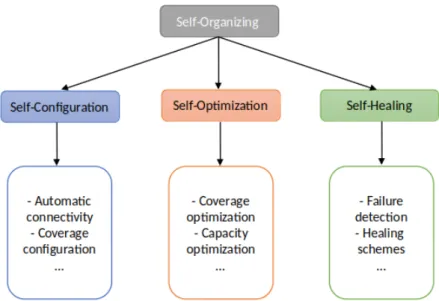
refers to the automation of the processes that are usually conducted by experts and technicians. We identify three main functionalities related to SONs: self-configuration, self-optimization, and self-healing. Figure1 illustrates this analysis. Self-configuration
aims at the automation of the installation procedures. For instance, a new deployed Evolved Node B (eNodeB) can be automatically configured based on its embedded soft-ware and the data downloaded from the network without any human intervention. Self-optimization is the process of the automatic tuning of the network based on performance measurements. Self-healing refers to detecting network issues and solving them in an automatic and dynamic manner. In this thesis, we focus on this latter aspect. We conduct a study of self-healing techniques and propose a potential solution [98], [99].
The healing process is made up of four main tasks [75]. It starts with the detection of
an issue in the network such as the degradation of a Key Performance Indicator (KPI).
Once a problem is detected, one should carry out an in-depth analysis to diagnose the problem and find its root causes. Depending on the nature of the problem, two cases are possible. If the problem can be solved within a short time (few minutes), the recovery process is triggered and there is no need for compensation. On the contrary, if the re-covery process is slow, compensation measures are taken to guarantee the availability of the network during the recovery process. The compensation and the recovery processes depend on the accuracy of the detection and the diagnosis. The main topic of this thesis is related to the two first phases of the healing process: the detection and the diagnosis. We aim to create an autonomous system that detects anomalies in real time and iden-tifies their root causes in order to help experts to decide about the adequate recovery actions.
The detection of network issues is a part of the daily tasks of network technicians and administrators. To identify issues they check network metrics andKPIsto make sure their values are within the normal range. Detecting anomalies on metrics with constant values
4 i n t r o d u c t i o n
Figure 1:SONframework: Main functions.
can be easily automated. An expert may set a threshold and an alarm is raised every time the threshold is exceeded. However, in the case of non-constant metrics, network technicians analyze manually the different curves and distinguish normal patterns from anomalous ones. The automation of this task is not straightforward. For this reason, we have focused in this thesis on detecting anomalies using pattern recognition.
The diagnosis of network issues is a complex task. It requires a good knowledge of the network architecture and services. This task is carried out by telecommunication experts who analyze network logs to localize issues and identify their origins. Identifying the root of an anomaly is essential for an efficient troubleshooting. However, this process is not simple. The same problem may cause multiple dysfunctions in different points of the network. Thus, experts have to identify these failure points and point among them the one originating the issue. With the growing complexity of today’s networks, this process can no longer be handled by human experts, nor can it be performed by a simple expert system implementing a set of hard coded rules. For this reason, we focused on creating a diagnosis system based on data mining.
1.2 c o n t e x t
The present work has been carried out in the context of a partnership between Institut Mines Telecom (IMT) Atlantique and EXFO Incorporated. The thesis has been developed in EXFO under the academic supervision of the university. This thesis is based on real world data from different mobile networks. The prototypes developed are validated by end users (support technicians and telecommunication experts) and tested in live networks. The aim of this thesis is to create industrial products to automate network troubleshooting. It aims also to contribute to the study and development of the new generation ofSONsby the integration of statistics and Machine Learning (ML) tools. This
1.3 objectives 5
1.3 o b j e c t i v e s
Our goal is to study and propose techniques to design self-healing networks. The pro-posed techniques are based on data analysis concepts. In other terms, we work on al-gorithms allowing the extraction of information relevant to the troubleshooting process from the large amount of data produced by the cellular network. As stated earlier, we focus here on the detection and diagnosis tasks of the self-healing process. So this thesis has two major objectives:
• Anomaly detection: Our goal is to detect anomalies in the network in real time. The detection should be automatic and unsupervised. The proposed solution should learn from previous data without including any expert rules. It should also be dynamic and capable to adapt to the network evolution. Furthermore, the pro-posed solution should be efficient (having low error rate with few computational resources). In practical terms, the solution should be implemented as a module of a monitoring system and has to process the metrics it creates. To detect network issues, the solution should detect the anomalous patterns in the curves represent-ing the network metrics. Once an anomaly is detected, an alarm is raised to notify the network administrator about the details of the issue.
• Root cause diagnosis: Our objective is to create a solution that analyses the End to End (E2E) cellular network and find the roots of the issues within the network. This solution should be unsupervised and automatic. It has to identify major high-impact causes at the first place. Localizing less important causes with lower high-impact is also part of the study. The solution should function without any prior knowledge of the network topology and its computational complexity should be reasonable. The solution for root cause diagnosis should be part of the monitoring system. It should be connected to the anomaly detection module. Once an anomaly is detected, the diagnosis could be automatically triggered. The result of the analysis should contain all the information needed for the troubleshooting process. The information should be presented in a way that is easily understandable by the experts.
For each of the two objectives, we aim to create a prototype and validate it in both a lab environment and a real network. Once the solution is validated, we aim to transform it into an industrial product that will go to the market as part of EXFO solutions.
1.4 c h a l l e n g e s
Creating an automatic solution for network anomaly detection is challenging in two ma-jor aspects: data handling and integration within the monitoring system. The first aspect is related to data preparation and processing. The metrics of the monitoring system can be either constant, periodic, or chaotic. As our objective here is to address the issue of anomaly detection in periodic data, the solution has to automatically identify the types of the metrics and process only periodic ones. Periodicity detection is not easy, especially in irregular metrics where the interval between different samples is not constant. This is always the case in real monitoring systems where the data measurements are controlled
6 i n t r o d u c t i o n
by queuing systems. Moreover, the solution has to learn a short history of data as mon-itoring systems are designed to erase data regularly. The solution has also to adapt to the natural growth of the traffic. This growth should be integrated into the model of data created by the solution in order to prevent it from being detected as an anomaly. Another challenging fact is the various patterns of anomalies. The solution has to detect new anomaly patterns that were not predefined during the implementation. The second aspect concerns the integration of the solution in the monitoring system. The solution should be transparent and not interfere with any other monitoring process. Thus, it has to have few computational and memory needs. The solution should not require any post implementation effort from experts. Consequently, all the detection steps should be fully automatic. Finally, the solution has to provide accurate results which is not easy with few calculation resources.
The diagnosis task demands a deep analysis of the data logs to identify the root cause of issues. Automating this process is challenging as it requires both domain knowledge and analysis capabilities from experts. The network architecture is needed to diagnose network issues. However defining it manually requires a large effort prior to the in-stallation of the solution. Added to that, this information has to be updated each time the architecture is modified. To overcome this difficulty, the architecture can be dis-covered automatically based on the data. However, the inference of such complicated structure may require a lot of calculations. The network architecture is not the only information needed for the analysis. The structure of services provided by Internet Ser-vice Providers (ISPs) and web content providers is also required. Besides, the analysis of communication logs to extract information about issues is challenging in multiple aspects. The number of communication logs is huge, each having a large number of features. The features may be related. There is no dependency chart defining explicitly the relations between different features. Another challenging point is the large variety of network issues. Some issues may be interrelated and thus more complicated to be diagnosed automatically. The network issues do not have the same importance and thus a prioritization task must be included within the diagnosis process.
1.5 c o n t r i b u t i o n
This thesis contributes to the research and industry in the field of network monitoring. As stated, we address here two major questions related to the concept of self-healing networks. The first subject is the detection of anomalies in network metrics. In this thesis, we propose a fully unsupervised solution, Watchmen Anomaly Detection (WAD) to this question. This solution has been industrialized and added to two monitoring tools to alleviate the load of network administrators. The second question is diagnosis of the root causes of network issues. Our solution, Automatic Root Cause Diagnosis (ARCD) is unsupervised and implements a large part of telecommunication experts tasks.
ARCDanalyses communication logs and creates an overview of issues at multiple levels. This fact reduces the expert role to validating the output ofARCD before triggering the adequate healing scheme. The industrialization ofARCD is ongoing and the first results are promising.
1.6 document structure 7
1.6 d o c u m e n t s t r u c t u r e
This document is composed of three parts. The first part is an introductory part. It con-tains the introduction, a chapter about the telecommunication background and another one on the data analysis background. In the telecommunication background, we give an overview of cellular networks and monitoring systems. In the data analysis chapter, we introduce time series and multidimensional analysis as one needs some basic notions in these topics to understand the remainder of the thesis. The second part is about the first objective of the thesis: anomaly detection. In this part, we start by a study of the state of the art. Then, we present the theoretical and practical results of the solution we propose. We finish by a brief description of the industrialization process of our solution. The third part is about the second objective of the thesis: root cause diagnosis. As for the previous objective, we review the state of the art, introduce our solution and describe the industrialization process. In the conclusion, we recall the main results and give some potential future works.
2
T E L E C O M M U N I C AT I O N B A C K G R O U N DIn this chapter, we introduce some telecommunication concepts relevant to the remain-der of the thesis. As stated in the objective of the thesis, our aim is to create an anomaly detection and root cause diagnosis solution in cellular networks. We start by giving an overview of today’s cellular networks architecture and services. Then, we highlight their complexity and list their requirements in terms of performance and reliability. There-after, we give a short overview of the state of the art of monitoring systems and we detail some of their functions. We finish by highlighting the gap between the required capa-bilities of monitoring systems and their current performance. Our work is an attempt to close this gap by proposing algorithms filling two important monitoring functions: anomaly detection and root cause diagnosis.
2.1 c e l l u l a r n e t w o r k s
Mobile operators offer different types of services ranging from basic services such as con-versational voice, Short Messaging Service (SMS), Multimedia Messaging Service (MMS), and Unstructured Supplementary Service Data (USSD) to more complex ones appearing with the emergence of smart phones such as real time gaming, video chatting, video streaming and other web based services like browsing, email, social networking, and Peer to Peer (P2P) file transfer. With the arrival of 5G, more services are expected to ap-pear based on Internet of Things (IoT) and Machine to Machine (M2M) related to smart cities and smart homes [9], [35]. The multitude and heterogeneity of services make the
network infrastructure more and more complex. In this section, we give a brief overview of cellular networks architecture. Then, we explain briefly the complexity of network management and list cellular network requirements with regard to Third Generation Partnership Project (3GPP) standards.
2.1.1 Architecture
To reduce costs and ease the transition from one generation to another, 2G, 3G and 4G coexist in today’s cellular network infrastructure. We will give now a brief view of the different technologies present in the Radio Access Network (RAN) and in the core network.
2.1.1.1 RAN
TheRANis the wireless part of the network that connects subscriber devices to the core network. It implements one or multiple Radio Access Technologies (RATs). As illustrated in Figure2, in today’sRANwe find the followingRATs:
10 t e l e c o m m u n i c at i o n b a c k g r o u n d
GSM EDGE Radio Access Network (GERAN) [49] consists in Base Transceiver Stations
(BTSs) connected to a Base Station Controller (BSC). It has a bandwidth of 200 kHz, a data rate up to 1.89 MBps, and a latency of at least 180 ms.
Universal Terrestrial Radio Access Network (UTRAN) [138] is composed of Node-Bs
connected to an Radio Network Controller (RNC). Its bandwidth is equal to 5 MHz. Its data rate goes to 42 MBps and its latency is at least equal to 110 ms.
Evolved Universal Terrestrial Radio Access Network (EUTRAN) [37] is a composed of a
net of Evolved Node Bs (eNodeBs) that can communicate with each other. It uses many frequencies between 1 MHz and 20 MHz. Its data rate can exceed 300 MBps and its latency is less than 5 ms.
Figure 2: Cellular network infrastructure showingRANand core elements.
2.1.1.2 Core Network
The core network is the network part that implements the network services. With the evolution of cellular networks, different types of core networks have been designed. Figure2shows the different types of core networks used by network operators [31]:
Circuit Switched (CS) Core is mainly used for voice calls (in 2G and 3G). Each commu-nication has a dedicated channel. Figure 2 shows three main components of the
CS core network: Mobile Services Switching Centre (MSC), Visitor Location Reg-ister (VLR), and Home Location Register (HLR). AnMSC is a switching node that offers key functionalities such as authentication, registration, call location, and call routing. AVLRis an integral part of theMSCthat provides subscriber information allowing the access to specific services. Finally, a HLR is a database that contains subscriber general information and last location. These data are relevant to service access and call routing.
2.1 cellular networks 11
Packet Switched (PS) Core is used in 3G to handle data. A message is broken into packets and its packet can go through a different circuit. In Figure 2, we see two
main devices: a Serving GPRS Support Node (SGSN) and a Gateway GPRS Sup-port Node (GGSN). The combination of a SGSN and a GGSN allows the control of subscriber attachment, service access, packet routing, and charging.
Evolved Packet Core (EPC) unifies voice and data over Internet Protocol (IP). Voice is
considered as anIPapplication. The entry point of the core network is the Mobility Management Entity (MME). AMMEhandles the signalling related to mobility man-agement such as paging. The main component of anEPCcore network is the
com-bination of a Serving Gateway (SGW) and Packet data network Gateway (PGW). This combination transportsIPpackets between User Equipment (UE) and external networks. The database ofEPCnetworks is called Home Subscriber Server (HSS). It
contains user information and implements functions to support MMEsin mobility management and network access.
2.1.2 Procedures
Cellular networks implement a set of procedures that allow subscribers to access dif-ferent types of services. When a mobile phone is switched on, the registration process is executed. The International Mobile Subscriber Identity (IMSI) is authenticated and lo-cated. The subscriber profile is updated. When the subscriber moves from a location area, which is a group of cells, to another, the location update procedure is triggered. Dur-ing this process, the subscriber location is updated and a new cell is selected to handle the calls and data sessions initiated by the subscriber. Another key procedure in cellular networks is the call setup procedure. When a subscriber attempts to call another subscriber, the called number is processed to identify the path the request will follow to reach its destination. Once the request is approved, a multimedia session is established. If, during the ongoing call, the subscriber moves from one cell to another, the call is transferred to the new channel without disconnecting the session. This process is known as the handover procedure. When a subscriber is outside the coverage area of its home network, he still can access services via intermediate networks. This process, called roaming, is guaranteed by means of agreements between different telecommunication operators.
2.1.3 External networks
Every cellular network is connected to other cellular networks. This fact allows cellular networks to carry outgoing calls and guarantee connectivity when subscribers are out of their coverage area. Cellular networks are also connected to service providers via inter-net. Service providers give subscribers access to a wide variety of services such as video streaming, social networking, and online gaming. Cellular networks link subscribers to service providers and carry the exchanged data between them. Different services do not have the same requirements in terms of bandwidth, fault tolerance, and latency. Mobile operators have to adjust their configuration to fit different requirements.
12 t e l e c o m m u n i c at i o n b a c k g r o u n d
2.1.4 Cellular network requirements
The telecommunication market standards define challenging criteria that should be filled [3], [45]. First, high performance is the most important targeted criterion.
Opera-tors aim to deliver an elevated Quality of Service (QoS) and Quality of Experience (QoE). They have to assure high responsiveness by reducing the latency and increasing the throughput. They also have to ensure high connectivity by densifying their network and widening their coverage areas (indoor/outdoor). Second, operators work towards having a resilient and flexible network with an adaptive capacity to support disruptive as well as natural traffic growth. Third, operators aim to have a fault tolerant network that guarantees a constant availability of the services by implementing compensation and fast recovery mechanisms. Lastly, standards value security and privacy. Operators should secure their networks from attacks against both integrity and privacy.
2.2 m o n i t o r i n g s y s t e m s
As shown in the previous section, cellular networks are very complex to monitor. At the same time, the telecommunication market and the standardization entities push operators to deliver high quality services. These facts make the monitoring systems a critical component of today’s cellular networks. Many operators outsource a part of their monitoring tasks to specialized companies such as EXFO.
The goal of monitoring the cellular network is to have full visibility and control over the network infrastructure and processes. This task is carried out by experts in differ-ent domains: network administrators, software technicians, Information Technology (IT)
specialists, and telecommunication experts. The goal of integrating monitoring systems is to increase the speed and efficiency of these experts by automating tasks and provid-ing useful information. In the followprovid-ing, we detail the main functions of a monitorprovid-ing system.
2.2.1 Main functions
The monitoring functions can be grouped into three categories: troubleshooting, perfor-mance monitoring, and planning. Some operators use a centralized monitoring system that incorporates the three categories. Others use multiple systems, each implementing a subset of the monitoring functions. We detail now each category of functions.
Troubleshooting is the most important monitoring function as operators want their services to be continuously available. The troubleshooting process can be broken down into four main functions [124]: data collection, issue detection, issue
identi-fication, and recovery. Data collection consists in collecting data that is relevant to the troubleshooting process by creating and/or collecting logs, recording events, mirroring the traffic, generating reports, and calculating metrics. The second step, issue detection, consists in analyzing logs and evaluating metrics to detect anoma-lies. If an abnormal event is found in the logs or a metric has an abnormal value, the operator is notified. The notification can take different forms such as raising an alarm or creating a ticket. The third function, issue identification consists in
2.2 monitoring systems 13
a deep analysis of the data to diagnose the network and identify the issue. Fi-nally, the recovery step consists in fixing the problem by triggering the adequate compensation and recovery mechanisms. The mentioned functions can be manual, partially automated, or fully automated.
Performance monitoring consists in measuring Key Performance Indicators (KPIs) to gain insights on network performance, benchmark network elements (e.g. cells) and services, and identify the low performing ones. Through performance moni-toring, operators may improve theQoSand therefore theQoE[88].
Prediction and planning are based on process/resource monitoring. By analyzingKPI
trends, operators can improve their services in different ways. As an example, they can anticipate events and prevent downtime [54]. Furthermore, they can
pre-dict churn and propose more personalized subscriptions [125]. Moreover, they can
allocate resources more efficiently [60].
2.2.2 Structure
Monitoring systems have different structures depending on many factors such as the size of the network, the load of the traffic, the main afforded services, and the preferences of the operator. The monitoring system can be centralized or distributed. In the following, we focus on the four main components that are present in almost every monitoring system.
Probes [83], [136] are mirroring components that can be built in the network
monitor-ing tool or installed separately in the monitored devices. Probes pull data from devices passively in real time using protocols like Simple Network Management Protocol (SNMP), Transmission Control Protocol (TCP), and Hypertext Transfer Pro-tocol (HTTP).
A data processing entity is considered as the brain of the monitoring system. It imple-ments basic functionalities such as data filtering and aggregation. It also includes advanced functionalities such as trend analysis, anomaly detection, network diag-nosis, capacity planning, and QoE estimation based on Business Intelligence (BI) and Machine Learning (ML) tools. This component creates KPIs, generates status information, and summary reports.
An alerting system triggers real time alarms based on the information offered by the data processing entity. For example, it notifies the administrators if a KPIis below a predefined threshold.
A visualization system is a Graphical User Interface (GUI) that displays the summary information in a human readable manner. It enables the administrator to navigate the different components of the network and to visualize status and performance statistics.
14 t e l e c o m m u n i c at i o n b a c k g r o u n d
2.2.3 Data types
The monitoring systems produce two types of logs: communication logs and system logs [137]. Communication logs are the logs a monitoring system keeps from subscribers
activity such as call traces. Call traces are unstructured data including all the messages exchanged by network devices during a mobile communication initialized by a sub-scriber. These traces are aggregated into Call Data Records (CDRs) and Session Data Records (SDRs) which are structured logs containing the list of the network devices and the service details involved in the mobile communication.CDRsare the records of voice calls and SDRs are the records of TCP connections. CDRs and SDRs are aggregated into multidimensional counters reporting the performance of the network (e.g. the mean re-sponse time by the 3-tuple (RAT, service, handset type)). System logs are the logs created to keep track of the events, processes and messages of the system such as Address Res-olution Protocol (ARP) requests. Alerts are created based on these logs (whenever an abnormal event occurs). System logs and communication logs are aggregated intoKPIs which are time series presenting the temporal evolution of performance indicators such as the Central Processing Unit (CPU) usage and the call drop rate.
2.2.4 Requirements
To guarantee network high performance, the monitoring system has to be effective. The effectiveness translates in terms of different requirements. First, the monitoring sys-tem should scale to handle the growth of the traffic and the expansion of cellular net-works [85]. Second, the monitoring system should be flexible to supervise multi-vendor
and heterogeneous network equipments [69]. Third, the monitoring system should be
sufficiently reactive to detect issues and trigger mitigation operations in real time to limit downtime. In addition, it should perform an in-depth analysis of the network and go to fine granularity levels to find hidden issues. Fourth, the monitoring system should be autonomous to a certain degree to be reactive and reduce demanded human efforts. Repetitive tasks should be automated. More advanced tasks can be partially automated by the use of ML[88], [124]. The settings of the monitoring system should be
straight-forward [88]. Moreover, it has to be compliant with telecommunication standards and market.
The monitoring system should respect the standards by insuring the demandedQoS. It has also to respond to the marked needs [2], [4], [87] (e.g. integrating new functions to
monitor new services). Furthermore, it should be fault tolerant and easy to troubleshoot. Lastly, the monitoring system has to be cost-effective. As the network traffic is huge, the analysis implemented in the monitoring system should be optimized to reduce compu-tational needs. The monitoring system should also store only needed data and for a limited period of time.
2.2.5 Limitations
While the monitoring systems have evolved in terms of autonomy and efficiency, they are still below the requirements mentioned in the previous paragraph in many aspects: First, the monitoring process still relies on the human presence. Many monitoring tasks
2.2 monitoring systems 15
today are carried out manually. While monitoring systems generate KPIs and alarms, these latter are analyzed by experts when troubleshooting the network. This fact makes the troubleshooting task very costly to operators. Second, the cellular networks still suf-fer from low efficiency occasionally (downtime) or continually in some specific cases such as roaming and mobility. The monitoring systems are not sufficiently reactive and efficient to address unavailable services in real time nor to handle roaming and han-dovers in an optimal way. Last, the 5G standards have set high expectations in terms of QoS. The current monitoring systems are not capable of guaranteeing such perfor-mance [127].