HAL Id: tel-00808194
https://tel.archives-ouvertes.fr/tel-00808194v2
Submitted on 22 Apr 2013HAL is a multi-disciplinary open access
archive for the deposit and dissemination of sci-entific research documents, whether they are pub-lished or not. The documents may come from teaching and research institutions in France or abroad, or from public or private research centers.
L’archive ouverte pluridisciplinaire HAL, est destinée au dépôt et à la diffusion de documents scientifiques de niveau recherche, publiés ou non, émanant des établissements d’enseignement et de recherche français ou étrangers, des laboratoires publics ou privés.
Hybrid Home Networks Links Quality Supervision
Oscar Olvera Irigoyen
To cite this version:
Oscar Olvera Irigoyen. Hybrid Home Networks Links Quality Supervision. Networking and Internet Architecture [cs.NI]. Télécom Bretagne, Université de Rennes 1, 2012. English. �tel-00808194v2�
N° d’ordre : 200XtelbYZWK
S
Soouussllee sscceeaauuddeell’’UUnniivveerrssiittéé EEuurrooppééeennnneeddeeBBrreettaaggnnee
Télécom Bretagne
En habilitation conjointe avec l’Université de Rennes 1
École doctorale - MATISSE
Hybrid Home Networks Links Quality Supervision
Thèse de Doctorat
Mention : « Informatique »
Présentée par Oscar Olvera Irigoyen
Département Réseaux, Sécurité et Multimédia (RSM)
Directeur de thèse : Laurent Toutain
Soutenue le 20 Décembre 2012
Jury :
M. Gerardo Rubino - Professeur à l’IRISA, Université de Rennes 1 (Président)
Mme. Catherine Rosenberg - Professeur à Waterloo University (Rapporteur)
M. Martin Heusse - Professeur à l’Institut Polytechnique de Grenoble (Rapporteur)
M. Lauren Toutain - Professeur à Télécom Bretagne (Directeur de thèse)
To my wife Zélie and to my daughters Constance and Elinor To my Parents Maria-Adelita and Jorge
Acknowledgments
A number of persons have greatly assisted my work to finish this dissertation. A major place and sincere appreciations are owed to my advisors, Dr. Laurent Toutain, Associate Professor at Telecom Bretagne and Dr. Abdesselem Kortebi, R&D Engineer at Orange Labs for their constant support, guidance and encouragement. I have benefited from many valuable discussions throughout this work. Abdesselem Kortebi’s expert insights have significantly contributed to enrich my thesis.
I gratefully thank Professor Catherine Rosenberg, Professor at Waterloo University and Martin Heusse, Professor at Institut Polytechnique de Grenoble for accepting to review my dissertation and for their valuable remarks. I would like to thank Professor Gerardo Rubino at IRISA Université de Rennes 1 and Dr. David Ros, Associate Professor at Telecom Bretagne for accepting to be members of the jury for this dissertation.
I am very grateful to Orange Labs, for the sponsorship of my PhD study. I also acknowledge and thank Telecom Bretagne and my Ecole Doctorale MATISSE for having me as a member of their PhD students.
I am thankful to all my colleagues, academic and support staff at Orange Labs and Télécom Bretagne for the support rendered to me. I specially thank Dr. Emanuelle Cressan responsible of the “Multiservices Architecture of Network and Gateways” team and Dr. Philippe Chanclou responsible of the “Advanced Studies on Home and Access Networks” team, both at Orange Labs, for their continuous managerial support. I very thank to Dr. Martial Bellec, Dr. Jean-Philippe Javaudin and Dr. Pierre Jaffré for their valuable insights and comments throughout all the period of my research at Orange Labs. I would also like to thank Oumar Diarra and Hakim Senhadji, two master students, for their invaluable help with the experimental part of this dissertation
I would like to extend my gratitude to my parents and family for their unconditional support and teaching. They taught me the values that have allowed me to become successful in life.
Finally, I am most grateful to Zélie, my wife and Constance and Elinor, my daughters for standing with me throughout both difficult and good times, and for their love, patience and sacrifices.
Abstract
Home networks are evolving vigorously and are also becoming more and more heterogeneous and complex. Home networks contain new services and numerous devices with wired and wireless links. At the same time, users demand high levels of quality of service for many new applications. Hence, the supervision of links quality tends to be mandatory in emergent home networks, to trigger QoS mechanisms. In this context, this dissertation proposes the utilization of the available bandwidth as a performance indicator in hybrid home networks (e.g. for remote service-evaluation, diagnosis and fault detection) and as link-state metric for a number of QoS mechanisms (e.g., admission control, path selection and load balancing).
In this dissertation, we firstly explain why available bandwidth probing is a fundamental tool in the new QoS architectures for hybrid home networks and we explore different use cases. We investigate the networking constraints that affect bandwidth probing in hybrid home networks. We explain why most tools to measure available bandwidth on Internet paths are not very efficient on home networks. We make a taxonomic study of a number of state-of-the-art probing techniques and probing tools for available bandwidth. At that aim, we propose a functional framework, called Metrics Profile Capture Filter and Feedback (MPCFF). Based on these studies, we choose Iperf in TCP mode as an attractive tool to estimate available bandwidth. Then, we conduct a performance evaluation on an experimental test bed, to compare Iperf in lightweight TCP-mode vs. various state-of-the-art tools (Wbest, Pathchirp, Pathload and IGI/PTR). We show that Iperf in lightweight TCP mode is superior in terms of accuracy and speed of convergence. Finally, we integrate Iperf in lightweight TCP mode into a path selection protocol using the Inter-MAC software (developed in the Omega European project). We show, on a test bed, how Iperf in lightweight TCP mode enhances the Inter-MAC path selection by eliminating performance deterioration due to time-varying capacity links. Our results show that Iperf in lightweight TCP mode, accurately, triggers path selection and load balancing mechanisms, to adapt the network resources to the strong degradation of WiFi and PLC links.
Available bandwidth probing detects and helps to control real-time deviations of the quality of experience, associated of sensitive applications. At the same time, available-bandwidth probing helps the service provider to isolate failures and to monitor the end-to-end residential service, on demand or on long-term periodicity basis.
Keywords: Home Network, Network Performance, Available Bandwidth, Link Capacity,
Résume
Les réseaux domestiques connaissent une évolution importante et deviennent de plus en plus hétérogènes et complexes. Ils intègrent de nouveaux services, des équipements variés et des technologies de connectivité filaires et sans fil. De plus, les utilisateurs exigent une qualité de service d’un niveau très élevé pour de nombreuses nouvelles applications. Par conséquent, le contrôle de la qualité des liens tend à être obligatoire dans les réseaux domestiques émergents, pour déclencher les mécanismes de QoS. Dans ce contexte, cette thèse propose l'utilisation de la bande passante disponible en tant qu'indicateur de la performance, dans les réseaux domestiques hybrides, par exemple, pour la détection de défaillances, l’évaluation de service, et le diagnostic. La bande passante disponible peut-être aussi une métrique d'état de lien pour un certain nombre de mécanismes de qualité de service, par exemple, le contrôle d'admission, la sélection de chemins et l'équilibrage de charges.
Dans cette thèse, nous expliquons pourquoi la mesure active (« probing ») de la bande passante disponible est un outil fondamental dans les architectures de QoS pour les réseaux domestiques hybrides. Nous explorons aussi différents cas d'utilisation. Nous étudions les contraintes de réseau qui affectent le « probing » de la bande passante dans les réseaux domestiques hybrides. Nous expliquons pourquoi la plupart des outils de mesure de la bande passante disponible pour mesurer les chemins d’Internet ne sont pas très efficaces sur les réseaux domestiques. Nous faisons une étude taxonomique d'un certain nombre de techniques et d’outils état de l’art pour le « probing » de la bande passante disponible. À cette fin, nous proposons un Framework appelé « Metrics Profile Capture Filter and Feedback » (MPCFF).
Sur la base de ces études, nous avons choisi « Iperf en mode TCP » comme un outil intéressant pour estimer la bande passante disponible. Ensuite, nous procédons à une évaluation de la performance sur test bed, pour comparer « Iperf en mode TCP léger » vs divers outils de l’état de l’art (Wbest, Pathchirp, Pathload et IGI / PTR). Nous montrons qu’Iperf en mode TCP léger est supérieur en termes de précision et de vitesse de convergence. Enfin, nous intégrons Iperf en mode TCP léger dans un protocole de sélection de chemins, en utilisant le logiciel Inter-MAC (développé dans le projet Européen Omega). Nous montrons, sur un test bed, comment Iperf en mode TCP léger améliore la sélection du chemin de l’inter-MAC en contrôlant la dégradation des performances due aux liens à capacité variable dans le temps. Nos résultats montrent qu’Iperf en mode TCP léger
déclenche la sélection de chemins et les mécanismes d'équilibrage de charges de façon précise. Ça permet d’optimiser les ressources réseau en présence d’une forte dégradation des liens WiFi et des liens PLC.
Le « probing » de la bande passante disponible détecte et aide à contrôler, en temps réel, les dégradations de la qualité d’expérience, associées aux applications sensibles. Dans le même temps, le « probing » de la bande passante disponible assiste le fournisseur de services réseau en isolant les pannes et en surveillant les services résidentiels de bout à bout, à la demande ou sur une périodicité à long terme.
Mots-clés : réseau domestique, performance réseau, bande passante disponible, capacité de
Contents
Acknowledgments ... i
Abstract ... iii
Résume ... v
List of Figures ... xi
List of Tables ... xiii
List of Abbreviations ... xv
Glossary ... xix
1. Introduction ... 1
1.1. Overview of Home Networks ... 1
1.2. Problem Statement ... 4
1.3. Research Objectives and Contributions ... 6
1.4. Thesis Outline ... 8
2. Background: Available Bandwidth Monitoring and QoS Mechanisms in Home Networks ... 9
2.1 End-to-end Impairments, Management Processes and QoS Mechanisms: Interdependencies ... 9
2.1.1 QoS/QoE budget ... 9
2.1.2 Key Performance Indicators ... 10
2.1.3 QoS Mechanisms, Metrics and Logical Planes ... 12
2.2. Home Network QoS Architectures ... 16
2.2.1 Brief Historical Background ... 16
2.2.2 QoS Home Network Architectures ... 18
2.3. Available Bandwidth Monitoring in Home Networks ... 23
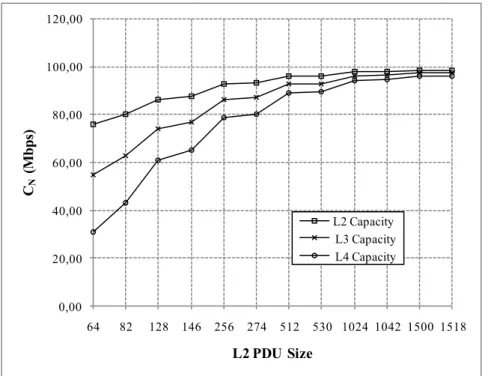
2.3.1 Layer-N Capacity in Home Networks ... 24
2.3.2 Layer-N Available Bandwidth in Home Networks ... 26
2.3.3 Available Bandwidth Monitoring in the Home Network ... 27
2.5. Summary ... 33
3. State of the art of Available Bandwidth Probing: Network Constraints, Techniques and Tools ... 35
3.1. Networking Constraints for Bandwidth Probing ... 36
3.1.1 Deterministic Measurement vs. Probing Measurement ... 37
3.1.2 Time Scales and Traffic Classes ... 37
3.1.3 End-Centric Probing vs. Network-Centric Probing ... 38
3.1.4 Networking Constrains for Bandwidth Probing on Internet Paths ... 38
3.1.5 Networking Constrains for Bandwidth Probing on Home Network Paths ... 38
3.2. Principles of Bandwidth Probing Techniques ... 39
3.2.1 The Variable Packet Size (VPS) Technique for Capacity Probing (by-hop) ... 40
3.2.2 The Variable Pair Dispersion (VPD) & Variable Train Dispersion (VTD) Techniques for End-to-End Capacity Probing ... 41
3.2.3 The Direct-Probing or Probe Gap Model (PGM) for End-to-End Available Bandwidth Probing ... 43
3.2.4 The Iterative-Probing or Probe Rate Model (PRM) for End-to-End Available Bandwidth Probing ... 44
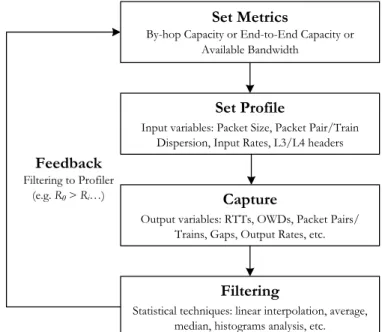
3.2.5 Profiler, Capture, Filtering and Feedback (MPCFF) Framework ... 46
3.3. Characterization of Candidate Available Bandwidth Probing Tools for Home Networks ... 51 3.3.1 Spruce ... 51 3.3.2 IGI/PTR ... 51 3.3.3 Wbest ... 52 3.3.4 Allbest ... 52 3.3.5 Pathload ... 54 3.3.6 Pathchirp ... 54 3.3.7 Iperf... 55
3.4. Selecting Available Bandwidth Probing Tools for Home Networks ... 57
3.4.1 Iperf in Lightweight TCP Mode, an Attractive Alternative ... 58
3.5. Summary ... 59
4. Iperf in lightweight TCP mode in Hybrid Home Networks ... 61
4.1. Introduction... 61
4.2.2 Tools Performance and Measurement Process ... 63
4.3. Experimental Test bed ... 64
4.3.1 Capture Automation of Performance Descriptors ... 65
4.3.2 Path Scenarios ... 66
4.4. Results ... 67
4.4.1 Benchmarking ... 67
4.4.2 Global Results ... 74
4.5. Summary ... 75
5. Iperf in Lightweight TCP Mode for Path Selection in Heterogeneous Home Networks 77 5.1. Introduction... 77
5.2. Methodology ... 78
5.2.1 Inter-MAC Path Selection protocol ... 78
5.2.1 Iperf in lightweight TCP mode ... 79
5.3. Experimental Test bed ... 80
5.3.1 Test Bed Features... 81
5.3.2 Experimental Tests ... 83
5.4. Results ... 84
5.5. Summary ... 88
6. Conclusions and Perspectives ... 89
Appendix A: Résumé étendu en Français ... 93
A.1. Contexte : les réseaux domestiques ... 93
A.2. Problématique ... 96
A.3. Objectifs de la thèse et contributions ... 99
A.4. Organisation de la thèse ... 101
A.5. Conclusion de la thèse ... 101
Appendix B: The Java Test Automation Interface ... 107
Appendix C: Configuring Iperf in Lightweight Mode for Available Bandwidth Probing ... 109
C.1. Test Bed Setup ... 109
C.2. Methodology ... 111
C.3. PCs Configuration ... 112
Configuration of PC1 ... 112
Configuration of PC4 ... 116
C.4. Results ... 116 Bibliography ... 119
List of Figures
Fig. 1.1. Home Network Services and Hybrid Connectivity Technologies ... 2
Fig. 1.2. “End-to-end residential path” based on ITU-T/Y.2173 [51] ... 3
Fig. 2.1. Logical Planes found in the WAN and LAN segments ITU-T/Fig.13/Y.1001 ... 12
Fig. 2.2. Timeline QoS Home Networks Evolution ... 18
Fig. 2.3. Physical Topologies: (a) tree, (b) mesh and (c) arbitrary topology ... 21
Fig. 2.4. Layer-N capacity on a Fast Ethernet link in function of L2 PDU size ... 25
Fig. 2.5. Home Network Control Loop and Performance Monitoring ... 27
Fig. 3.1. Bandwidth Probing ... 36
Fig. 3.2. MPCFF functional framework ... 46
Fig. 3.3. Packet pairs and trains dispersion, based on [92] ... 47
Fig. 4.1. Path Scenarios on Test Bed ... 65
Fig. 4.2. Scenario (a) 100Base-TX: Available Bandwidth, L2 Overhead and Probing Interval versus Cross Traffic... 68
Fig. 4.3. Scenario (b) 100Base/TX-IEEE802.11a: Available Bandwidth, L2 Overhead and Probing Interval versus Cross Traffic ... 69
Fig. 4.4. Scenario (c) 100Base-TX/HPAV/100base-TX: Available Bandwidth, L2 Overhead and Probing Interval versus Cross Traffic ... 70
Fig. 4.6. Scenario (e) 100Base-TX/HPAV/IEEE802.11a/IEEE802.11a/100Base-TX: Available Bandwidth, L2 Overhead and Probing Interval versus Cross Traffic ... 71
Fig. 4.2. Global Results ... 74
Fig. 5.1. Path scenarios on testbed ... 81
Fig. 5.2. A1 and A2 with default implementation (passive + static) measurement ... 85
Fig. 5.3. Spirent report of F1 and F2 bandwidth with default Inter-MAC path selection (passive + static measurements), scenario 2 ... 86
Fig. 5.4. A1 and A2 with Iperf in lightweight TCP mode measurement ... 87
Fig. 5.5. Spirent report of F1 and F2 bandwidth with Inter-MAC path selection + Iperf in lightweight TCP mode measurement, scenario 2 ... 87
Fig. A.2. Chemin du service résidentiel de bout en bout basé sur ITU-T/Y.2173 [51] ... 95
Fig. B.1. Screenshot of the Java test interface ... 108
Fig. C.1. Simple example of using Iperf in lightweight TCP mode... 110
Fig. C.2. Cross traffic injected from PC3 using Iperf in UDP mode ... 116
Fig. C.3. Available bandwidth measurements from PC1 with Iperf in lightweight TCP mode ... 117
List of Tables
Table 2.1. QoS Mechanisms and Performance Metrics in Packet Networks ... 14
Table 2.2. QoS Architectures for Home Networks... 20
Table 2.3. Example Home Network Paths for the HDTV Service ... 28
Table 2.4. Transport Layer QoE based end-to-end Targets for a Flow of 12Mbps-HDTV-MPEG-4 AVC (from TR-126) ... 29
Table 2.5. Bit Rate Envelope for the Home Network Example ... 30
Table 3.1. Structural Characteristics of the Candidate Tools to Measure Available Bandwidth in Home Networks ... 57
Table 4.1. Global Performance Results ... 72
Table 4.1. Tools Performance Characteristics ... 75
Table 5.1. Monitored Paths ... 82
Table 5.2. Tested Path Capacity Conditions ... 84
Table 5.3. Default Measurements (Mbps) and Inter-MAC Path Selection ... 84
Table 5.4. Iperf in lightweight TCP mode (Mbps) Measurements and Inter-MAC Path Selection ... 86
List of Abbreviations
AAL ATM Adaptation Layer
ABR Available Bit Rate
AGW Access Gateway
ARPANET Advanced Research Projects Agency Network
AS Autonomous System
ATM Asynchronous Transfer Mode
BAN Body Area Network
BDP Bandwidth Delay Products
CAC Connection Admission Control
CATV Cable Television
CBR Constant Bit Rate
CSMA/CD Carrier Sense Multiple Access / Collision Detection
Diffserv Differentiated Services
DLNA Digital Living Network Alliance
DSCP Differentiated Service Code Point
E2E End-to-End
FTV Flow of TV
FTP File Transport Protocol
HDTV High Definition Television
HGI Home Gateway Initiative
HPAV Home Plug Audio/Video
HTTP Hyper Text Transfer Protocol
ICMP Internet Control Message Protocol
IETF Internet Engineering Task Force
IGI Initial Gap Increasing
IMN Inter-MAC Node
Intserv Integrated Services
IPTV IP Television
ISDN Integrated Service Digital Network
ISP Internet Service Provider
ITU International Telecommunications Union
KPI Key Performance Indicator
FIFO First-in-First-out
LAN Local Area Network
L1, L2, L3, L4 Layer 1, Layer 2, Layer 3, Layer 4
MoCA Multimedia over Coax Alliance
MOS Mean Opinion Score
MPCFF Metrics Profiling Capturing Filtering and Feedback
MPLS Multi Protocol Label Switching
MT Measurement Time
MTU Maximal Transmission Unit
NAS Network Attached Storage
OS Operating System
OSPF Open Shortest Path First
OWD One-Way-Delay
PAN Personal Area Network
PBM Packet Bunches Modes
PDU Protocol Data Unit
PDV Packet Delay Variation
PGM Probing Gap Model
PLC Power Line Communication
POF Plastic Optical Fiber
PREP Path Replay Message
PREQ Path Request Message
PRM Probing Rate Model
QoE Quality of Experience
QoS Quality of Service
RTT Round-Trip-Time
RSTP Rapid Spanning Tree
SDH Synchronous Digital Hierarchy
SLA Service Level Agreement
SLO Service Level Objective
SLoPS Self-loading Periodic Streams
STB Set Top Box
STP Spanning Tree Protocol
TCP Transmission Control Protocol
TDM Time Division Multiplexing
TOPP Trains of Pairs of Packets
TTL Time to Live
TV Television
UDP User Datagram Protocol
UPnP Universal Plug and Play
UTP Unshielded Twisted Pair
VoIP Voice over IP
VPD Variable Packet Pair Dispersion
VTD Variable Packet Train Dispersion
VPS Variable Packet Size
VP/TD Variation of Pair/Train Dispersion
WAN Wide Area Network
WLAN Wireless Network
Glossary
Available bandwidth of a link is given by the unutilized fraction of the capacity of this link in a specific period of time. See the definition of available bandwidth in chapter 2.
Cross-traffic is all the traffic not associated with active dummy probes.
Probing-traffic, is the application traffic (passive) or dummy-traffic (active) that is considered to infer, the bandwidth on a measured path.
Bandwidth probing is an in/out process that infers capacity or available bandwidth from the delay behavior of dispersion or bit rate of probing packets after they interact with the nodes and cross-traffic on the measured path.
Convergence time is the period, needed by a probing tool, to provide a metric estimation. Convergence time includes the probing time and the computation time required by the tool, to obtain a metric estimation after the probing tool receiver processes the probing packets.
End-to-end impairments include latency, packet delay variation (PDV) (also called jitter), capacity fluctuations and packet losses, segment. End-to-end-network-impairments are cumulated through the WAN and through the home network segments and impact the performance of end-user applications.
Narrow link: is the link with the minimum capacity on the path and determines the E2E capacity.
Polling interval is the period between the beginnings of two successive executions of a probing tool.
Probing interval is the period between the beginning and the end of the first and the last probing packets of two successive executions of a probing tool.
QoS targets are a number of performance bounds or metrics, such as max delay, max delay variation, max packet losses, required bit rate, etc. The QoS targets can be used in both cases: a) as a design reference, to choose the required QoS mechanisms or b) as a
monitoring reference, to know if a expected QoE is accomplished in the actual network operation.
Test interval is the whole duration of the test, which is chosen to characterize a metric, using a probing tool and given the presence of a cross-traffic pattern on every different path.
Hybrid Home Networks
Links Quality Supervision
1.
Introduction
1.1. Overview of Home Networks
Home networks show a vigorous evolution and are becoming more and more heterogeneous and complex. Home networks contain new applications, devices with wired and wireless links. At the same time, users demand high levels of quality of service for many new applications.
Let us introduce the context where the home network is placed today, with respect to the end-user perspective and with respect to the service provider perspective.
From the end-user perspective, the home network tends to be increasingly pervasive and heterogeneous due to the constant evolution of its new network applications, new terminals and diverse connectivity technologies. In fact the home network is the interconnection of the Access Gateway (Home Gateway) and the different terminals (including, PCs, tablets, TVs, NAS, etc.). Several infrastructure devices are used in home networks: Ethernet-based switches, wireless interfaces, PLC plugs, etc. Therefore, the home networks can have hybrid paths, which are constituted by a number of serialized links, such as wired links with Ethernet, coaxial, phone wires, power line communication (PLC) links and wireless links within Personal Area Networks (PANs), Body Networks (BANs) and Wireless LANs [116]. Additionally, we can find new home network devices with hybrid links, wireless and PLC, see for instance Fig. 1.1. The home networks also transport several types of flows such as IPTV flows, VoIP flows, bulky flows, streaming, diverse web flows, etc.
Fig. 1.1 shows a home network with the typical central Access Gateway (AGW), which is connected to the WAN and with several serialized links (paths), which interconnect terminals and network nodes.
The evolution of the home network is closely related to the reduction of CPU costs of end-user terminals, the continued increment of interfaces speeds [94] and the strong penetration of the broadband residential access [17]. As we detail in section 2.2, the evolution of the home network begins several decades ago. Even though, the home networks, centered on the access gateway, begin to be popular in the ‘2000s, different proposals for ISDN/ATM-based home networks can be found in the ‘80s and ‘90s. In the ‘2000s we assist to the Internet boom and we find that the access gateway becomes the convergent point for the Internet access (to substitute the narrow-band/phone-line dialup modems), the CATV and the telephone. The access gateway has been transformed from a layer 2 intermediate nodes (to connect one or a few number of PCs at home, a CATV terminal and a phone) to an evolved router. Today, the access gateway allows multiservice access for a number of IP devices such as electronic tablets, smart phones, game consoles, laptops, household appliances, HD/3D TVs, IP phones, etc.
So, these trends generate a new spectrum of promising services, in the residential market, such as home media management, energy management, health care, home monitoring and control, etc. [82]. However, due to its complexity, the home network is also highly prone to
Power Line
Wired Fast Ethernet Wireless
VoIP
Home
Monitoring & Control Energy Management Media Management IPTV1 Home Health WAN Access Gateway PLC-WiFi1 Web Browsing IPTV2 STB PLC-WiFi2
performance variability [13], [115] and becomes a potential source of the end-to-end service quality degradation.
So, these trends generate a new spectrum of promising services, in the residential market, such as home media management, energy management, health care, home monitoring and control, etc. [82]. However, due to its complexity, the home network is also highly prone to performance variability [13], [115] and becomes a potential source of the end-to-end service quality degradation.
That is why there is a great interest, from the service provider perspective, in optimizing the QoS mechanisms, and the remote and local management systems of the home networks. Using, those mechanisms and processes should allow protecting priority flows, maximizing the use of home network paths and facilitating remote failure detection and residential service restoration.
On the other hand, the residential service flows are impacted by the end-to-end network impairments, which are cumulated through the WAN segment and through the home network segment. Those impairments (such as latency, packet delay variation PDV, also called jitter, capacity fluctuations and packet losses) affect the end-user applications, as explained in [52]. For these reasons, the network operators require isolate and control the impairments due to the WAN segment with respect to the home network segment.
So, the WAN segment is basically constituted for the service provider sub-segment, the core network sub-segment and the access sub-segment (e.g., last mile) as shown in Fig. 1.2.
For example, a typical IPTV flow, which is transmitted from the head-end of the IPTV service provider, is impacted by the propagation and queuing latencies, when it traverses all the network nodes through the WAN and home network segments. The packets (of this flow) will arrive to the end-user IPTV terminal with a specific distribution of inter-arrivals (delay and packet delay variation). For instance, if the delay and delay variation are higher than some required (end-to-end) QoS bounds, then the quality of the service will be impacted (e.g., voice/video degradation, high channel switching time, high portal retrieval
Core Network Access Network Home Network Service Provider WAN segment
At the same time, performance fluctuations on the WAN and on the home network can reduce the capacity of the end-to-end path and make vary the available bandwidth. Those variations can correspond to rerouting changes on the core network, to environmental changes on the access link and perturbations and intensive utilization of bandwidth on the home network links. If the end-to-end available bandwidth reduces to less than the targeted bit rate (required value), when a flow is transmitted, this will have destructive effects over the transmitted flows and will cause packet losses. At the same time, if these packet losses are superior to the permitted packet losses, we will have diverse image degradations and sound interruptions, [40] it will reduce the perceived quality of the service or in more severe cases, it can lead to a complete disruption of the service.
Hence, the selection of correct metrics and performance indicators is critical for QoS control, remote and local monitoring-purposes on links and paths of home networks. Nowadays, we find a number of QoS architectures [108], [14], [44], [45] that allow controlling a number of link/path-state metrics with respect to a series of performance bounds or QoS targets, such as max delay, max delay variation, max packet losses, required bit rate, etc. These architectures should guarantee the performance of end-user applications in the home network. Then, even if there is not a single global metric that can simplify the implementation of these QoS architectures, it is desirable to have a reduced set of metrics, which can have enough performance representativeness.
1.2. Problem Statement
As mentioned, the home networks are highly prone to performance variability [13], [115] and become a potential source of the end-to-end service quality degradation. For this reason, there is an increasing requirement of protecting priority flows, maximizing the use of available home network paths, facilitating remote failure detection and assisting the restoration of the residential service. In this context, link/path quality supervision tends to be mandatory in emergent QoS architectures of home networks and network management processes.
As discussed, we find a number of metrics required by reservation or parametric QoS architectures such as max delay, max delay variation, max packet losses, required bit rate, etc. These architectures allow guaranteeing the performance of end-user applications in the home network.
But, what kind of performance metric do we use to characterize link/path quality in the home network?
A representative performance metric with a number of reasonable assumptions in the home network can simplify the deployment of QoS mechanisms and network management processes. This is the case of the available bandwidth that can be used as a link/path-state metric or as part of a key performance indicator (KPI). The reason we focus on available bandwidth is because this metric, differing to other metrics, is a direct measure of the additional load that a link or a path can carry, before it becomes saturated. Other metrics, such as delay, delay variation, packet loss rate and capacity can only determine whether a path is already congested, which reduces its degree of prevention of potential service degradation [56]. Additionally, available bandwidth can simplify the home network service monitoring, can facilitate fault detection and it appears as a recurrent link-state metric in different QoS architectures for home networks.
Then, the question that arises naturally is: how do we measure available bandwidth in hybrid home networks?
There are basically two approaches: the deterministic passive-measurement and the active probing-measurement. Deterministic measurement reads directly the current traffic statistics of physical interfaces without statistical post-treatment for inference purposes. The active-probing measurement requires sending probing packets to sample the behavior of queues, the transmission conditions and processing through the paths. Active probing requires the statistical treatment of the captured samples to infer a specific network metric. Some of the advantages of deterministic passive-measurement are high accuracy on paths with fixed capacity, low or no overhead and relative simplicity of deployment. However, passive measurement suffers of inaccuracy on paths with time-varying capacities, is dependent of lower-layer measurement-mechanisms and do not reflect, the nearest as possible, the behavior of the application layer.
Thus, this dissertation proposes the utilization of transport available-bandwidth as a performance indicator and link/path-state metric tool. We focus on bandwidth measurement through active probing.
The networking constraints that we consider in the processes of available bandwidth probing include:
b) Strong delay variability in probing flows, induced by multiple-access mechanisms and time-variant link capacities in the home network
c) The need of a simple calibration and transparency to lower layers
d) Measurement accuracy, low convergence time, low overhead and stability in different system platforms and home network conditions
e) The need to facilitate end-centric or network-centric deployments f) The need to use badwidth probing with traffic classes
So, the problem is that most of the state-of-the-art tools, that have been developed for Internet paths, are inaccurate, slow and not stable enough (sensitive to clock resolution, timing slips, system interruptions and number, rate and size of probing packets [117], [98], [23], [7], [91]), particularly in the context of hybrid home networks. Therefore, we need to find a way to measure available bandwidth, considering all these networking constraints in home networks.
1.3. Research Objectives and Contributions
Taking into consideration the limitations of current probing tools and the constraints of the measurement process, this dissertation proposes using Iperf in a lightweight TCP mode to obtain maximum throughput of non-disruptive TCP flows and estimate the available bandwidth. According to the conducted performance evaluation tests, we support the hypothesis of Iperf as a convenient tool, because:
a) Iperf is a well-known benchmarking tool and conversely to the other tools is stable b) Iperf has been developed for different operating systems including Windows,
MacOS, Linux and Android
c) Iperf, based on the TCP protocol, can be configured to be not disruptive, when real time applications traverse the measured paths
d) Iperf can be used as an end-to-end available bandwidth estimation tool for residential services
e) Home networks have short slow-start periods and a predictable stable TCP performance, in opposition to networks with large bandwidth delay products f) We can use TCP Iperf in a lightweight TCP mode, with short probing intervals
Our contributions consist, firstly in benchmarking, on an experimental test bed, Iperf in lightweight TCP mode with respect to several bandwidth probing tools (IGI/PTR, Wbest, Pahtload and Patchirp), in terms of accuracy, convergence time and intrusiveness.
Secondly, we propose and reproduce, with a prototype Java test interface, a probing methodology considering probing, polling and test time-scales to weight the Iperf overhead, depending on home network applications.
These two contributions have been published as: “Available bandwidth probing in hybrid home networks as part of the Local Metropolitan Area Networks” (LANMAN), 2011 18th IEEE Workshop on, 2011.
Thirdly, we applied the proposed available bandwidth measurement tool in an interesting use case of interface/path selection in home networks. More specifically, we integrate Iperf in lightweight TCP mode to two nodes with redundant hybrid links (WiFi/PLC) running an existing path selection protocol (developed during the OMEGA European project)
Fourthly, we compare, on a test bed, the path selection protocol and Iperf with respect to the original implementation. We introduce external interferences on the WiFi/PLC links between two devices, while two IPTV flows transit in the home network. Then, we show how path selection coupled to Iperf in lightweight TCP mode is able to react to the link performance degradation and to avoid the performance blind-spots due to the default way to measure available bandwidth of the original protocol. The “original path selection” biases the available bandwidth measurement, when the capacity (of WiFi or PLC links) changes. Conversely, the path selection protocol coupled to Iperf is capable to detect the implicit variations of capacity and estimate the available bandwidth, accurately, quickly and with low level of overhead.
These last contributions have been submitted and accepted under the title: “Available Bandwidth Probing for Path Selection in Heterogeneous Home Networks”, as part of GC'12 Workshop: The 7th IEEE International Workshop on Heterogeneous, Multi-Hop, Wireless and Mobile Networks (GC'12 Workshop - HeterWMN 2012).
Finally, we have done a survey of the main QoS mechanisms found in state-of-the-art architectures for home networks and their relationships with the available bandwidth. We
network management processes and the QoS mechanisms through the residential path (including the home network). We underline the importance of available bandwidth as a link/path-state metric and as a key performance indicator to monitor and optimize home network resources. We also show different use cases where we use (transport-layer) available bandwidth to trigger QoS mechanisms such as admission control, best path selection and load balancing in the home networks.
1.4. Thesis Outline
The rest of this dissertation is composed as follows. In the second chapter, we explain why available bandwidth probing is a fundamental tool in the new QoS architectures for hybrid home networks and we explore different use cases, where available bandwidth probing can be implemented.
In the third chapter, we investigate the networking constraints that affect bandwidth probing in hybrid home networks. We make a taxonomic study of a number of state-of-the-art bandwidth probing techniques and available bandwidth probing tools. At that aim, we propose a functional framework called MPCFF to highlight the structural decomposition of the different techniques. Based on these studies, we choose Iperf in TCP mode as an attractive tool to estimate available bandwidth.
In the fourth chapter, we compare, on an experimental test bed, Iperf in lightweight TCP mode vs. Wbest, Pathchirp, Pathload and IGI/PTR available probing tools. We develop a homogeneous Java platform of tests and a methodology of available bandwidth probing in home networks. We show how Iperf in lightweight TCP mode is superior in terms of accuracy and speed of convergence.
Finally, using an experimental test bed, we apply Iperf in lightweight TCP mode to provide available bandwidth to an existing path selection protocol in hybrid home networks. The obtained results show that the measurements Iperf in lightweight TCP mode enhance the QoS and eliminate the performance blind-spots.
2.
Background: Available
Bandwidth Monitoring and QoS
Mechanisms in Home Networks
In this chapter, we study the main QoS mechanisms found in state-of-the-art architectures for home networks and their relationships with the available bandwidth. We also study the interdependencies that exist between the definition of QoS/QoE targets, network management processes and the QoS mechanisms through both the WAN and the home network. We aim to show the weight of available bandwidth as a link/path-state metric and as a key performance indicator to monitor and optimize home network resources. To illustrate that, we show some examples where we can use the transport-layer available bandwidth (obtained by available bandwidth probing) to trigger QoS mechanisms, such as admission control, best path selection or load balancing in the home networks.
2.1 End-to-end Impairments, Management Processes
and QoS Mechanisms: Interdependencies
2.1.1 QoS/QoE budget
The definition of Quality of Service in ITU-T E.800 [42] refers to "the collective effect of service performance which determines the degree of satisfaction of a user of the service." As we have mentioned in the introduction, these collective effects reflect many of the
interdependencies among network impairments (delay, delay variation and packet losses) due to the serialized inter-nodal-connectivity-technologies and QoS mechanisms through the WAN and the home network.
As mentioned, the end-to-end impairments targets, along the WAN and the home network must be respected to avoid residential service quality degradation. Accordingly, understanding the QoS experienced by the end-user (called Quality of Experience (QoE) [46]) helps to define such set of maximal impairments supported by the network and the bit rate requirements for specific applications [43]. Ultimately, the QoS targets can be used in both cases: a) as a design reference, to choose the required QoS mechanisms or b) as a monitoring reference, to know if the expected QoE is accomplished in the actual network operation.
Even though the relationships between QoE and QoS parameters are complex and not linear, they can be derived empirically [105]. For example, the Mean Opinion Score (MOS) of a representative group of test persons can range from 1 (worst) to 5 (best) with respect to the perceived quality of a network application. In this sense, we can associate a combination of QoS impairment targets that can be supported for an IPTV application without visible degradation and which requires a specific standard coding and a specific encoding bit rate.
In recommendation TR-126 [105], we find some tables with a set of end-to-end targets to ensure the QoE for specific applications (e.g., IPTV, voice, Web-browsing, bulk data transfer/retrieval, interactive games, etc.)
In this way, a given set of end-to-end targets of QoS is associated to a specific QoE behavior for a given set of applications and a representative group of test users. At the same time, these targets can be split for the WAN and the home network segments. The methodologies of mapping QoE levels to QoS parameters are out of the scope of this work. Our aim is to use a series of “standardized” performance targets as a performance reference, for network management processes and QoS mechanisms.
2.1.2 Key Performance Indicators
The need of defining a set of QoS targets for network management purposes can be related with the concept of Key Performance Indicators (KPIs) or called simply performance indicators.
low level QoS targets associated to an expected QoE for a set of specific applications. On the other hand, we choose a subset of those low level parameters to compose performance indicators, in terms of what simplifies the management processes and is important to the organization, what is accountable and impacts the contractual relationships between service providers and end costumers.
One example of this is the concept of Service Level Objective (SLO) of a Service Level Agreement (SLA), which can include a set of performance indicators. Those performance indicators must not be violated by any of the contract owners, in order to maintain the quality of a specific service and avoid contractual penalization [112]. For instance, if the network operator does not offer a sustained level of bandwidth and a bounded latency, for a videoconference service or if the costumer exceeds its contractual volume of transmitted data, then the network operator or the end-user will be obliged to pay the correspondent economic adjustments.
Another example of key performance indicators is found in the TR-160 recommendation [106]. A number of performance indicators are proposed to monitor the IPTV flows for a residential service. Some of those performance indicators are related with the user interface performance, such as the “IPTV Portal Information Retrieval Time” or the “IPTV Channel Switching Time.” Other performance indicators are related to the video and audio quality such as “IPTV Media Quality.” The IPTV Media Quality is a performance indicator that is associated to the MOS, according to the ITU-T P.911 recommendation and is expressed as follows in [106]:
(2.1)
Therefore, these performance indicators can be obtained using specific set top box (IPTV decoder) reports and end-to-end network measurements.
In this dissertation, we use the term of performance indicator to identify a network metric or a set of network metrics that can have enough representativeness of the home network paths performance. These metrics can impact the perception of the end-user and can possibly simplify the control and monitoring processes, related with the service provider operations. Therefore, we focus on the transport-layer available bandwidth in home
TvQI [MOS_estimate] = Function {audio codec type and bit-rate, video codec type and bit-rate, transmission bit-rate, IP packet loss, video size, audio format, video format, audio and video delay difference and delay variation}
network paths, because it can simplify the service monitoring in the home network, it can facilitate fault detection and it appears as a recurrent link state metric in different QoS architectures for home networks. We detail this below.
2.1.3 QoS Mechanisms, Metrics and Logical Planes
From the early ‘80s innumerable architectures and QoS mechanisms have been proposed to support convergent services in large-scale data networks [114], [113]. We find, for instance, the following architectures: B-ISDN/ATM [79], Intserv/RSVP [6], Diffserv [4], MPLS [111] and other flow-based architectures such as Flow-Aware Networking [61] and Flow-State-Aware Transport [41], etc. Nowadays, some of the basic building QoS mechanisms, used in these architectures, tend to be integrated in the novel QoS home networks architectures.
In this context, the "separation principle" of logical planes [68] can be very useful to classify QoS mechanisms and management processes [9], [50], [74], [2]. Those logical planes include the Data/Forwarding Plane, the Control Plane and the Management Plane. For example, in the case of IP, it was designed as a datagram service that represents the "minimum network service assumption"[10], which coupled to a "large enough" address space, enables "horizontal" scalable connectivity, on a large number of independent administrative domains. Accordingly, IP was not defined considering these convergence planes, so it is necessary to map them on associated sub-protocols [48], [50].
Fig. 2.1 is based on the ITU-T/Fig.13/Y.1001 recommendation [48] and shows graphically, the relationships among logical planes along the WAN and the home network segments.
Physical Layer Control Plane Data Plane
Management Plane
Physical Layer
Data Plane Control Plane Management Plane
End User QoE Service Provider
WAN Sement Home Network Segment
QoS targets QoS targets
IP-based applications IP-based applications
The separation principle allows categorizing the QoS mechanisms and processes, depending on the time-scales of the network metrics, which are required to accomplish such management and control processes.
In this sense, the QoS mechanisms of large-scale networks architectures, cited previously, can be associated to the logical planes and correspondent performance metrics. However, for the moment, we are interested in the relationships between the building QoS mechanisms and management processes, separated from their architectures. Our aim is to show the “time-scope” of typical performance metrics.
For instance, the management processes, included in the Management Plane, require metrics that have a macroscopic scope, with respect to the tasks and mechanisms, found in the Control Plane and Data Plane. So, we have separated the metrics in three categories: the key performance indicator (KPI) category, which have a global or macroscopic scope, the “path-state” category and the “link/interface-state” category, both with a microscopic scope. These categories can give more or less weight to some metrics than others, depending on the studied scenarios.
We synthesize the correspondence between logical planes, management processes, QoS mechanisms and some performance metrics in Table 2.1. Specific technical details of the relationships between performance metrics, QoS mechanism and management processes (showed in Table I) are out of the scope of this disertation. As mentioned, our aim is to show the “time-scope” of these performance metrics.
In Table 2.1, we have included five performance metrics: delay, delay variation, packet losses, hop counts and available bandwidth that are typically used to characterize network and application performance [80]. Those metrics can have a large time granularity (except hop count) and can exhibit relevant changes in the range of fractions of micro seconds to months or even years.
The Management Plane is related to the service evaluation, the event monitoring and the traffic restoration procedures, etc. The time-scales of the related management processes, at this plane, can range from seconds to days or months. For instance, each several minutes, a surge pattern of packet losses can affect the WAN-access segment (Fig. 1.2). It can cause, for instance, the IPTV service degradation in the home network terminals. On the same way, the available bandwidth (unutilized capacity) on PLC links or WiFi links (of the home network) can affect the speed of file sharing applications due to the RF interference of household appliances, or neighbor transmitters.
On the other hand, the involved metrics on the Management-Plane processes may also be oriented to the business objectives of the service provider, for service-accounting purposes. The service provider can be interested in knowing the availability, the usage-periodicity or the audience of a number of services during periods of days, weeks or months. Therefore,
TABLE 2.1.QOSMECHANISMS AND PERFORMANCE METRICS IN PACKET NETWORKS
Logical Plane QoS Mechanisms & Management Processes Metric Time-Scope Del ay D el ay V ar iat ion P ac k et los se s A vai lab le b a n d w id th H op c ou n t Reference (mechanism processes) Management Plane Service Level Evaluation KPI X X X X [74], [114] Event Application Monitoring KPI X X X X [80] Event Network Monitoring KPI X X X X [80]
Traffic Restoration KPI X X X X X [74], [68] Control Plane Routing Path selection Traffic Engineering Path-State X X X X [74], [2], [114] Admission Control Path-State X X X X [2], [114] Resource Allocation Path-State X X X [68], [74] Data Plane Traffic-policing
and shaping Link- Interface-State X X X X [74], [2] Traffic- queuing and scheduling Link- Interface-State X X X X [74], [2]
these metrics can be part of key performance indicators (KPI) that reflect the MOS as showing in equation (1) or QoS targets in SLOs. For these reasons, the Management-Plane metrics have a macroscopic time-scope regarding the perception of the network services. In contrast, the QoS mechanisms used typically on the Control Plane must react more rapidly than the processes found in the Management Plane. For instance the QoS routing, or path selection must track unpredictable outages of network paths, to allow rerouting the network flows on time. Then, the time-scope of the involved performance metrics will be of the order of one or many round-trip times of the transmitted flows (e.g., some milliseconds to several seconds, depending on the degree of tolerance of the associated network applications).
In backbone networks, such as SDH rings, the reaction time to reroute, in presence of path failures, is about of 50 ms [88]. However, in routed networks, using for example OSPF, the reaction time can largely increase from 30 to 40 seconds [20]. In local networks, the reaction time is of some units of second, when Rapid Spanning Tree (RSPT) [93] is used and about 30 seconds, when Spanning Tree Protocol (SPT) is active. In home networks, the reaction time to reroute can be of the order of several milliseconds, using for instance the Inter-MAC prototype software [62].
The Data-Plane Mechanisms deal with the forwarding treatment and flow control (sometimes after the classification and marking of flow packets). The Data-Plane requires time-scales of reaction that can be virtually instantaneous, when the packets are forwarded from an input interface to an output interface or from a source to a specific destination on a path. The packets can be classified depending on diverse traffic classes and applying packet priorities or drop-packets rules. Implicit flow control can be used to adapt the load of data applications to the available bandwidth on the network, which is the case of using TCP. Some video/audio applications can also react to the conditions of the path and adapt its coding bit-rate. In such flow control scenarios, the time of reaction can be of some round-trip-times of the flow trajectory, typically several milliseconds.
As we can see, the choice of QoS metrics for the home network is a key task. For instance, one may wish to have the lower number of QoS metrics that accurately represents the performance of a home network. This is very important for implementing the correct QoS mechanisms, monitoring and fault-detection tools. It is easier to deploy, routing, best path selection or admission control algorithms with only one link-state metric than with several metrics [114]. On the other hand, the fault diagnosis and network management processes
to deploy measurements and alarms. The latter is crucial, since the end-user and the service provider require simplicity for self-care and remote support in the home networks.
2.2. Home Network QoS Architectures
The evolution of home networks and their services have accompanied the development of telecommunications. As we have discussed, home networks tend to assimilate many of the QoS mechanisms found in large-scale networks. In this section, we illustrate a brief historical-background of the services and home network technologies that has determined the emergency of QoS standards in the home networks. We also discuss the most relevant architectures for QoS in home networks. We aim to underline the main QoS-mechanisms, found in these architectures, and associate them to their performance metrics.
2.2.1 Brief Historical Background
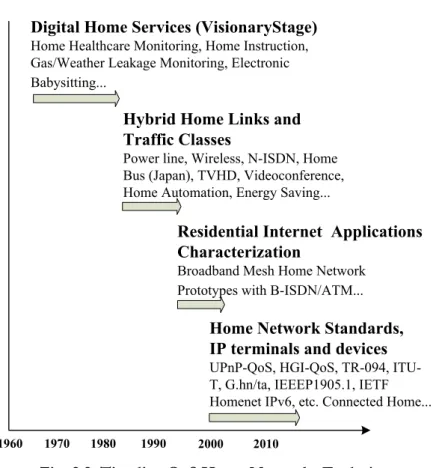
In the last five decades, we have seen the transformation of home network services and technologies, from the visionary stage to markets, technologies and standards in a significant period of maturation.
The ‘60s mark the revolution of digital communications [73] and the emergency of packet networks [95]. At the same time, several potential residential services are projected for taking advantage of the new digital networks. For example in [90], the author mentions the home-to-home video-telephony as a desirable service, but clearly some obstacles to its development, at that time, were the cost and reliability of the terminals.
The ‘70s is the beginning of the ARPANET and the TDM-networks for telephone services. At that time, naturally, many digital services for the residential market begin to be imagined. For instance in [72], the authors mention some of these services, which include “the home healthcare monitoring,” “the home instruction,” “the gas/weather leakage monitoring” and “the electronic babysitting.”
In the, ‘80s the definition of traffic classes and performance bounds for specific services becomes central for network dimensioning. At that moment, the home networks begin to be studied in terms of their potential analogical/digital signals (broadcast TV, broadcast radio, home automation, etc) and the required infrastructure for the home connections (wired and wireless links). In [24], a project called “Homenet” studies the control of the traffic in the home network, over heterogeneous transmission-media (such as power lines and infrared wireless links). In [28] and [18], “the home bus” is proposed as a uniform
cabling infrastructure. Also in [28], the authors contemplate several applications for the home network that only today begin to be deployed. These applications include digital HDTV, home-to-home videoconference, rich digital text, home automation and home security. In [107] and [81], a broadband home network is defined using ISDN-based service classes. Additionally in [27], the Power Line Bus (PLbus) with CSMA/CD spread spectrum is considered as a connectivity alternative.
In the second half of the ‘90s, the Internet is commercially opened [69], and it is required the characterization of the applications running on it for QoS purposes. From the point of view of the home network applications, in [63], the author lists a number of residential applications and associates them to three classes: streaming and block-transfer (both real-time), and applications of non-real-time. The author also associates these traffic-classes to some QoS requirements that include maximal supported delay, minimal bandwidth and the packet size distribution. In [21], a prototype of a home network in mesh, called “Warren” is described. Warren is based on an ATM switch of 25 Mbps ports, as a central home network node. Different ATM traffic classes are used, for instance Constant Bit Rate (CBR) on ATM adaptation layer 1 (AAL1) and Available Bit Rate (ABR) on AAL5. Warren connected home network terminals, including HiFi sound systems, TV, PCs and “baby monitors” (video cameras). Warren was compatible, to interconnect devices, with unshielded twisted pair (UTP), Plastic Optical Fiber (POF) or infrared links.
It was only, until the ‘2000s that the development of QoS standards got importance [96]. We describe some of the most relevant QoS standards for home networks in next section. Fig. 2.2 shows a time-line of the evolution of the home networks that we discussed before.
2.2.2 QoS Home Network Architectures
The home network QoS architectures tend to integrate characteristics of large-scale networks to prioritize and protect traffic classes. In this section, we compare most relevant QoS home network standards that we have found in literature. The detailed description of each standard is out of the scope of this work. Our aim is to identify some patterns in terms of management processes, QoS mechanisms and metrics, which are associated to these QoS architectures.
The considered standards are the Universal Plug and Play (UPnP) QoS [108], The Digital
Living Network Alliance (DLNA) [14], the Home Gateway Initiative (HGI) QoS [30], the TR-094/143 [104], the ITU-T G.hn/ta [44], [45], the IEEE P1905.1 [39] and the IETF Homenet IPv6 [1].
Now, let us compare the logical Planes of Management, Control and Data of the studied architectures of the home network, see Table 2.2.
On the Management-Plane, the HGI-QoS, the TR-094/143, and the ITU-T G.hn/ta consider some monitoring processes. These standards are more related with the telecom operator perspective than the rest of studied standards. For instance, the TR-143
Digital Home Services (VisionaryStage)
Home Healthcare Monitoring, Home Instruction, Gas/Weather Leakage Monitoring, Electronic Babysitting...
Hybrid Home Links and Traffic Classes
Power line, Wireless, N-ISDN, Home Bus (Japan), TVHD, Videoconference, Home Automation, Energy Saving...
Residential Internet Applications Characterization
Broadband Mesh Home Network Prototypes with B-ISDN/ATM...
Home Network Standards, IP terminals and devices
UPnP-QoS, HGI-QoS, TR-094, ITU-T, G.hn/ta, IEEEP1905.1, IETF Homenet IPv6, etc. Connected Home...
1960 1970 1980 1990 2000 2010
recommendation is a guide to measure throughput and other metrics that can help to diagnose the network performance from side of the network operator. The HGI-QoS, and the ITU-T G.hn/ta recommend local monitoring. The involved measurements (such as throughput or one-way-delay) can be done by active or passive probes. TR-143 and ITU-T G.hn/ta standards propose, for instance, using active probing.
On the Control-Plane, the UPnP-QoS, the HGI and the ITU-T G.hn/ta standards recommend the utilization of admission control and resource allocation, considering different metrics (e.g., delay, delay variation, packet-losses, and bandwidth). The three standards recommend the utilization of a single subnet, on tree-based-topologies. The IEEE P1905.1 [draft] [39] proposes the utilization of best-interface-selection and load balancing. The ITU-T G.hn/ta suggests the utilization of L2-optimal-routing and support mesh topologies. The IETF Homenet IPv6 [draft] recommends the reuse of existing protocols and the dual-stack IPv4/IPv6 operation. The IETF Homenet IPv6 [draft] is the unique standard that suggests using arbitrary topologies and multiple subnets. For example, it recommends the use of routing such as OSPFv3 based on delay, delay variation, packet-losses, or bandwidth. Finally, UPnP-QoS, HGI and TR-094/143 do not suggest the use of routing, nor L2-interface-selection, nor L2-path-selection.
On the Data Plane, the UPnP-QoS, the TR-094/143 and the ITU-T G.hn/ta standards suggest the utilization of IEEE 802.1D (Annex G)-based prioritization. On the other hand, the IEEE P1905.1 [draft] considers 802.1Q-based prioritization. The HGI-QoS does not define a specific prioritization protocol; however, it describes traffic classification and packet scheduling. Even though the DLNA standard has not a complete QoS-architecture, the “Home Networked Device Interoperability Guidelines” [14] considers 802.1Q-based prioritization. In [116], the authors mention the use of Differentiated Service Code Point (DSCP) for wireless and Ethernet, for DLNA devices. Finally, the IETF Homenet IPv6 [draft] recommends the use of Difserv-based prioritization.
It is worth of mentioning, that all those architectures consider a number of heterogeneous-links such as: Ethernet, WiFi, PLC, and Coaxial cabling. On the other hand, G.hn considers combinations of Telephone Wiring, PLC and coaxial. The IETF Homenet IPv6 [draft] consider sensor networks.
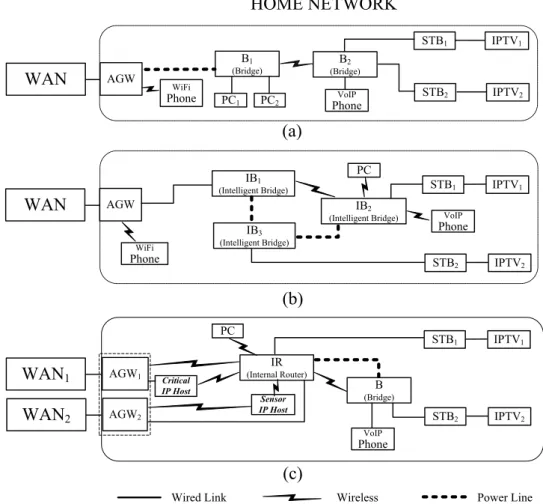
Fig. 2.3 shows three kinds of home networks defined over different topologies: the tree topology, the mesh topology and the arbitrary topology.
TABLE 2.2.QOSARCHITECTURES FOR HOME NETWORKS
QoS Mechanisms and Management Processes UPnP -QoS DLNA-based HGI -QoS TR-094/143 ITU-T G.hn/ta IEEE P1905.1 IETF Homenet IPv6 Management Plane
Access router diagnostics X
Access and home network segments measurement. (e.g. using UDP Echo Plus, probes some metrics Round Trip Time, Throughput)
X
Channel Estimation Protocol (end-to-end active probes)
X Links Performance Monitoring
(Including WiFi and PLC links)
X
Control Plane
Admission Control X X X
Resource allocation (with delay, jitter, packet-losses, bandwidth as flow and link-state metrics)
X
Bandwidth Allocation X X
L2 interface selection & load balancing (using packet errors or/and MAC-throughput as link-state metrics)
X
L2 optimal routing (shortest path tree using hop counts)
X L3 routing (using delay, jitter,
packet-losses, bandwidth as link-state metrics, e.g. OSPFv3)
X
Multiple subnets X
Support of tree topologies X X X
Support of mesh topologies X
Support of arbitrary topologies X
Data Plane
Classification/Marking/Queuing /Dropping (e.g. WRR)
X IEEE 802.1D (Annex G)-based
prioritization X X X IEEE 802.1Q-based prioritization X X Diffserv prioritization X
In Fig. 2.3 (a), we have the simplest of the three scenarios. It depicts the WAN link, which is connected to the access gateway (AGW) and to the two bridges (B1 and B2). The AGW
and the B1 are connected with a PLC link, while B1 and B2 are connected with a WiFi link.
A WiFi phone is also directly connected to the AGW. B1 has connected two PCs (PC1 and
PC2) using wired links. Additionally, STB1-IPTV1 and STB2-IPTV2 are connected with
wired links to B2. As we can see, the topology is a simple tree topology without redundant
links.
In scenario 2.3 (a), different management procedures for fault detection or service evaluation can be required, such as end-to-end performance monitoring, supported by the HGI-QoS, TR-143 or ITU-T G.hn/ta standards. Some home network performance indicators that can be included are the delay, delay variation, throughput, capacity or available bandwidth. These performance indicators can be measured from the WAN (TR-143) to the AGW, or to the STBs or to the PCs. The metrics can also be measured locally (HGI-QoS and ITU-T G.hn/ta), between the AGW and the home network devices.
AGW B1 (Bridge) B2 (Bridge) STB1 VoIP Phone WAN HOME NETWORK Critical IP Host Sensor IP Host PC1 IB2 (Intelligent Bridge) IB3 (Intelligent Bridge) (a) (b) (c) IR (Internal Router) STB2 IPTV2 WiFi Phone PC2 WiFi Phone PC VoIP Phone VoIP Phone PC AGW WAN AGW1 WAN1 AGW2 WAN2 STB1 IPTV1 STB2 IPTV2 Power Line Wired Link Wireless
B (Bridge) STB1 IPTV1 STB2 IPTV2 IPTV1 IB1 (Intelligent Bridge)

![Fig. 1. 2. “End -to- end residential path” based on ITU -T/Y.2173 [51]](https://thumb-eu.123doks.com/thumbv2/123doknet/11373365.286155/30.892.247.695.752.866/fig-end-end-residential-path-based-itu-t.webp)
![Fig. 2.1 is based on the ITU-T/Fig.13/Y.1001 recommendation [48] and shows graphically, the relationships among logical planes along the WAN and the home network segments](https://thumb-eu.123doks.com/thumbv2/123doknet/11373365.286155/39.892.172.764.819.1062/based-recommendation-graphically-relationships-logical-planes-network-segments.webp)