HAL Id: hal-02475669
https://hal.archives-ouvertes.fr/hal-02475669v2
Submitted on 2 Oct 2020
HAL is a multi-disciplinary open access
archive for the deposit and dissemination of
sci-entific research documents, whether they are
pub-lished or not. The documents may come from
teaching and research institutions in France or
abroad, or from public or private research centers.
L’archive ouverte pluridisciplinaire HAL, est
destinée au dépôt et à la diffusion de documents
scientifiques de niveau recherche, publiés ou non,
émanant des établissements d’enseignement et de
recherche français ou étrangers, des laboratoires
publics ou privés.
A Performance Measurement Extension for BPMN: One
Step Further Quantifying Interoperability in Process
Model
Xabier Heguy, Gregory Zacharewicz, Yves Ducq, Said Tazi, Bruno Vallespir
To cite this version:
Xabier Heguy, Gregory Zacharewicz, Yves Ducq, Said Tazi, Bruno Vallespir. A Performance
Measure-ment Extension for BPMN: One Step Further Quantifying Interoperability in Process Model.
Proceed-ings of the I-ESA Conferences Enterprise Interoperability VIII : Smart Services and Business Impact
of Enterprise Interoperability, 9, Springer International Publishing, pp.333-345, 2019, Proceedings of
the I-ESA Conferences, 978-3-030-13693-2. �10.1007/978-3-030-13693-2_28�. �hal-02475669v2�
A
Performance Measurement Extension
for
BPMN
One
Step Further Quantifying Interoperability in
Process
Model
Xabier Heguy, Gregory Zacharewicz, Yves Ducq, Said Tazi and Bruno Vallespir
Abstract Business process model and notation (BPMN) is becoming the most used
modeling language for business process. One of the important upgrades of BPMN 2.0 is the fact that data objects are now handling semantic elements. Nevertheless, BPMN does not enable the representation of performance measurement in the case of interoperability problems in the exchange of data objects, which remains a limitation when using BPMN to express interoperability issues in enterprise processes. We propose to extend the metamodel of BPMN in order to fill this gap. The extension, named performanceMeasurement, is defined using the BPMN extension mechanism. This new element will allow to represent performance measurement in the case of interoperability problems as well as interoperability concerns which have been solved. We illustrate the data interoperability capabilities with an example from a real industrial case.
Keywords Performance measurement
·
Interoperability·
BPMN·
Modeling·
CBP1
Introduction
The global economic context requires enterprises to acquire and maintain an effi-cient information system. An adapted and well-defined ERP is today a sine qua non condition for the success of a company. In addition, exchanges of information
X. Heguy · Y. Ducq (
B
) · B. VallespirUniv. Bordeaux, CNRS, IMS UMR 5218, 33405 Talence, France e-mail: [email protected]
X. Heguy
ONETIK, D252, 64240 Macaye, France S. Tazi
University of Pau and Pays de l’Adour, Pau, France G. Zacharewicz
between various information systems are increasingly necessary: In particular, infor-mation exchanges are growing with customers, suppliers, subcontractors or when the enterprise is bought out and integrated in another company, but also within an inter-nal department. Also, assuming one ERP covering all sectors of the company is not always possible, which entails grafting many heterogeneous ERP or at least modules. The crucial problem of interoperability then arises.
Cross-organizational business process (CBP) modeling aims to describe the inter-actions between different organizations [1] but also between different systems within a single organization. Process modeling at the highest level should enable the vari-ous partners to understand the articulation of the different processes in a simple and intuitive way. However, defining user needs is not necessarily collaborative. Users rarely understand the differences between inter-organization processes and internal processes.
BPMN 2.0 [2] is a standard for the modeling of enterprise business processes. BPMN is currently the most used language among process modelers (64% of industry penetration according to P. Harmon’s study) [3]. It provides a metamodel and notation for defining and visualizing them. BPMN 2.0 allows the modeling of CBP by clearly identifying independent resources pools and collaborative swim lanes within the same resource group. However, the representation of data in BPMN 2.0 does not reflect the concept of interoperability. Whether data are exchanged within the same information system or between two entities, the representation of the data remains the same. This is a weakness because this model hides the challenge and the difficulty of solving interoperability problems, in particular in the eyes of decision-makers. This lack of visibility can lead to incomprehension between IT technicians and managers and may lead them to underestimate both the impact of the lack of interoperability in the representation of the existing system and to make difficult the evaluation of costs and delays to produce the system to set up. In an earlier work, we introduced an extension to represent data exchanges presenting an interoperability issue as well as interoperability concerns which have been solved [4].
But BPMN does not either permit to represent performance measurement. Yet, making interoperability issues visible for all involved participants is not enough. An interoperability issue causes a data treatment in order to solve this problem. And this data treatment needs to commit resources, which is a waste of time and money. Then, in order to make the consequences of an interoperability issue evident, it is necessary to measure the performance of the actual process and to make visible the results of the measurement. In this way, all involved participants can easily make a comparison of these results and deduce that solving interoperability issues may result beneficial. The technical structuring of BPMN is based on the concept of extensible layers around a core set of basic elements. This extensibility makes it possible to define an overlay of elements in order to better represent concepts inherent in the targeted sector of activity. Each new layer is constructed in extension of a lower layer. BPMN extensions are most often used to represent the specific needs of an industry [4]. But they can also be used to fill a general gap. This is the proposition of this paper: prolonging the BPMN model specification by adding an extension which permits to display the results of performance measurement in that case of interoperability.
2
Background
2.1
Interoperability
The most common definition of interoperability tells us that it is: “the ability of two (or more) systems or components to exchange information and use it” [5]. The InterOp NoE (network of excellence in interoperability) defined interoperability as “the ability of a system to work with another system without effort on the part of the user” [6]. To complement these definitions, we can say that interoperability is “the ability of systems, natively independent, to interact in order to build harmonious and intentional collaborative behaviors without deeply modifying their individual struc-ture or behavior” [7]. These definitions demonstrate that interoperability is rapidly becoming complex and that its success depends on the resolution of a number of barriers [8].
There are three categories of barriers: conceptual (syntactic and semantic incom-patibilities), technological (incompatibility of IT architecture and platforms, infras-tructure, operating system, etc.) and organizational (incompatibilities of organization structure and management techniques) [9].
Three interoperability concerns are identified: interoperability of data, interoper-ability of service and interoperinteroper-ability of business.
According to EIF (enterprise interoperability framework) [9], we can notice three approaches of interoperability: integrated, unified and federated.
2.2
Performance Measurement
A problem of interoperability induces a processing of conformity of the data so that they can be exploited in the continuation of the process (most often reentry). This processing is a non-value-added task (NVA). Resolving the interoperability problem leads to the disappearance of this task. In order to highlight the need for this disappearance, it is necessary to display the figures represented by the resources used in this processing using performance indicators.
We have defined the following four performance domains: cost, quality, reliability and time. Cost, quality and time are the three most used indicators. Reliability is a part of quality. Indeed, if a datum does not comply with reliability, then it does not comply with quality. But in the case that interests us, it seemed that it should be interesting to measure it, because it is one of the most important sources of the non-quality of data. Indeed, most of the business software integrates control mechanisms. These mechanisms can force to insert relevant data (the data type is as it is expected), complete (all the fields have to be filled) and consistent (by limiting the values of the inserted data). But they will never be able to prevent the insertion of a bad value (non-reliable).
3
Related Works
Several works treat the problems of performance measurement visibility in BPMN models. Pavlovski and Zou [10] propose an extension that permits to identify the non-functional requirements. They introduce two new artifacts: The first, operating condition, indicates that a constraint is related to a flow object. The second, control case, specifies the business controls which will be set up to deal with the risk of the mode of operation. But these extensions do not permit to display any performance measurement.
Lodhi et al. [11] propose to extend BPMN. Their goal is to represent the impact of business objects in execution. They use different colors that indicate the performance level of activities and the use of different swim lanes for each dimension (for instance cost or time) and three lanes to show if the performance is low, medium or high. Other extensions are proposed that are out of the scope of this paper. But the proposed extension does not display the values of the performance measurement, and we think that these values have to be shown in order to be adequately appreciated.
The contribution of Saeedi et al. [12] adopts an annotation approach to make visible performance measurement. The proposed extension is based on the use of tables in which the results of performance measurement of a task or a process are displayed. In order to calculate the performance measurement of a process, they use reduction rules. They consider cost, time and reliability requirements. Then, this work is not interoperability oriented, and it does not consider data quality. Besides, their work has been very helpful for us.
All mentioned works cover the problems of performance measurement. But they do not cover the specific issue that is interoperability in data interchange between different information systems. This issue is traditionally reserved for IT technicians. This is surely useful, but it does not offer a possibility to make these problems visible for all the collaborating business partners (and not only IT technicians). With the extension we define in our work, we offer the possibility of that shared understanding, which is one of the main goals of BPMN.
4
Extension
Our aim is to create a sustainable extension of BPMN, which allows displaying per-formance measurement values of cost, quality, reliability and time in the framework of process diagrams, in order to solve interoperability issues in data exchanges. With dataInteroperabilityBarrier and dataInteroperabilitySolute we defined in our previ-ous work [4], this new extension can be used in very different business contexts, for example in inter-company data exchanges, in Web applications, etc. It will make possible to show practically the inconveniences caused by an interoperability prob-lem. The goal of this extension is not to solve interoperability problems (there is no automatic resolution of the problem), but to reveal it. It will permit to make evident
the interoperability problems in the AS IS model and show in the TO BE the benefits of solving them.
We propose the performanceMeasurement extension. It allows displaying in any task or task group the values of cost, quality, reliability and time indicators.
4.1
BPMN Extension Mechanisms
BPMN has been designed to be extensible. The technical structuring of BPMN is based on the concept of extensible layers around a core of simple elements. Extensi-bility is used to define an overlay of elements to better represent concepts inherent in the targeted industry. BPMN provides generic extension elements in the metamodel. BPMN has extension elements in order to add additional elements and attributes to the existing BPMN elements. These extension elements are: ExtensionDefinition, ExtensionAttributeDefinition, ExtensionAttributeValue and Extension. The Exten-sion element links an extenExten-sion to the BPMN model. The structure of this element is defined by the ExtensionDefinition element, which adds extra attributes. Each attribute is defined by a name and a type in the ExtensionAttributeValue element, and this value is set by the ExtensionAttributeDefinition element.
This extension permits the inclusion of the table definition that makes possible to display the values of performance measurement of cost, quality, reliability and time. The structure of the proposed element is defined through ExtensionDefinition and ExtensionAttributeDefinition elements.
The structure of BPMN is described through two representations:
• The Meta-Object Facility (MOF) metamodel in which the concepts are character-ized;
• The XML Schema Definition (XSD) in which the format for interchange is settled [13].
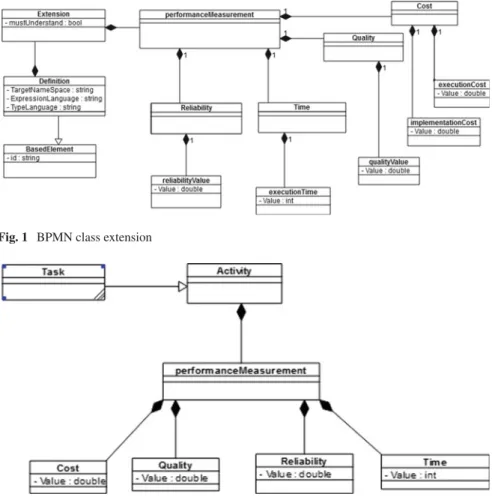
The class diagram of the MOF metamodel is presented in the specification manual. It is divided in different sections. We will only represent the section that concerns our study (see Fig.5).
We have defined the following ExtensionDefinition elements: cost, quality, time and reliability. The corresponding ExtensionAttributeDefinition elements are: imple-mentationCost and executionCost for the cost, qualityValue for the quality, execu-tionTime for the time and reliabilityValue for the reliability.
We can see in Fig.6 how the new extension is linked to the Definitions class (Figs.1and2).
Fig. 1 BPMN class extension
Fig. 2 Link with the BPMN metamodel
4.2
Performance Measurement Aggregation
As explained previously, an interoperability issue causes the necessity or a (or more) non-value-added task to address this issue. The final goal being to solve the interop-erability issues, it is necessary to compare the performances of the existing system (AS IS) with those of the future system (TO BE) in order to appreciate the benefits of this solving. But when the interoperability issue will be solved, the non-value-added task will disappear. Then, it will not appear in the TO BE model. We will then com-pare the performance of a unique task (in the TO BE model) with those of a set of tasks (in the AS IS model). We have then to be able to aggregate the performance measurements of two or more tasks.
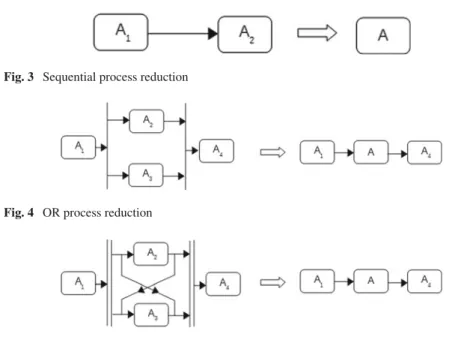
Fig. 3 Sequential process reduction
Fig. 4 OR process reduction
Fig. 5 AND process reduction
In this section, we propose a performance measurement aggregation model based on Ducq’s works to determine the different aggregation typologies in a data interop-erability scope [9].
(1) Processes reduction
We propose to use the stochastic workflow reduction (SWR) algorithm [14] to reduce the tasks. This algorithm uses six reduction rules: sequence, parallel, conditional, fault tolerant, loop and network. We consider that only the first three rules are relevant in the scope of data interoperability. Indeed, fault tolerant and loop rules are more IT oriented. And a network process block represents a sub-process. In the case we are discussing, there are most of the time two tasks: the data reception and the data processing (the non-value-added task) which is not enough to constitute a sub-process.
The reduction rules are successively used to a process. Following, a unique task remains. The performance measurement values of that task will then match with those of the entire business process. We reduce the Aitasks in the A task.
Sequential reduction: Here, all tasks are executed consecutively (Fig.3).
OR reduction: In this aggregation type, we can equally execute task A2 or A3,
having different performance characteristics. See Fig.4.
AND reduction: In this case, we have to execute both tasks (A2and A3), having
Fig. 6 performanceMeasurement representation
(2) Performance measurement aggregation
Once we solved the process reduction problem, we will define the formulas we will use in order to calculate the values of the aggregated tasks performances.
Sequential aggregation: Cost and time are equal to the sum of costs and times, respectively. Quality and reliability are equal to the product of qualities and reliabil-ities.
Cost:
C(A) = C(A1) + C(A2)
Quality:
Q(A) = Q(A1) ∗ Q(A2)
Reliability:
R(A) = R(A1) ∗ R(A2)
Time:
T(A) = T (A1) + T (A2).
OR aggregation: The values of cost and time are equal to the maximum of costs and times, respectively. The values of quality and reliability are equal to the minimum.
Cost:
C(A) = max(C(A1), C(A2))
Quality:
Q(A) = min(Q(A1), Q(A2))
Reliability:
Time:
T(A) = max(T (A1), T (A2)).
AND aggregation: The value of cost is equal to the sum of the costs. The value of the time is the value of the maximum time. The values of quality and reliability are equal to the products of qualities and reliabilities, respectively.
Cost:
C(A) = C(A1) + C(A2)
Quality:
Q(A) = Q(A1) ∗ Q(A2)
Reliability:
R(A) = R(A1) ∗ R(A2)
Time:
max(T (A1), T (A2)).
The aggregation based on multiplicative operator has a drawback: It can amplify the errors. But it makes them more visible, which is a good thing in our work’s scope.
5
Graphical Representation
We propose to provide the graphical representations for the performanceMeasure-ment extensions visible in Fig.7. This extension represents a table where the values of cost, quality, reliability and time are displayed. This table is coupled with every task or the task group from which we want to display the performance.
6
Use Case
To illustrate the interest of performanceMeasurement extension, we will study the case of Onetik SME. This company of the Basque Country manufactures and markets cheeses. It uses the Nodhos ERP. It is an SME, but it is a part of a supply chain, having many providers and clients. We can therefore think that it is a relevant use case.
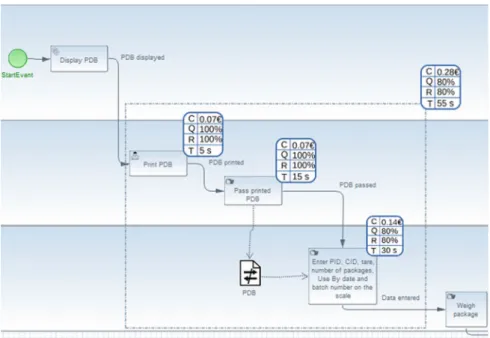
Fig. 7 AS IS model
The shipment management module of this ERP does not give it complete satisfac-tion, and its use is source of errors and therefore, among other things, disputes with customers that are costly for the company. The replacement of the ERP is not envis-aged in the short term mainly for financial reasons. The management of Onetik has then decided to graft the shipment management module of another ERP (InteGraal Agro).
In the framework of this project, two models were carried out using BPMN: One is corresponding to the existing system (AS IS) and the other to the desired system (TO BE). Each model consisted of several models of the various processes. We will represent the (simplified) process of order preparation.
This AS IS model (Fig.7) represents (a part of) real case proposed by the current organization of the information system. This is to be developed by describing the problem faced by the enterprise and the problem that is engendered by this situation. The actual ERP (Nodhos) permits to print a preparatory delivery bill (PDB) with the listing of the packages to be weighed. Then, this PDB has to be carried to the scale. Before weighing a package, some data have to be manually entered in the scale. These data are: product ID (PID), client ID (CID), tare, number of packages, use by date and batch number. It is obvious this is an interoperability issue. The data reentry task is a non-value-added task which presents a big risk of error.
After weighing the package, the values of weight and batch number have to be noted in the PDB (paper). The filled PDB is then carried back to the operator who
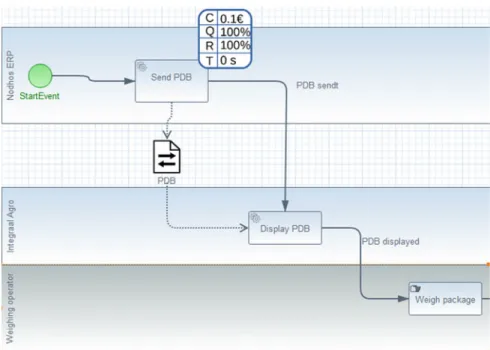
Fig. 8 TO BE model
enters in the ERP the values of weight and batch number, which presents a new possibility of error.
We grouped all the tasks involved in the data transmission, and we use the per-formanceMeasurement extension in each task as well as in each group. Of course, we used the reduction rules and the aggregation of performance measurement to calculate the values visible in the table coupled to the groups. We can now show the consequences of the interoperability issues to every participant of the project by displaying in the AS IS model the values of cost, quality, reliability and time of each task and each data transmission process. We will now be able to compare these values with those of the TO BE model which will solute the interoperability issues. We use the extension we proposed to represent the data exchanges presenting an interoperability issue [4].
The TO BE model (Fig.8) represents the solution that has to be implemented in order to solve the interoperability issues. We can see in this model that the interop-erability issues have been solved. Consequently, there is no more non-value-added task and the risks of errors induced by the reentry tasks have disappeared. But, we can display the values of performance measurement of the data transmission tasks.
With these two models, we can quickly make a comparison of the performances between the existing and the future systems. This will be useful to show to the performance improvement.
7
Perspectives and Implementation
These works are still under development even if the extension has been success-fully used in Onetik. The next phase will consist in implementing the proposition within a software solution. The BPMN 2.0 Modeler Project [15] has been selected for its capacity to integrate a model-driven approach, BPMN 2.0 models and simu-lation aspects. The conceptual phase has been achieved, and we are working on the development of this extension that will be the baseline for representing performance aspects on the BPMN model. A future work will be to plug a simulation engine to BPMN 2.0 modeler to make possible a machine-based processability.
8
Conclusions
This paper is proposing a BPMN 2.0 extension in the context of interoperability iden-tification and solving. This extension permits to display the values of performance measurement in the models for tasks or task groups involved in data transmission presenting an interoperability barrier and problem solved thanks to a graphical icon added to the original task or group item of BPMN. The interest of this approach has been illustrated on a use case from industry. These new features of BPMN allow bringing to light to all participants of a CBP project (managers, IT technicians, pro-cesses owners, etc.) the presence of an interoperability barrier and its solution.
References
1. ATHENA. (2005). D.A2.1: Cross-organisational business process requirements and the state of the art in research, technology and standards version 2. ATHENA Project No. (507849). 2. OMG. (2003). OMG: MDA Guide Version 1.0.1,www.omg.org/mda/
3. Harmon, P. (2016). The state of business process management 2016. Business Process Trends. 4. Heguy, X., Zacharewicz, G., Ducq, Y., & Tazi, S. (2017). Interoperability markers for BPMN 2.0. Making Interoperability Issues Explicit, Advances in Engineering Research. In 2nd Inter-national Conference on Electrical, Automation and Mechanical Engineering (EAME 2017) (Vol. 86, pp. 330–333).
5. Braun, R., & Esswein, W. (2014). Classification of domain-specific BPMN extensions. In The practice of enterprise modeling. Berlin: Springer.
6. Geraci, A., Katki, F., McMonegal, L., Meyer, B., Lane, J., & Wilson, P., et al. (1991). IEEE standard computer dictionary: Compilation of IEEE standard computer glossaries.
7. Konstantas, D., Bourrières, J. P., Léonard, M., & Boudjlida, N. (2005). Interoperability of enterprise software and applications.
8. Truptil, S., Bénaben, F., Pingaud, H. (2010). A mediation information system to help to coor-dinate the response to a crisis. In L. M. Camarinha-Matos, X. Boucher, H. Afsarmanesh (Eds.), Collaborative networks for a sustainable world (Vol. 336, pp. 173–180). Springer, IFIP Advances in Information and Communication Technology. 978-3-642-15960-2.
9. Ducq, Y. (1999). Contribution à une méthodologie d’analyse de la cohérence des Systèmes de Production dans le cadre du Modèle GRAI.
10. Pavlovski, C. J., Zou, J. (2008). Non-functional requirements in business process model-ing. In Proceedings of the fifth Asia-Pacific conference on Conceptual Modelling (Vol. 79, pp. 103–112). Australian Computer Society, Inc.; Petriu, D., Bernardi, S., & Merseguer, J. (2008). An UML profile for dependability analysis and modeling of software systems. Tech-nical report, Universidad de Zaragoza, Spain.
11. Lodhi, A., Köppen, V., Saake, G. (2011). An extension of BPMN Meta-model for evaluation of business processes.
12. Saeedi, K., Zhao, L., Sampaio, P. (2010). Extending BPMN for supporting customer-facing service quality requirements.
13. Cortes-Cornax, M., Dupuy-Chessa, S., Rieu, D., & Dumas, M. (2014). Evaluating choreogra-phies in BPMN 2.0 using an extended quality framework.
14. Cardoso, J., Sheth, A., Miller, J., Arnold, J., & Kochut, K. (2004). Quality of service for workflows and web service processes.