HAL Id: hal-01077545
https://hal.archives-ouvertes.fr/hal-01077545
Submitted on 25 Oct 2014
HAL is a multi-disciplinary open access
archive for the deposit and dissemination of
sci-entific research documents, whether they are
pub-lished or not. The documents may come from
teaching and research institutions in France or
abroad, or from public or private research centers.
L’archive ouverte pluridisciplinaire HAL, est
destinée au dépôt et à la diffusion de documents
scientifiques de niveau recherche, publiés ou non,
émanant des établissements d’enseignement et de
recherche français ou étrangers, des laboratoires
publics ou privés.
Impacts of video Quality of Experience on User
Engagement in a live event
Mamadou Tourad Diallo, Frédéric Fieau, Jean-Baptiste Hennequin
To cite this version:
Mamadou Tourad Diallo, Frédéric Fieau, Jean-Baptiste Hennequin. Impacts of video Quality of
Experience on User Engagement in a live event. ICME 2013: International Conference On Multimedia
and Expo, 2014, pp.1 - 7. �10.1109/ICMEW.2014.6890652�. �hal-01077545�
IMPACTS OF VIDEO QUALITY OF EXPERIENCE
ON USER ENGAGEMENT IN A LIVE EVENT
Mamadou Tourad Diallo
Frédéric Fieau Jean-Baptiste
Hennequin
Orange Labs Networks / Audiovisual Network Delivery, Orange
Issy-les-Moulineaux, France
{mamadoutourad.diallo},{frederic.fieau},{jeanbaptiste.hennequin}@orange.com
ABSTRACT
In order to understand the effects of QoE (Quality of Experience) on User Engagement, we measured QoE metrics on client side during Roland Garros 2013, an international tennis tournament broadcast live over the Internet. We analyze the impacts of four metrics on User Engagement: the video startup time, buffering ratio, average bitrate and content popularity. Our results demonstrate that video buffering is a critical parameter which impacts end-user satisfaction. We show also that content popularity is an important parameter of our analysis, whereas the video startup time is less significant. We highlight the relationship between the average bitrate and User Engagement in the case of popular content. Finally we confirm a correlation between metrics.
Index Terms
—
User engagement, QoE, video1. INTRODUCTION
The Quality of Experience (QoE) quantifies either objectively the played video quality by metrics measurements, or its subjective perception by the end-user. It has become a topic of interest for many actors of the content delivery value chain.
On the one hand, Content Providers are more and more interested in their content usage and perception. They usually rely on simultaneous delivery systems to deliver their contents, such as Content Delivery Networks (CDN), and Cloud Networks. One of their requirements regarding quality is to know exactly how the content was consumed, at which quality level or if content playing was smooth or not, etc. When relying on several heterogeneous systems, it becomes difficult to have an aggregated view on the overall content delivery quality.
On the other hand, Internet Service Providers (ISPs) are used to invest every year to maintain and improve their networks and IT system. If they are able to monitor in real-time the network status, they often lack of system which is able to show precisely the QoE that is really perceived on
user-side. Monitoring client QoE appears for them as a complementary means to the real-time QoS (Quality of Service) monitoring methods to improve the overall Quality of their networks. In this context, some companies [1][2] are now selling real-time QoE monitoring services dedicated to ISPs and Content Providers. Their services require slight modifications on the video player [1] [2].
In our case, we tested QoE measurements with a developed prototype able to retrieve QoE metrics on client side. The QoE monitoring was realized on a single event, Roland Garros 2013, an international tennis tournament occurring every year since 1928, in Paris, France [3]. This event is the second prestigious tennis competition in the world after Wimbledon and the most watched.
This opportunity allowed us to begin an analysis of contents usages and quality in case of specific events. The aim of this article is to expose the results and to draw conclusions regarding QoE impacts on User Engagement on this specific content.
This paper comprises 5 sections. In the second section, we synthesize the state-of-the-art of the QoE analysis. The third section is dedicated to a brief event description and the developed prototype. The fourth section presents the results and synthesis. Finally, the fifth section concludes this paper.
2. RELATED WORK
Internet Service Providers (ISPs) use Quality of Service (QoS) parameters such as bandwidth, delay or jitter to ensure service quality. According to [4], the proliferation of multimedia contents put the stress on the management of QoS in order to improve or guarantee QoE (e.g. Service Level Agreements). Thus is raised the challenging question of “how to quantify QoE through measures?”
In this section, we introduce classical objective and subjective methodologies from the literature and rendering quality of the video based on embedded agents on client device.
First of all, the objective measurement of QoE follows an approach that doesn’t require end-user’s feedback to predict the quality of the perceived content. An example of comparative method is the PSNR (Peak Signal-to-Noise Ratio) which is based on the power balance between the
native information and the background noise generated by distortion after compression or recompression. It is defined via the Mean Squared Error (MSE) between an original frame o and the distorted frame d as presented in [5].
On the contrary, some direct approaches do not require reference information on the original content. For instance, the method presented in [6] is based on a metric that quantifies blurring phenomena along edges and contours in video images due to video degradation. Please note that the required parameters and inputs are all available on client side.
Furthermore, these techniques do not consider the user’s opinion about streamed content and then are not very accurate to measure the user satisfaction. On their side, subjective methodologies are the most fundamental approaches for evaluating QoE. It is based on surveys, interviews and statistical sampling of customers to analyze their perception and needs with respect to the service and network quality. Several subjective assessment methods suitable for video application have been recommended by ITU-T Recommendation P.910 [7] and ITU-R Recommendation BT 500-11 [8]. The most famous subjective metric is the MOS (Mean Opinion Score), where subjects are required to give ratings (1 for “Bad” to 5 for “Excellent”).
In order to analyze subjective data after collection, both quantitative techniques (e.g., statistics, data mining…) and qualitative techniques (e.g. grounding theory, canonical correlation analysis…) can be used to extract models and trends [9]. But it is not realistic to ask all viewers their scores as it can be very annoying for end-users.
There are growing client-side methods for measuring and predicting QoE for multimedia and audio-visual services. These tools use metrics on the client side to evaluate the perceived quality by the end-users.
In [10], authors investigated the impacts of video startup time on user’s perceived QoE by dealing with subjective tests on the user satisfaction of different applications (YouTube video streaming, wireless Internet connection setup and social networks authentication). They showed that the perception of video startup time depends on the considered application. For YouTube, up to 30 seconds, end-users were satisfied. For the setup in the wireless Internet connection, authors found that, the end-users perception was acceptable up to 15 seconds. However for social networks authentication, users were more demanding, a video startup time of 8 seconds led to a MOS value of 2, which was considered as poor.
In [11], by using client-side instrumentation, authors measured quality metrics such as the video startup time, buffering ratio, average bitrate, rendering quality and rate of buffering events. They particularly worked on correlation between the User Engagement and quality metrics. They indeed demonstrated that the buffering ratio is the critical parameter in case of live and Video on Demand (VoD) event. In particular, authors found that a 1% increase in
buffering ratio can reduce User Engagement by more than three minutes for a 90 minute video live event. In this work, they highlighted that the average bitrate has more importance in the case of live shows than VoD service, but they did not found any correlation between the average bitrate and the User Engagement. This work considered specifically popular contents whereas unpopular contents were not studied. The proposed method in [12] measured the end-user’s perception by using client-side log data captured directly from the video player in user’s terminal, which enabled a detailed understanding of quality of service (QoS) and User Engagement metrics.
In this paper, the term QoE will refer to the rendering quality of the video measured on the end-user side. For this purpose, we investigate the influence of parameters, also called QoE metrics on video play time (the time spend by the end-user viewing the video). We propose to answer such questions: how video play time varies with startup time, buffering ratio, average bitrate and buffering events for live popular and unpopular contents events.
3. EVENT DESCRIPTION AND DATA COLLECTION
In this section we briefly introduce the Roland Garros event, the developed prototype and how data were collected on the client side.
3.1 Roland Garros Event
Roland Garros is a broadcast live event. Among the available audiovisual sources, the Roland Garros 2013 event is aired on TV but also on the Internet.
Actually, Roland Garros channels were accessible for all Francophone Internet users including France, Dom-Tom (French overseas departments and territories) and Monaco for this trial. The 2013 edition spread over 2 weeks (from the 05.27.2013 to 06.09.2013). Each channel aired a single tennis court, such as Chatrier, court n°3, Lenglen, etc. Tennis matches were scheduled during the day, depending on the initial match table and results. Matches with high ranking players were usually disputed on the court Chatrier, also called Central Court, and Lenglen.
3.2 Channel delivery
Two solutions were used for channels delivery: an origin service platform located in Paris composed of two centralized servers and a Content Delivery Network (CDN) which had distributed and redounded servers in 15 regional PoPs (Points of Presence) in France. Those two solutions were able to deliver 50% of the Roland Garros channels for the Internet broadcast.
The channels were available in HTTP Adaptive Streaming (HAS) techniques. HAS allows the player to get the video stream at different quality profiles depending on
the network status between the end-user and the server. This trial used Standard Definition (SD) profiles from 342 kbps up to 1340 kbps to High Definition (HD) profiles from 1910 kbps up to 2860 kbps.
3.3 Prototype and Gathered Data
The objective of the system was to measure in real-time the quality of the video streams (or channels) received by the end-user on the Internet, and to analyze afterwards the aggregated data.
QoE metrics were gathered through a prototype composed of three main modules. On client side, we developed a javascript code which was able to interact with the video player loaded by the browser to retrieve the needed metrics during the users’ video session. On the server side, a centralized module periodically collected and stored data received from the javascript component. Furthermore, data analytics was done by another standalone module.
At this time, the prototype gathered metrics such as: • Video bitrate, i.e. the current video encoding profile, • Startup time, i.e. the delay between users click on
playback and the playback starts,
• Number of buffering events, i.e. number of buffering instants when the player’s buffer lacked of data forcing the player to freeze,
• Buffering duration, i.e. the cumulative time during which the video was buffering.
• Video play time, i.e. the end-user session time watching the requested content.
At peak, the prototype was able to monitor and analyze 50k sessions.
4. ANALYSIS AND RESULTS
In this section, we define the gathered Quality of Experience metrics and the User Engagement and show results regarding the effects of these metrics on User Engagement, for popular and unpopular contents during Roland Garros.
4.1 Impacts of QoE metrics on User Engagement for popular contents
In our analysis we focus on the impact of startup time, buffering ratio and average bitrate on the video play time. However, regarding buffering events, we decided not to report the impact of this metric on the video play time because nearly 75% of all sessions had less than 2 buffering events, meaning it was not significant enough to perceive a possible correlation between both metrics.
The User Engagement is usually defined as the number of time the user has visited the video platform, or can be based on user actions on the streaming (channel hopping, pause, rewind/back the video …), or yet the video play time. In this work, as we analyze the QoE of video streaming contents, the play time appears to be a good indicator to represent the User Engagement and can be measured objectively. From a business point of view, this metric is particularly interesting for Content Providers and ISPs who want to measure the audience and analyze the Quality of Experience and its impacts.
In this paper, we take the example of a popular content of Roland Garros 2013 which is the ¼ final Tsonga (FRA)-Federer (CH) (on the 06.04.2013) on the Central Court: a famous match that attracted many viewers. We observed a peak in charge during this match likewise other matches occurring on Chatrier. Such content was popular not only because the number of sessions was 40% higher compared
(a) Startup time CDF (b) Buffering ratio CDF
(c) Average bitrate CDF (d) Buffering events CDF
to other contents, but also, we observed that channel hopping was less frequent and also that the sessions duration was 30% higher in average than for less popular contents. In Fig. 1, we show the Cumulative Distribution Functions (CDF) associated to QoE metrics.
4.1.1 Distribution of video startup time
The video startup time shows that 64% of sessions had a video startup time < 1 s, meaning that more than half of the sessions started almost instantly (see Fig.1.a)
4.1.2 Distribution of buffering ratio
The Buffering ratio defined as the ratio of the cumulative time, i.e. buffering duration, during which the video was buffering over the total video session duration. It is commonly expressed as a percentage. According to [11] sessions which buffering duration exceeds 5 seconds or which have a buffering ratio higher than 2% can be considered as impacted by buffering. Following this latter threshold, we saw therefore that 45% of sessions were affected by buffering (Fig.1.b). This result was quite surprising at first because we observed that buffering occurred on all sessions, whatever the average bitrate range and whatever the networks (Autonomous Systems) involved.
This told us that neither the network (nodes and links) nor the servers delivering content (CDN and central platform) couldn’t be the cause of buffering, but instead the player on client side or the user behavior. Indeed, as many sessions lasted a few seconds (mainly due to channel hopping), if a short buffering event happened on these sessions, the number of impacted sessions would have quickly increased. The other reason may come from the player. Unfortunately we did not have access to its code nor its parameters to study and understand its behavior.
4.1.3 Distribution of video bitrates
For the average bitrate which is the average of bitrate profiles played during a session, Fig.1.c shows that 80% of sessions had an average bitrate above 1100 kbps. We also noticed that a high number of sessions are impacted by buffering ratios and only a small number of sessions had higher average bitrates (> 1100 kbps). Indeed, the most requested bitrate profile was 977 kbps. This also confirmed that network connectivity was acceptable for a wide range of users, as it offered more than 1 Mbps and low startup time (less than 1 s).
4.1.4 Correlation between metrics and User Engagement
In this section, we analyze how QoE metrics are correlated with video play time. Fig. 2 to Fig. 4 represent the mean video play time regarding QoE metrics.
• Correlation between startup time and User Engagement Regarding Fig. 2, no clear trend has been observed between the video startup time and the video play time. We could therefore infer that up to 10 seconds, the video startup time did not disturb the viewers. As a matter of facts, users were ready to wait for their session to start. A reason for this could be that live sport events like Roland Garros have the singularity to be broadcast once a year. That’s why they are likely to catch the attention of more users than casual sports programs like weekly football matches. They can even attract users that don’t regularly watch sports on TV. As previously said in [10], the viewer’s sensibility to video startup time depends on the considered application, in our case (live sport event), it was found that the sensibility was indeed different than the considered applications in this work (see Fig. 2).
• Correlation between buffering and User Engagement Regarding buffering ratio, we observed a correlation between the buffering ratio and the User Engagement (see Fig. 3). In this case a jump of 1% buffering ratio induced a drop of the User Engagement from 37 min to 12 min. In other words, a 1% gain in buffering ratio induced a difference of 25 min for this kind of popular content.
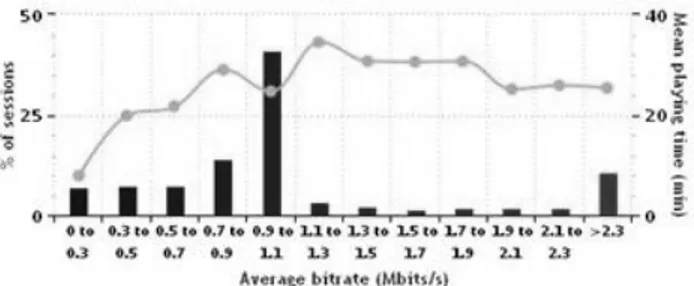
• Correlation between average bitrate and User Engagement
According to Fig.4, we observed a correlation between the video play time and average bitrate. We did notice that the User Engagement increased when the session average bitrate reached a threshold near [1100-1300] kbps. Beyond this threshold, the correlation between average bitrate and User Engagement remains almost stable.
The user’s behavior after the threshold could indicate that users’ were not able to differentiate the video quality after a certain level. Increasing the video quality after this point did not increase the User Engagement.
• Mathematical correlation between metrics and User Engagement
Next Fig. 5, 6 and 7 represent the scatter plot of play time as a function of several QoE metrics for each session and Table 1 shows values of the Kendall coefficient which is a statistic measure to quantify the relation between two variables. Unlike the Pearson coefficient, this coefficient does not make the assumption that the relationship between parameters is linear. They confirmed that buffering ratio is a critical metric that may negatively impact the User Engagement. But regarding video startup time and average bitrate, Kendall coefficient values showed less correlation
with video play time.
4.2. Impacts of QoE metrics on User Engagement for unpopular content
This section shows in brief the impact of QoE metrics for unpopular content. We consider as an example of unpopular content, the ladies’3rd round (Sharapova-Zhang) on Philippe Chatrier court. This match was not as popular as other contents on the central court as it attracted far less people compared to the other matches, but also, channel hopping is frequent, and secondly, the session duration is lower in average (30%) than for popular contents.
We still note that even if the content is not popular, the buffering ratio remains a critical parameter that may negatively influence the video play time. However, there is no trend between the video play time and others metrics (average bitrate and video startup time).
As a matter of fact, the content popularity changes the users’ expectations. We indeed assumed that content popularity is a crucial parameter to take into account in the QoE impacts analysis on user engagement, because the user behavior might not be as predictable as for popular content.
4.3. Correlation between QoE metrics
Fig. 5. Scatter plot for play time versus buffering ratio Fig. 6. Scatter plot for play time versus startup time
Fig. 7. Scatter plot for play time versus average bitrate
Table 1. Kendall coefficient shows a correlation
between two variables
Metrics Kendall Coefficient
correlation with User Engagement
Startup time 0.04
Buffering ratio -0.57
Average bitrate 0.23
Fig. 8. Average bitrate versus buffering ratio
The Quality of Experience (QoE) metrics are not independent between them. In this paragraph, we analyze the interaction between some of these relations.
4.3.1. Video bitrate and buffering ratio
In order to reduce buffering ratio, HAS algorithms reduce the video bitrate based on the current network status as evaluated by the user equipment. As shown in Fig. 2, users are very sensitive to buffering, and then reducing this parameter can improve the User Engagement. In the following Fig. 8, we can see that the average bitrate is correlated with buffering ratio. The Kendall coefficient is ~ - 0.20 which indicates without much surprise that both metrics are negatively correlated.
4.3.2. Video bitrates and video startup time
According to [13], higher video quality would mean higher video profile, because the video player would take longer to buffer at session start. However, this fact was not confirmed in our tests as we did not notice any correlation between the video bitrate requested by the player at start and the startup time. It can mean that the requested bitrate profile by the player at session start is always adapted to the network bandwidth capacity between the end-user and the server.
5. CONCLUSION AND PERSPECTIVES With the explosion of multimedia and audiovisual services and the high competition between video services offers, Quality of Experience becomes a hot topic for Content Providers and Network Operators to continue gaining users’ satisfaction by providing high quality services and improve the Average Revenue Per User (ARPU).
In this work, we analyzed the effect of QoE metrics - buffering ratio, video startup time, and average bitrate - on User Engagement for popular and unpopular contents during Roland Garros 2013 event. In our analysis, the buffering ratio appears as a critical parameter which impacts the video play time whatever the content type. Additionally, the video bitrate is a critical parameter which impacts the User Engagement up to a certain threshold in the case of popular
contents. We find also that video startup time is less significant until a certain level for popular contents.
This paper showed that analyzing QoE metrics and their impact on User Engagement is complex, even on a single content type. As we noticed, the video play time may depend on many factors: the video QoE metrics, network conditions, but also on more subjective parameters like the user behavior and their expectations regarding the contents. As the study shows, a correlation between QoE parameters and the user engagement has been clearly observed. However, even if gigabytes of information were gathered and analyzed over thousands of clients, questions still reside. One among them is which factor is the most preponderant on the User Engagement at which moment ?
To get elements of a response, we will need, as a next step, to collect additional parameters to better understand what really happens on client side, this information could include the CPU usage, the video playing frame rate, player window size and context information (device type, content type, user preferences, network status …). Other leads would be also for instance to fetch external data sources (e.g. social networks), or to determine more precisely how the player copes with situations with fluctuant network and terminal conditions. This work aims at heading towards a data mining solution with a smart data processing engine.
5. ACKNOLEDGEMENTS
We would like to thank Dr Iuniana Oprescu, Ph.D and Thierry Lejkin for their feedbacks and recommendations that helped improve this paper.
6. REFERENCES
[1] Conviva, www.conviva.com
[2] Fortinet, www.fortinet.com
[3] Internationaux de France, Roland Garros, http://fr.wikipedia.org/wiki/Internationaux_de_France_ de_tennis
[4] I.Martinez-Yelmo, I.Seoane, C.Guerrero, “Fair Quality of Experience (QoE) Measurements Related with Networking Technologies,” WWIC'10 Proceedings of the 8th international conference on Wired/Wireless Internet Communications, Pages 228-239, Springer 2010.
[5] A. N. Netravali and B. G. Haskell, “Digital Pictures: Representation, Compression, and Standards (2nd Ed),” 1995.
[6] P. Marziliano, F. Dufaux, S. Winkler, T. Ebrahimi, “A no-reference perceptual blur metric,” Image Processing. International Conference on Vol. 3, 2002.
[7] ITU-T, P.910, “Subjective Video Quality Assessment Methods for Multimedia Applications,” 1999
[8] ITU-R,BT 500-11, “Methodology for the Subjective assessment of the quality of Television Pictures,” 2002
[9] Laghari, Khalil Ur Rehman., Khan, I, Crespi, N.K.Laghari, “Qualitative and Quantitative Assessment of Multimedia Services in Wireless environment,” MoVid, ACM Multimedia system USA 22-24 Feb 2012.
[10] Tobias Hoßfeld, Sebastian Egger, Raimund Schatz
Markus Fiedler, Kathrin Masuch, Charlott Lorentzen “Initial Delay vs. Interruptions: Between the Devil and the Deep Blue Sea”. QoMEX 2012, Yarra Valley, Australia, July 2012
[11] Dobrian, Awan, Stoica, Sekar, Ganjam, Joseph. Zhan,
“Understanding the Impact of Video Quality on User Engagement,” SIGCOMM 2011
[12] Skytide, www.skytide.com
[13] Athula Balachandran, Vyas Sekarz, Aditya Akellay,
Srinivasan Seshan, Ion Stoica, Hui Zhang, “Developing a Predictive Model of Quality of Experience for Internet Video,” SIGCOMM’13