WORLDWIDE INTERLABORATORY STUDY ON PCDDs, PCDFs, DIOXIN-LIKE
PCBs, MARKER PCBs AND PBDEs IN HUMAN PLASMA
Eppe G, De Pauw E, Focant J-F
CART Mass Spectrometry Laboratory, Chemistry Department, University of Liège, Allée de la Chimie 3, B-6c Sart-Tilman, B-4000 Liège, Belgium
Abstract
This paper describes a worldwide interlaboratory study on PCDDS, PCDFs, dioxin-like PCBs, indicator PCBs and PBDEs in no-artificially fortified human blood plasma. The study took place from January 2006 to July 2006. The test material was sent to 10 participants from 7 countries. The study design involved the analysis of one test sample in triplicate. The results reported for PCDDs were satisfactory with a range of relative standard deviation (RSD) of 9-25%, except OCDD (RSD 61%). Four congeners (2, 3, 4, 7, PentaCDF, 1, 2, 3, 4, 7, HexaCDF, 1, 2, 3, 6, 7, 8-HexaCDF, 1, 2, 3, 4, 6, 7, 8-HeptaCDF) out of the ten PCDFs were measured reliably (RSD 11-28%). Good results were achieved for PCBs except the CB 77 (RSD 48%), CB 28 (RSD 50%), CB 52 (RSD 63%), CB 101 (RSD 60%). Levels of PBDEs in the test material were very low (i.e. ng/L range). Results showed that a further improvement for BDE 47 (RSD 114%) and BDE 99 (RSD 81%) is needed. Too scarce results were reported for BDE 209 to assess its performances. The study also highlighted the issue of lipid determination. Enzymatic methods provide higher results compared to gravimetric methods. As scientific literature compares human exposure to these contaminants on a lipid weight basis in serum, the results presented here point out the necessity of standardizing lipid measurements.
Introduction
Human biomonitoring focused on the exposure to PCDDs, PCDFs, PCBs and PBDEs demands the availability of reliable data on the concentration of these contaminants in adipose tissues, blood and breast milk. The difficulties in obtaining human adipose tissues limit its use in epidemiological studies. Breast milk and blood collection are a much less invasive procedure but they present significant analytical challenges. Breast milk has the advantage to have high content of fat and high levels of target compounds compared to serum, making the extraction easier and the precision of the measurement on lipid weight basis easier. Since the mid-eighties, the World Health Organisation (WHO) has coordinated programme on possible health risks of those contaminants, especially in infants, due to exposure through contaminated breast milk. It has however the double disadvantage to be limited to a specific part of the general population and to require great care concerning the time point at which samples are collected in regards of toxicant depuration while breast feeding is taking place. Blood then appears as an interesting alternative as it can be easily obtained but it has the disadvantage to lower the target compound levels, as the lipid content is below 1% by weight. A previous international intercalibration study on PCDD/Fs in human milk and blood already pointed out that the RSDs of the data from blood tent to be systematically larger for a given PCDD/Fs congener than the data from milk1. This survey sums up the analytical performances of laboratories for PCDD/Fs, for some PCBs and also for PBDEs in blood more than fifteen years after the last exercise.
Materials and Methods Test Material
The test material consisted of naturally contaminated human blood plasma not fortified with standards. It represents an aliquot of a pool of 5000 Belgian male and female donors aged from 18 to 65 years old. Participants received a
2
defrost during transport, they were immediately replaced. Thus, all the participants received the material in the requested conditions. The batch sample was tested for homogeneity before shipping. Six sub-samples of 20 ml were randomly sampled from six different bottles. Target analytes were analyzed under repeatability conditions and RSDs between 3% and 10% were achieved for the different congeners.Target compounds
The content in all the seventeen 2,3,7,8 toxic PCDD/Fs, the twelve dioxin-like PCBs (77, 81, 105, 114, 118, 123, 126, 156, 157, 167, 169, 189), the six indicator PCBs (28, 52, 101, 138, 153, 180), and eight PBDEs (28, 47, 99, 100, 153, 154, 183, 209) were measured by GC-HRMS.
Methods used by the participants
Participants applied their own extraction and clean-up procedures. Three laboratories performed an acidic pre-treatment of the sample prior to extraction; seven laboratories not. All laboratories spiked with the seventeen 13 C-labelled 2,3,7,8 substituted PCDD/Fs, the twelve 13C-labelled dioxin-like PCBs, the six 13C-labelled indicator PCBs and the seven or eight 13C-labelled PBDEs. Extraction methods were mainly liquid/liquid (7x) and C18-solid phase extraction (SPE) (3x). Classical multi-steps clean-up on columns with different adsorbents (silica, alumina, florisil and carbon) were carried, each laboratory has its own validated procedure. Different GC columns and different standard solutions were used but all used high-resolution sector instruments operating in electron impact at 10000 resolution in selected ion monitoring mode (except lab 7 for mono- and di-ortho PCBs). An overview of the GC-HRMS methods used is given in Table 1.
Lipid determination
Participants performed a separate lipid determination on the plasma. They used their own lipid determination procedure. Five laboratories used a gravimetric method and five laboratories reported data with an enzymatic method.
Study design
The statistical treatment of the data was performed on ‘results corrected for blanks’. For several reasons, some laboratories estimated not relevant or not necessary to remove the blank, others lost the blank. For those labs, the ‘results not corrected for blanks’ were used.
To determine the consensus value, we have selected the following approach. For all target analytes, median were calculated for all reported results. ‘ND’, ‘<LOD’ or ‘<LOQ’ were not used for assessment of the median due to the wide range of LOD/LOQ reported by participants. In addition, obvious outliers above ± 2 standard deviation (SD) were removed to assign values.
Results and discussion
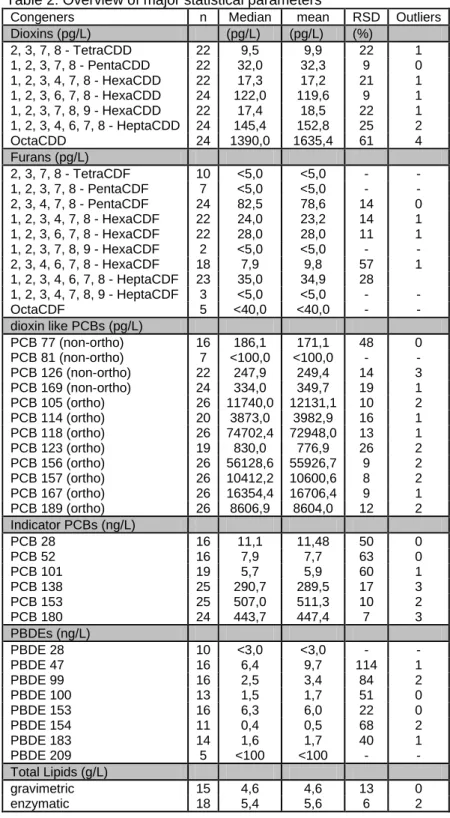
Table 2 summarizes the performances. Due to low levels, high dispersion and few reported results, the following congeners (2,3,7,8-TetraCDF; 1,2,3,7,8-PentaCDF; 1,2,3,7,8,9-HexaCDF; 1,2,3,4,7,8,9-HepaCDF, OctaCDF, PCB 81, PBDE 28, PBDE 209) were not statistically treated. According to the provided data, only an indicative value ‘less than’ was reported. Basic statistics calculated for each analyte include the median, the mean and the relative standard deviation RSD (%). RSDs between 9% and 25% were obtained for PCDDs except for OCDD (61%) for which two laboratories reported much higher values. We already mentioned the difficulty to reliably measure five
length, ID, Film thickness) x 0.25µm x 0.10µm x 0.10µm x 0.25µm x 0.25µm x 0.10µm x 0,17µm x 0.33µm x 0.25µm
run time 53 min 50 min 40 min 30 min 45 min 45 min 40 min 50 min 47.5 min
Column 2 (sat. phase, RTX-2330
length, ID, Film thickness) 60m x 0.25mm x 0.2µm
run time 55 min
Detector HRMS HRMS HRMS HRMS HRMS HRMS HRMS HRMS HRMS
Non-Ortho PCBs
Column 1 (sat. phase, DB-5MS DB5 HT8 DB5-MS DB5-MS DB5 BPX-5 VF5-MS HT8 Not measured
length, ID, Film thickness) 60m x 0.25mm x 0.25µm
60m x 0.25mm x 0.10µm 50m x 0.22mm x 0.25µm 30m x 0.25mm x 0.25µm 60m x 0.25mm x 0.25µm 60m x 0.25mm x 0.10µm 50m x 0,32mm x 0,17µm 50m x 0.20mm x 0.33µm 60m x 0.25mm x 0.20µm
run time 53 min 45 min 40 min 30 min 45 min 45 min 40 min 50 min 55 min
Detector HRMS HRMS HRMS HRMS HRMS HRMS HRMS HRMS HRMS
Mono-ortho PCBs
Column 1 (sat. phase, DB-5MS HT8 HT8 DB5-MS DB5-MS DB5 HT5 HT8 HT8 DB5-MS
length, ID, Film thickness) 60m x 0.25mm x 0.25µm
60m x 0.25mm x 0.20µm 50m x 0.22mm x 0.25µm 30m x 0.25mm x 0.25µm 60m x 0.25mm x 0.25µm 60m x 0.25mm x 0.10µm 25m x 0,22mm x 0,25µm 25m x 0.22mm x 0.25µm 60m x 0.25mm x 0.20µm 30m x 0.25mm x 0.25µm
run time 53 min 50 min 40 min 30 min 45 min 45 min 30 min 30 min 55 min 30 min
Detector HRMS HRMS HRMS HRMS HRMS HRMS LRMS HRMS HRMS HRMS
Di-ortho PCBs
Column 1 (sat. phase, Not measured HT8 HT8 DB5-MS DB5-MS DB5-MS HT5 HT8 HT8 DB5-MS
length, ID, Film thickness) 60m x 0.25mm x 0.20µm
50m x 0.22mm x 0.25µm 30m x 0.25mm x 0.25µm 60m x 0.25mm x 0.25µm 60m x 0.25mm x 0.20µm 25m x 0,22mm x 0,25µm 25m x 0.22mm x 0.25µm 60m x 0.25mm x 0.20µm 30m x 0.25mm x 0.25µm
4
Table 2: Overview of major statistical parameters
Congeners n Median mean RSD Outliers Dioxins (pg/L) (pg/L) (pg/L) (%) 2, 3, 7, 8 - TetraCDD 22 9,5 9,9 22 1 1, 2, 3, 7, 8 - PentaCDD 22 32,0 32,3 9 0 1, 2, 3, 4, 7, 8 - HexaCDD 22 17,3 17,2 21 1 1, 2, 3, 6, 7, 8 - HexaCDD 24 122,0 119,6 9 1 1, 2, 3, 7, 8, 9 - HexaCDD 22 17,4 18,5 22 1 1, 2, 3, 4, 6, 7, 8 - HeptaCDD 24 145,4 152,8 25 2 OctaCDD 24 1390,0 1635,4 61 4 Furans (pg/L) 2, 3, 7, 8 - TetraCDF 10 <5,0 <5,0 - - 1, 2, 3, 7, 8 - PentaCDF 7 <5,0 <5,0 - - 2, 3, 4, 7, 8 - PentaCDF 24 82,5 78,6 14 0 1, 2, 3, 4, 7, 8 - HexaCDF 22 24,0 23,2 14 1 1, 2, 3, 6, 7, 8 - HexaCDF 22 28,0 28,0 11 1 1, 2, 3, 7, 8, 9 - HexaCDF 2 <5,0 <5,0 - - 2, 3, 4, 6, 7, 8 - HexaCDF 18 7,9 9,8 57 1 1, 2, 3, 4, 6, 7, 8 - HeptaCDF 23 35,0 34,9 28 1, 2, 3, 4, 7, 8, 9 - HeptaCDF 3 <5,0 <5,0 - - OctaCDF 5 <40,0 <40,0 - - dioxin like PCBs (pg/L) PCB 77 (non-ortho) 16 186,1 171,1 48 0 PCB 81 (non-ortho) 7 <100,0 <100,0 - - PCB 126 (non-ortho) 22 247,9 249,4 14 3 PCB 169 (non-ortho) 24 334,0 349,7 19 1 PCB 105 (ortho) 26 11740,0 12131,1 10 2 PCB 114 (ortho) 20 3873,0 3982,9 16 1 PCB 118 (ortho) 26 74702,4 72948,0 13 1 PCB 123 (ortho) 19 830,0 776,9 26 2 PCB 156 (ortho) 26 56128,6 55926,7 9 2 PCB 157 (ortho) 26 10412,2 10600,6 8 2 PCB 167 (ortho) 26 16354,4 16706,4 9 1 PCB 189 (ortho) 26 8606,9 8604,0 12 2 Indicator PCBs (ng/L) PCB 28 16 11,1 11,48 50 0 PCB 52 16 7,9 7,7 63 0 PCB 101 19 5,7 5,9 60 1 PCB 138 25 290,7 289,5 17 3 PCB 153 25 507,0 511,3 10 2 PCB 180 24 443,7 447,4 7 3 PBDEs (ng/L) PBDE 28 10 <3,0 <3,0 - - PBDE 47 16 6,4 9,7 114 1 PBDE 99 16 2,5 3,4 84 2 PBDE 100 13 1,5 1,7 51 0 PBDE 153 16 6,3 6,0 22 0 PBDE 154 11 0,4 0,5 68 2 PBDE 183 14 1,6 1,7 40 1 PBDE 209 5 <100 <100 - - Total Lipids (g/L) gravimetric 15 4,6 4,6 13 0 enzymatic 18 5,4 5,6 6 2
out of the ten PCDFs. RSDs between 11% and 57%. No major difficulties were observed for dioxin-like PCBs (RSDs between 8% and 26%) except CB 77 and 81. The large RSD for CB 77 is due to the conjugated effect of its high ubiquity in procedural blank samples and its weak level in the human plasma. The same reasons can also explain the high variability observed for CB 28, 52, 101 (RSDs > 50%). Less data were reported for PBDEs and, compared with the results of chlorinated compounds, the RSDs for most of the PBDEs were higher. This indicates an immature QA/QC approach for the analysis of PBDEs in serum samples at background European levels.
Finally, Table 2 also shows the results of the lipid determination performed on the test material. Ten laboratories submitted results. These were evenly divided between gravimetric and enzymatic methods (both methods reported by laboratory 2). Enzymatic methods tend to yield higher results (median of 5,4 g/L compared to the median of 4,6 g/L). Dispersion of gravimetric methods is greater than for enzymatic (SD of 0,3 g/L compared 0,6 g/L). This is probably due to the fact that enzymatic methods are generally performed by automated systems using commercial kits whereas gravimetric methods are manual and more dependent on the skill of the operator. As scientific literature compares human exposure to these contaminants on a lipid weight basis in serum, the results presented here point out the necessity of standardizing lipid measurements.
References
1. Stephens R.D., Rappe C., Hayward D.G., Nygren M., Startin J., Esboll A., Carlé J., Yrjänhekki E.J., anal. chem.;1992; 64; 3109:3117