UNIVERSITÉ DU QUÉBEC
INRS- ÉNERGIE, MATÉRIAUX ET TÉLÉCOMMUNICATIONS
Measurement of the pulsatile ocular dynamics of the
human eye for glaucoma diagnosis
par Kanwarpal Singh
Thèse présentée pour l'obtention
du grade de Philosophire Doctor (Ph.D.) en Sciences de l'Énergie et des Matériaux
Président du jury Et examinateur interne Examinateur externe Directeur de recherche Codirecteur de recherche Jury d'évaluation
Dr. François Légaré, INRS-EMT Dr. Caroline Boudoux
(École Polytechnique de Montréal) Dr. Pierre Blondeau
(Université de Sherbrooke) Dr. Tsuneyuki Ozaki, INRS-EMT Dr. Mark Lesk,
(Université de Montréal) Dr. Santiago Costantino (Université de Montréal)
Abstract
The objective ofthis thesis work is to design a non-invasive diagnostic instrument to study the biomechanical properties of the eye and test the potential of this instrument for the early diagnosis of glaucoma.
G1aucoma is an eye disease in which the vision loss is permanent. The present diagnostic methods are unable to detect glaucoma in its initial stages. It commonly takes several years following the onset of the disease in order to identify people with glaucoma. A new diagnostic instrument that could detect glaucoma at its onset is highly desirable. Tt has been shown in numerous studies that pulsatile ocular blood flow plays a major raIe in glaucoma. The ocular blood flow drives the mechanical pulsations of the eye. As both ocular blood flow and ocular biomechanics are altered in glaucoma, it can be assumed that the mechanical pulsations driven by ocular blood flow would also be altered. A device capable of measuring such pulsations could potentially be used as a new diagnostic tool for glaucoma.
In previous works, the pulsatility of the eye has been measured using tonometer-based technologies, which measure the variations in the intra ocular pressure at the cornea. These instruments do not measure mechanical displacement of ocular tissues. Furthermore, most of the tonometer-based technologies have to make contact with the eye in order to perform such measurements. As contact techniques are not preferred for the reasons such as infection and damage to the eye, technologies that require no contact with the eye were sought. Technologies such as ultrasonic transducers, laser interferometry and low-coherence interferometry have been used to measure one or the other aspect of the ocular pulsations. Ultrasonic transducers were shown to measure the corneal axial displacements, but could not be applied to measure the pulsations of the interior ocular tissues, such as the retina. In glaucoma it could be more interesting to measure the pulsatility of the retina rather than that of the cornea. Therefore
technologies such as laser interferometry and low coherence interferometry have been applied by sorne research groups.
In this thesis work, a device based on Fourier-domain low-coherence interferometry was developed. The device was first tested on live animais, such as rabbits and rats, and then further tested on human subjects recruited at the Research Center of the Hospital Maisonneuve-Rosemont. The developed device cou Id measure simultaneously the pulsations of the comea and the retina. In the later part of the thesis work, a comparative study between glaucoma and non-glaucoma subject was performed.
The results obtained suggest that the pulsations of the ocular tissues, such as the comea and the retina, are larger in patients with glaucoma compared to normal subjects. The developed device provides for the first time an opportunity to study the pulsations of the comea and the retina simultaneously and at video rate, with a displacement resolution as small as 400 nm. This allows the researchers and the clinicians to measure the biomechanical properties of the eye and study their role in glaucoma.
Student (Kanwarpal Singh) Research Supervisor
(Dr. Tsuneyuki Ozaki)
Co-supervisor
(Dr. Santiago Costantino)
Co-supervisor (Dr. Mark Lesk)
Acknowledgement
This is an opportunity that 1 would not like to miss to thank all the people who have helped me during my thesis work. This work is a result of the collaboration between the INRS, MPB technologies and the Research Center of the Hospital Maisonneuve-Rosemont (HMR).
1 would like to thank MPB technologies, which provided a heterodyne interferometer to test its potential in measuring the ocular dynamics. 1 am also thankful to the INRS, Fonds de recherche du Québec - Nature et technologies, Ministère de l'Éducation, du Loisir et du Sport and Fonds de la recherche en santé du Québec which at sorne point of my PhD studies, supported me financially. 1 am highly obliged to the Research Center of the HMR, for providing its facilities to carry out my work. Marie-Josée and Julie at the animal research facility of the HMR were of great help during the animal experiments. The work with hum an subjects could not have been completed without the help of Dr. Denis Descovich, atHMR.
During the course of this work, Dr. Carolyne Dion (postdoctoral fellow) and Dr. Marcelo Wajszilber (Research associate) in our group, were constant helping hands and leaming sources. They gave their expert input, from the start until the end ofmy PhD.
1 would like to mention the support of my wife Gargi, who dared to be the first human subject, trusting me that the device is safe for her eyes. Whenever 1 had to test the developed system, she would happily volunteer to be a subject.
1 am thankful to Dr. Leopold Schmetterer and his laboratory for extending their fullest support during my visit to Medical University of Vien na as a visiting student. Dr Schmetterer opened up ail his facilities and expertise for me to leam. My co-supervisor, Dr. Santiago Costantino has been a major source of inspiration for me. He was al ways a good critic and a source of improvisation in this work. My PhD would have never taken its present shape without him. Dr. Mark Lesk,
my 2nd co-supervisor is another person who has played a major role in the completion of this thesis work. He was always available for his expert guidance related to the medical aspects of the work. 1 am thankful to him for arranging the patients and the facilities used during this study.
Finally, 1 am thankful to Dr. Tsuneyuki Ozaki, my PhD supervisor who showed confidence in me by accepting as his student. He put lots of efforts in arranging the financial support and the collaborations for this project. His suggestions have guided me throughout my PhD work.
Table of figures
Figure 1. Basic ray diagram for image formation in the human eye ... 3
Figure 2. Comeallayers of the human eye ... 4
Figure 3. Flow ofaqueous humor in the human eye ... 6
Figure 4. Accommodation of the ocular lens ... 8
Figure 5. Schematic of the retina ... 10
Figure 6. Sketch of the posterior eye ... 12
Figure 7. Primary open angle glaucoma showing ... 14
Figure 8. Closed angle glaucoma ... 15
Figure 9. Posterior eye structure showing the lamina cribrosa ... 21
Figure 10. Blood supply to the optic nerve head ... 23
Figure 11. Schematic of the Ultrasound Transducer system ... 28
Figure 12. Axial movemet of the cornea ... 29
Figure 13. Schematic of the homodyne Michelson interferometer. ... 31
Figure 14. Modified homodyne interferometry ... 32
Figure 15. Fundus pulsations measured with ... 33
Figure 16. Layout of the heterodyne interferometer ... 35
Figure 17. Oemodulation technique ... 37
Figure 18. Movement of the comea and ... 39
Figure 19. Ocu lar fundus pulsations measured ... 40
Figure 20. Schematic of the Fourier (Spectral) domain ... 44
Figure 21. Schematic of the designed system ... 47
Figure 22. System calibration curve ... 50
Figure 23. Axial scan of a broadband mirror used as sample ... 51
Figure 24. Small movements measured with FO-LCI system ... 53
Figure 25. Axial scan (A-Scan) of the rat ... 55
Figure 26. Recorded axial movement ... 56
Figure 27. Filtered movement ofretina and cornea ... 57
Figure 28. Schematic of the optical system developed ... 62
Figure 30. (TOP) The axial displacement of the retina ... 67
Figure 31. (TOP) Fundus pulse amplitude and oximeter. ... 68
Figure 32. Phase difference of the movement.. ... 69
Figure 33. The movement of each ocular element.. ... 70
Figure 34. (A) Root mean square (RMS) values of the comea ... 71
Figure 35. The movement of the comea and the retina ... 72
Figure 36. Phase delay between the comea and the retina ... 73
Figure 37. Different measurement points in the B-scan ... 74
Figure 38. The axial movement of the different ocular elements ... 75
Figure 39. The root mean square (RMS) values of the axial movement ... 76
Figure 40. Local stretching of the ocular tissue ... 77
Figure 41. Root mean square (RMS) value of the tissue stretching ... 78
Table of Contents
Abstract ... i i
Acknowledgement ... iv
Table of figures ... vi
Chapter 1 Hypothesis and objectives ... 1
1.1 Introduction ... 1
1.2 Anatomy of the human eye ... 2
1.2.1 Cornea ... 3 1.2.2 Anterior Chamber ... 6 1.2.3 Iris ... 7 1.2.4 Ocular lens ... 7 1.2.5 Retina ... 9 1.3 Glaucoma ... 12 1.3.1 Types ofGlaucoma ... 13 1.3.2 Diagnosis ofGlaucoma ... 16 1.3.2.1 JOP measurement. ... 16
1.3.2.2 Optic nerve head anatomy ... 18
1.3.2.3 Haemodynamic ... 19
1.3.2.4 Perimetry ... 20
1.4 The Role of the biomechanical properties of the eye in glaucoma ... 21
Chapter 2 Techniques to measure the ocular distances ... 27 2.1 Introduction ... 27 2.2 Ultrasound transducers ... 27 2.3 Laser Interferometry ... 30 2.3.1 Homodyne Interferometry ... 31 2.3.2 Heterodyne Interferometry ... 34
2.4 Low-coherence interferometry (LeI) ... 40
Chapter 3 Spectral domain low coherence interferometry ... 42
3.1 Introduction ... 42 3.2 Theoretical background ... 43 3.3 Experimental Details ... 46 3.3.1 System design ... 46 3.3.2 System characterization ... 49 3.3.2.1 System calibration ... 49 3.3.2.2 Axial resolution ... 50 3.3.2.3 Depth Range ... 51
3.3.2.4 Resolution and accuracy in displacement measurement.. ... 52
3.3.3 Animal manipulations ... 54
3.4 Results ... 54
Chapter 4 Axial movements of the eye for human subjects ...... 59
4.1 Axial eye movements ... 59
4.2 Experimental design ... 61
4.4 System performance ... 65
4.5 Results ... 66
4.5.1 Testing of the system on the normal subjects ... 66
4.5.2 Glaucoma verses non glaucoma subjects ... 73
Chapter 5 Conclusion and discussion ... 81
5.1 Initial results on the rat eye ... 83
5.2 Results on the Human eye ... 84
5.3 Limitations ... 88
5.4 Conclusion ... 88
References ... 90
Appendix A Box plot ... 98
Appendix B Résumé en Français ... 100
1. Introduction ... 100
II. Anatomie de l'oeil humain ... 101
III. Glaucome ... 102
IV. Le rôle des propriétés biomécaniques de l'œil dans le cas de glaucome ... 104
V. Objectif ... 107
VI. Contexte théorique ... 107
VII. Conception expérimentale ... 110
VIII. Traitelnent des données ... 111
Chapter 1
Hypothesis and objectives
1.1 Introduction
Glaucoma is the second largest cause of blindness after cataract, which is more prevalent in the older population. In Canada, more than 400,000 cases of glaucoma were reported by the year 2002, and this number is expected to increase in the coming years [1]. According to a recent study [2] there will be about 80 million people worldwide suffering from glaucoma.
In glaucoma, the optic nerve, which is responsible for carrying the vision from the eye ta the brain, suffers permanent and irreversible damage. This damage can be observed as an increase in the central excavation of the optic disc, normally termed as eupping of the optie dise. Optie dise is the area at the baek of the eye from where blood vessels enter and axons earrying the vision information leave the eye. One of the major difficulties with this disease is that most people who have glaueoma do not notice any symptoms until they begin to lose substantial segments of their visual field. From a c1inieal point of view, without years of
monitoring it is impossible to identify people with glaucoma who are in the initial stage of the disease. If glaucoma can be detected in the initial stages of its progression, then although the damage that has already been done cannot be reversed, its progression can be either stopped or slowed down. A good diagnosis method would allow clinicians to distinguish people whose eyesight is deteriorating faster from those with a more benign course. Consequently, more aggressive therapy and available treatments can be adopted for high-risk glaucoma patients, which in sorne cases can stabilize the progression of the diseases.
Tt was estimated [3] that the Canadian health system spent about 300 million Canadian dollars per year in direct cost related to glaucoma between 1990 and 2000. Oriven by the country's aging population, incidences of glaucoma are soaring as baby boomers reach 50 and 60 years old. Therefore, a cost-effective method for the early detection of glaucoma would significantly help in reducing the cost needed for its treatment.
1.2 Anatomy of the human eye
Before going into the details of glaucoma, it is necessary to understand the basics of image formation and eye anatomy.
The eye is one of the most important organs of the human body, as we perceive the visual world with our eyes. The basic procedure of vision formation is outlined in Figure 1. When light falls on an object, it is scattered and reflected in aIl directions. Sorne of this light reaches the eye, where it encounters the first ocular element, which is the cornea. These Iight rays are refracted wh en they pass through the cornea, resulting from the comeal curvature as weIl as the difference in the refractive index between the cornea and air. These refracted rays are further refracted by the ocular lens to form an inverted image of the object on the retina, which is the tissue of the eye that senses light. The light received by the retina is
converted into the electrical signais by the cells present in the retina. These signais from the retina are then transferred to the brain via the optic nerve where they are interpreted as an image.
Aqueous
Image formed
Figure 1. Basic ray diagram for image formation in the human eye. Image source: http://www.improve-vision-naturally.com
This is an extremely simplified version of image formation, but the actual procedure is highly complex. The function and structure of sorne of the common ocular elements is discussed further in more detail.
1.2.1 Cornea
Cornea is a transparent ocular tissue whose thickness varies between 450 to 650 flm. It is nearly spherical in shape with a radius of curvature of about 8 mm. Cornea absorbs Iight with wavelengths below 300 nm. Cornea is composed of different layers such as corneal epithelium, Bowman's layer, corneal stroma, Descemet's membrane and corneal endothelium.
The first layer of the comea, the comeal epithelium is about 50 !lm thick. The outer surface of the comeal epithelium is very smooth and secrete glycocalyx component that adjoins the tear film. The smooth surface of the comeal epithelium and presence of the tear film reduces the aberrations in the image formation that could have occurred due to the irregularities in the comea surface. Under the comeal epithelium is the Bowman's layer, whose thickness varies from 8 to 14 !lm in adult humans. Bowman's layer is made up of dense fibrous collagen, which makes it a relatively strong layer and resistant to the shearing, penetration and infection. It also helps the comea in maintaining its shape.
Air Corneal Epithelium Bowman's layer Corneal Stroma Descemet's membrane Corneal endothelium I\nterior Chamber
The third layer of the cornea is the corneal stroma, which is also the thickest layer (approximately 500 )lm) of the cornea. Corneal stroma is made up ofplane sheets of collagen fibers called lamellae. About 200 to 300 lamellae are arranged parallel to each other to form the corneal stroma. The collagen fibers in each lamella are parallel to each other but at an angle in to the collagen fibers in the adjacent lamellae. This arrangement of the collagen fibers in the stroma helps to reduce the scattering of the light in the cornea.
Stroma is followed by Descemet's membrane, which is basically a basement membrane on which the endothelium cells grow. Its thickness can vary from 5 )lm in children to approximately 15 )lm in adults. The last layer of the cornea is corneal endothelium, which is about 5 )lm thick. Corneal endothelium is a single cell layer. It is responsible for intake of the nutrients from the aqueous humor to nourish the comea. It also regulates the hydration level of the cornea by removing the excessi ve water.
Cornea gives the eye its highest refractive or focusing power [4]. The total focusing power of the eye is about 60 to 65 diopters, out of which, corne al focusing power accounts for about 43 to 48 diopter. Light from the object received by the eye is refracted because of the corneal curvature and the difference in the refractive index of the tear film at the cornea and ifs surrounding. The first refraction of the light occurs at the interface between the comea and the air, which have a refractive index (n) of approximately 1.376 and 1.000, respectively. The second refraction of the light occurs at the interface between the comea and aqueous humor (n=1.336). Besides acting as a focusing element, the comea also serves as a filter for ultraviolet radiation.
1.2.2 Anterior Cham ber
Schlemm's Canal
L
ens
Figure 3. Flow of aqueous humor in the human eye. Image source: http://nenaaragon.hubpages.com/hub/Open-Angle-Glaucoma
Anterior
chamber
Below the cornea is the anterior chamber, a space between the corneal endothelium and the iris. The depth of the anterior chamber is approximately 3.1 mm in an adult human [5]. ft is filled with a transparent liquid called aqueous humor. In order to maintain the shape of the eye, it is necessary that the pressure of the liquid inside the eye is more than the atmospheric pressure. The pressure inside the eye is maintained by the regulation of the aqueous humor, which is produced by the ciliary body. The flow of aqueous humor in the eye is depicted in Figure 3 by the red arrow. After being produced by the ciliary body, the aqueous humor flows between the iris and the ocular lens. ft enters the anterior chamber through the opening of the iris called the pupi\. Then, it leaves the anterior chamber through the trabecular meshwork into the Schlemm's canal.
1.2.3 Iris
After passing through the anterior cham ber, light encounters the pupil, an opening in the iris that acts like a diaphragm for the light. The pupil controls the amount of light that enters the eye by changing its size. The size of the pupil in an adult human can change from 2 mm to 8 mm in diameter, depending on the condition of the light. In the presence of bright light, the size of the pupil reduces, whereas in dim light it increases, to allow more light to enter the eyes. The size of the pupil is controlled by the dilator and the sphincter muscle of the iris. We get the color of our eyes from the pigment present in the iris. This pigment is called melanin, which is produced by melanocytes, the melanin producing cells. The amount of melanin and its location in the iris defines the color of the eyes. For example, people with brown eyes have more melanin in their iris than the people with blue eyes.
1.2.4 Ocular lens
Below the iris is the ocular lens or the crystalline lens, which is an elastic structure with an oval shape. The ocular lens is attached to the ciliary body through zonule fibers. The anterior surface of the ocular lens has a radius of curvature of approximately 8 mm to 14 mm, whereas that for the posterior surface is approximately 5 mm to 8 mm. The central thickness of the ocular lens varies from 3.5 mm to 5 mm. ln adults, the diameter of the ocular lens is approximately 9mm.
The refractive index of the ocular lens has a gradient due to the change in the optical density from the surface to the center. The concentration of the proteins brings this change in the optical density, which increases from the surface to the center of the ocular lens. This variation in the refractive index gives additional refractive power to the ocular lens, besides the refractive power it gets from its shape.
Cornea
Ciliary Muscle
Zonule Fibers
~-~
Ocular Lens
Iris
Fa r focussed
Near focussed
Figure 4. Accommodation of the ocular lens. Image source: http://healthy-ojas.comleye/presbyopia.html
The ocular lens can take different shapes depending on the different focusing situations. The process of fine adjustment in the focusing properties of the ocular lens is termed as accommodation. If the ocular lens was left to take its own shape, then it would have close to a spherical shape. However, in order to focus the image of the object on to the retina, which is the light sensing tissue, the lens shape can be modified by regulating the tension on the zonule fibers through ciliary muscles. Under nonnal conditions, the zonule fibers are stretched, giving the lens a di sc like structure to focus on the distant object. To focus on closer
objects, the ciliary muscle cornes into action, which contracts to loosen the zonule fibers giving the lens its spherical shape (Figure 4).
The ocular lens absorbs the near ultra violet (NUV) wavelengths between 300 nm and 400 nm, and transmits the visible light spectrum. The absorption of NUV radiations by the ocular lens can cause damage to the lens proteins, increasing its opacity. NUV absorption can also lead to accumulation of yellow pigment in the center of the lens.
1.2.5 Retina
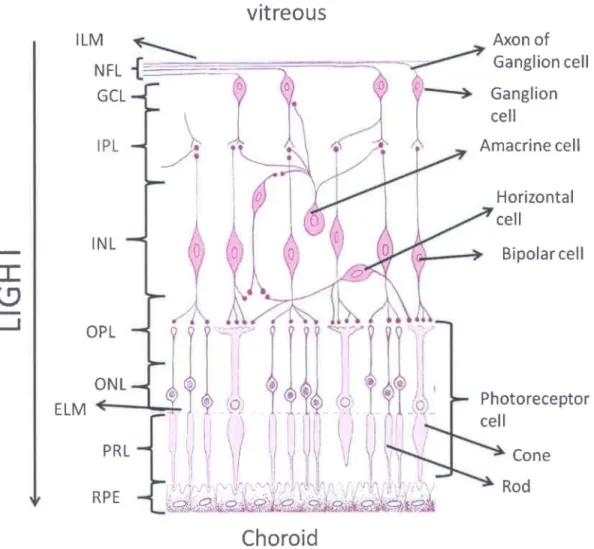
Light after being refracted by the ocular lens is focused on the retina. It is a very thin layer responsible for sensing the light. It is situated at the back of the eye between the choroid and the aqueous vitreous. Retina consists of different cell types that are arranged in a laminar structure inside the retina (Figure 5). The basic cell types found in the retina are photoreceptor cells, bipolar cells, horizontal cells, amacrine cells, muller cells and ganglion cells.
Photoreceptor cells are the light sensing cells in the retina. To reach the photoreceptors, light has to penetrate thraugh the complete retinal thickness. This light is absorbed by the pigment in the photoreceptor cells. In a human eye, there are two types of photoreceptors; cones and rods, which derive their name due to their appearance. Cones are responsible for the color vision of the eye. A cone can have one of the three types of pigments, which are responsible for absorbing green, red or blue color of the visible light. AIthough the absorption spectra of the three different types of pigments found in cones overlap with each other, the maximum sensitivity for each color is different. The three types of cones have their maximum sensitivity at 420 nm (blue), 531 nm (green) and 588 nm (red). The rods have absorption spectral centered at 498 nm, which spreads over the whole visible range. This makes the rads insensitive to colors. Rods are particularly useful in low light vision.
ILM NFL IPL OPL
HM
RPEvitreous
Choroid
Ganglion cell Amacrine cell Bipolar cell Photoreceptor cell ConeFigure 5. Schematic of the retina. Different layers of the retina are inner Iimiting membrane (ILM), nerve fiber layer (NFL), ganglion celllayer (GeL), inner plexiform layer (IPL), inner nuclear layer (INL), outer plexiform layer (OPL), outer nuclear layer (ONL), photo receptor
layer (PRL) and retinal pigment epithelium (RPE). Image source: Reference [61
The complete signal processing inside the retina is a highly complex phenomenon and only its basics are discussed further. The signal generated by the photoreceptor cells is regulated by the inflow and the outflow of sodium ions. In the absence of the light, there is a constant inflow of the sodium ions into the photoreceptor cells through ion channels. The ion channels are the
protein-assisted openings in the cell membrane that act as gates. These ion channels can be opened or closed through electrical or chemical stimulus. When the light photons are absorbed by the pigment in the photoreceptor cells, it initiates a chemical reaction that closes the ion channel, blocking the inflow of the sodium ions. This reduces the membrane potential of the photoreceptor cells, which in tum lead to decrease in the release of the neurotransmitters at the photoreceptor and bipolar cell junction.
The neurotransmitters released by the photoreceptor cell and received by bipolar cell can be inhibitory or exciter in action. When they are inhibitory, the reduction in the neurotransmitters released by the photoreceptor cell leads to an increase in the membrane potential of the bipolar cell. Due to increase in the bipolar cell membrane potential, neurotransmitters released at the bipolar cell and ganglion cell junction are increased.
The increased neurotransmitters that are received by the ganglion cells initiate an action potential in the axons of the ganglion cell. Action potential in a ganglion cell is a burst of voltage signal with maximum amplitude of approximately 40 m V that propagates along its axon. These bursts of voltage signais that leave the eye through the axons of the ganglion cells constitute the vision signais. There are sorne intermediate cells, such as horizontal and amacrine cells between the ganglion cells and photoreceptor cells, which help in the additional processing of the visual signais.
The axons of the ganglion cells carrying the vision signal leave the eye from a special opening called the optic dise. The bundle of the axons of the ganglion cells form the optic nerve, which carries the vision signal to the lateral geniculate nucleus of the brain. Optic nerve is considered a part of the central nervous system and an extension of the brain. After leaving the eye, the optic nerves from the two eyes meet at optic chiasm. It is the place where the axons from the nasal side of the two eyes cross over to the other side. The axons from the temporal side of one eye and the nasal side of the other eye form the optic tract which travel to
the visual cortex. Visual cortex is the place inside the brain where the electrical signaIs from the eye are interpreted as an image.
1.3 Glaucoma
Axons of Ganglion eclls Ganglion cells
Choroid
Axons of Ganglion eells
~OPticnerve
Figure 6. Sketch of the posterior eye.
In glaucoma, the axons of the ganglion cells are damaged which appears as loss of NFL, thus inhibiting the vision signaIs to reach the brain and this kind of damage to the axons is irreversible. There are various risk factors that have been identified which might lead to glaucoma and out of these risk factors, increased intra ocular pressure (lOP) is the most widely accepted risk factor for glaucoma.
IOP is the pressure of the aqueous humor that fills the space between the comea and the ocular lens. It is about 15 mmHg in the normal eye. A pressure higher th an 21 mmHg is considered a significant risk factor that might lead to Glaucoma. Aqueous hum or produced by the ciliary body enters the anterior chamber through
the pupil. This liquid then leaves the anterior cham ber through the trabecular meshwork, which is a part of the eye's circulation system. Sometimes the pathways through which aqueous humor leaves the anterior chamber are blocked. Under these conditions the inflow of the aqueous humor is outbalanced by the outflow leading to increased pressure of the aqueous humor or the increased IOP. Although the pathophysiology of glaucoma is not fully understood, it is believed that the increased IOP exerts a force on the back of the eye. This force leads to damage of the axons of the ganglion cells, which destroys them over a period of time. Based on the anatomy and causes, glaucoma has been divided into sub categories. Sorne ofthese categories are listed in the next section.
1.3.1 Types of Glaucoma
Broadly, glaucoma can be categorized as primary open angle glaucoma (POAG), c10sed angle glaucoma (CAG), normal tension glaucoma (NTG), congenital glaucoma and secondary glaucoma.
Out of the above listed glaucoma categories, POAG [7] is the most common type of glaucoma. About 90 % of the glaucoma cases found in western countries belong to this category [2]. In POAG, the IOP increases over time with age. This kind of glaucoma is difficult to notice as the pressure increases over a long period of time and the vision loss initially occurs at the periphery of the retina. This vision loss is not noticed by the patients until they have already lost a substantial part of their vision. POAG derives its name from the fact that in this kind of glaucoma, the angle between the cornea and the iris is as wide as normal people. The exact cause of PO AG is unknown, but it is believed to be related ta the blockage of the aqueous humor drainage system, as shawn in Figure 7. This can be caused by the improper functioning of the trabecular meshwork. In such cases, the aqueous hum or, which is produced continuously, is not removed from the anterior chamber, leading to an increase in its pressure. Most therapies for POAG aim at reducing the IOP. These therapies cannot reverse the damage already done, but can slow down the progression. The IOP can be reduced through medication
or by laser trabeculoplasty. ln laser trabeculoplasty, small burns are made in trabecular meshwork which increases the flow of the aqueous humor, thereby reducing IOP. People at greater risk of POAG inc\ude those with IOP larger than 21 mmHg, older than 40 years, family history of glaucoma.
Blockage
...•...•..•...
".-'.
,~'•...••...•..•.
.,~,
.-
., )"
..
,~
",-..
. . - ,
. ),
'.
-,
.•..•..••...•.
.-
"
..••...•.•.••
~ Aqueous humor flowFigure 7. Primary open angle glaucoma showing the flow of aqueous humor which is blocked at the entry of the trabecular meshwork. Modified from Damjanov, 1996.
In CAG, the pressure of the eye increases suddenly over a relatively short period oftime. The IOP increase can occur within few days or few weeks. Since the IOP increase is sudden, the symptoms of CAG are easily noticeable. This kind of glaucoma can have symptoms such as pain in the eye, headaches, halos around lights, dilated pupils, red eyes, nausea and vomiting. ln CAG, the iris is pushed towards the cornea where it touches the trabecular meshwork. Due to the shifting of the iris, the angle between the cornea and the iris is reduced which gives it the name closed angle glaucoma. The contact between the iris and the trabecular meshwork blocks the drainage of the aqueous humor, leading to increased JOP. If the JOP is not reduced within few hours of its sudden increase, it may lead to a
permanent vision loss. The therapies adopted in CAG are usually similar to POAG and aim at reducing the JOP, but unlike POAG, theses therapies need to be more aggressive such as laser iridotomy in which a hole is drilled into the iris using a high power laser to allow for passage of aqueous humor.
Tr<lbecular
meshwork
Blockage
Aqueous humor
flow
Figure 8. Closed angle glaucoma in which the iris is pushed against cornea, thereby blocking the drainage path of the aqueous humor. Modified from Damjanov, 1996.
Normal tension glaucoma is a special case of PO AG where the JOP is statistically normal but still there is damage to the optic nerve. In patients with NTG, the JOP ranges between 10 mmHg to 21 mmHg, which is the normal range for lOP but still the eyes develop glaucoma. This damage can be seen as increased optic disk cupping and loss of nerve fiber layer. The cause ofNTG is not yet understood, but recent studies suggest that it is related to irregularities in the ocular blood flow
[8-10]. It is found that in NTG the blood suppl y to the optic nerve head is reduced, which might lead to ischemia, a situation where the oxygen suppJy to cells is reduced which leads to cell death. AJthough a Jess common case of glaucoma in
populations of European descent, NTG is dominant in Japanese populations and in Korea.
Congenital glaucoma is found in babies whose aqueous humor drainage system (trabecular meshwork) is not developed properly. This is usually characterized by large eye size and unclear hazy comea. Although very rare, it can have serious affects on the child's vision. If detected in the early stage, congenital glaucoma can be treated to avoid complete vision loss.
There is another class of glaucoma called secondary glaucoma, in which the rise in IOP can be due to secondary reasons. For example it can be caused by reasons such as recent eye in jury, medication, infection in the eye, diabetes or some other reason. Pigmentary glaucoma is one such kind of glaucoma in which pigmented granules released by the iris gets mixed with the aqueous hum or. When these pigmented granules reach the trabecular meshwork, it causes a clog, preventing the outflow of the aqueous thus increasing the IOP. Phacomorphic glaucoma is another kind of secondary glaucoma in which the swelling of the ocular lens pushes the iris towards the anterior chamber, thereby closing the angle between the iris and the comea leading to blockage of aqueous humor outflow.
For ail types of glaucoma listed ab ove, there is no single factor that can account for a particular type. There are several tests that need to be performed for detecting glaucoma. In the next section, some of the diagnostic techniques for glaucoma are discussed.
1.3.2 Diagnosis of Glaucoma
1.3.2.1 IOP measurement
Early glaucoma diagnosis is still a challenge for clinicians as there are no clearly defined indicators for early glaucoma. It is estimated that only half of the people who have glaucoma actually know that they have it since they do not notice the symptoms in early stage.
With CUITent ongoing research, new possible risk factors for glaucoma are being identified. As a marker for glaucoma, earlier studies relied on increased intra ocular pressure, a condition called ocular hypertension. An IOP of greater than 21 mmHg is considered a significant risk factor for glaucoma [11]. Defining glaucoma with '21 mmHg' as a marker has sorne problems, as in NTG, the IOP is lower than 21 mm Hg. Nevertheless, increased JOP still remains the most important risk factor for glaucoma.
JOP is measured by clinicians using a technique called tonometry. A tonometer is an instrument that measures the pressure of the liquid inside the eye. There are different variants of tonometers and can be classified as contact and non-contact tonometers.
In contact tonometry, like the Goldman tonometry, [12] which is considered as a gold standard for IOP measurement, the head of the tonometer is placed against the cornea to applanate or flatten certain are a of the cornea. The IOP of the eye is measured from the pressure required to flatten the comea. Measurements of JOP using these kinds of tonometers suffer from one drawback: the measured JOP is biased by comeal biomechanical properties including thickness. For example, the fOP of an eye with thin corne a would be underestimated, where as for thick cornea it would be overestimated [13, 14]. To circumvent this problem, a new technique called dynamic contour tonometry (OCT) [15] was introduced. In DCT, the head of the tonometer is a spherically concave shaped tip with radius of curvature of about 10 mm. At the center of the tip of the tonometer, a pressure sensor with area about 0.25 mm2 is placed. The tonometer tip is placed on the comea and a constant force is applied to the tip. This forces the comeal surface to touch and take the shape of the tonometer tip. Theoretically, when the contour or shape of the tip matches the shape of the comea, the pressure on both sides of the cornea has to be equal. Thus the pressure at the pressure sensor of the tonometer tip gives an estimate of the JOP that is assumed to be less dependent on the corneal thickness and its rigidity [16J.
In non-contact tonometry, air puffs combined with an optical system are used to measure the fOP. The optical system is made up of a light source and a detector. The air puff is used to flatten the corne a, which reflects the light from the light source. The detector receives the maximum light from the cornea when it is completely flattened. The pressure of the air required to flatten the cornea is used to calculate the IOP. In such kind oftonometers, since there is no contact with the eye, there are less chances of infection. Non-contact tonometers have been successfully applied in clinic and compared with Goldman tonometers [17, 18]. There are sorne variants of non-contact tonometers, such as Langham's pneumotonograph [19] that can measure the fOP variations continuously over a period of time. In Langham's pneumotonograph, a constant flow of air is used instead of air puffs to applanate the cornea. The backpressure of the air is used to measure the IOP and its variations over time. The variations in the fOP are termed as ocular pulse and have been studied in relation to glaucoma. As the JOP and its derivatives are not conclusive markers for glaucoma, other diagnostics tests are performed in parallel to verify this disease.
1.3.2.2 Optic Derve head aDatomy
Structural changes to the optic nerve head (ONH) are important indicators of glaucoma. The damage to the ONH can be visualized directly by looking into the eye using an ophthalmoscope or sorne other imaging technique. Sorne of the techniques that are used to make photographs of the optic nerve head are optic dise photography [20], optical coherence tomography [21] and scanning laser ophthalmoscopy [22]. Wh en the axons of the ganglion cells leave the eye through the optic dise, they form a cup-like structure. Even normal people usually have sorne cupping of the optic dise, but in glaucoma the ratio of the diameter of the cup to the diameter of the dise increases. A cup-to-disc ratio of about 1/3 and below is considered normal. An eye with a cup-to-disc ratio larger than 1/3 is considered suspicious for glaucoma [23, 24]. Doctors observe the cup-to-disc ratio over a period of time in order to monitor the progression of glaucoma. Progressive increase of cup-to-disc ratio is almost always an indicator of
glaucoma. However if there is only one visit and the cup-to-disc ratio is intermediate, then it is often hard to know ifthere is glaucoma. But an increase of cup-to-disc compared to the previous visit is usually diagnostic of glaucoma. The results based on structural changes of the optic nerve head needs careful analysis, as increased cup-to-disc ratio is not always an indicator of glaucoma [25].
1.3.2.3 Haemodynamic
The study of the haemodynamics of the eye is another area of research that is currently being explored for diagnosis of glaucoma [26, 27]. The blood supply to the eye termed as ocular blood flow (OBF) is pulsatile in nature and thus also called pulsatile ocular blood flow (POBF). The blood supply to the eye is responsible for the supply of oxygen and nutrients to various ocular tissues. OBF is also responsible for maintaining the temperature of the back of the eye [28], which is required for the proper functioning of the eye. Irregularities in blood flow can be over-perfusion, a condition of supply of more blood than required, or under-perfusion, a condition of suppl y of less blood, which can lead to cell death. The exact mechanism of the ganglion cell death due to irregularities in the ocular blood flow is not well understood yet. Sorne studies have related the ganglion cell death to apoptosis [29, 30], but the factors that lead to apoptosis are still unclear. Apoptosis is the phenomena by which a cell destroys itself, which sometimes is also called programmed cell death.
The OBF has been estimated by measuring the ocular pulse amplitude (OPA) of the eye. OPA is the difference between the minimum and the maximum IOP measured over a period of time and can be measured with standard tonometers, such as dynamic contour tonometer [13] and Langham's pneumotonograph [17]. In sorne studies, OPA has been found to be lower in patients with primary open angle glaucoma (POAG) [31], where as in other studies no statistically significant difference was found [32] between the two groups. However, in case of patients with normal tension glaucoma, a consistently lower OPA is observed as compared to the normal people [32-34].
Estimation of POBF through measurement of the ocular pulse amplitude is a topic of debate. Since this technology measures only a dependent parameter of the OBF and not the actual blood flow, the results might be biased due to other ocular properties such as corneal thickness and its rigidity. In order to overcome this limitation, attempts have been made to measure directly the blood flow inside the eye. In this direction the velocity of the blood flow was measured in patients with normal tension glaucoma using color Doppler imaging and found to be lower th an normal subjects [35].
1.3.2.4 Perimetry
Perimetry [36] is another diagnostic technique for glaucoma. This is a conclusive diagnostic tool in glaucoma, as it directly measures the extent of the visual field and its light sensitivity in the patients. In a perimetry test the patient is asked to look at the center of a bowl shaped instrument that is illuminated at the center, and a light stimulus is moved to different locations in the visual field. The person is asked to press a button when he sees a light signal. To test the sensitivity of a particular location of the visual field, light stimulus of different intensities and different sizes is used. The input from the subject is recorded using a computer. This way a map of the visual field of the patient is generated. This is a common test, in the diagnosis of glaucoma and other ocular diseases. Specific patterns of visual field loss are diagnostic of glaucoma if they are corroborated by structural changes of the optic nerve head and retinal nerve fibre layer. The visual field is also used to monitor whether glaucoma has progressed in an individual.
As discussed above, a large portion of the studies has aimed at the measurement of the JOP or the blood flow in relation to glaucoma. The role of the biomechanical properties such as rigidity of the eye in glaucoma has not been investigated much. In the next section the role of biomechanical properties of the eye in glaucoma is discussed.
1.4 The Role of the biomechanical properties of the
eye in glaucoma
Axons of the ganglion cells make the inner layer of the retina, which is called the nerve fiber layer. The nerve fiber layer from different locations of the retina converges at the optic disc to form the optic nerve head. These axons then exit the eye by passing through a specialized disc of scIera known as the lamina cribrosa, which is shown in Figure 9.
Lamina cribrosa _ _ --....;:...-_ _ _
Oural sheath _ _ _ ....:.;..
Optic nerve _ _ _ _ _
_ Long posterior ciliary artery
l
Short posterior ciliary arteries Figure 9. Posterior eye structure showing the lamina cribrosa.The lamina cribrosa is a porous structure, which is part of the scIera that forms the outermost layer of the eye. The Lamina cribrosa is the site from where the axons leave the eye and the blood vessels enter the eye. These blood vessels are responsible for nourishing the optic nerve head and the retina. In glaucoma, the size of the optic disc cup increases and lamina cribrosa becomes more exposed at the base of the cup of the optic disc. Besides being a site for the exit of the axons and entry of the blood vessels, it also acts as a barrier between the intraocular forces su ch as IOP and extraocular tissues. Because of its porous structure, lamina
cribrosa has been viewed as a vulnerable site in glaucoma, but the role of the lamina cribrosa in glaucoma has been ambiguous.
Sorne studies suggest that in the initial stage of glaucoma the lamina cribrosa is less rigid, whereas in later or advanced stages of glaucoma it is more rigid. The rigidity of the lamina cribrosa has been studied, ex vivo in hum an [37] and
monkey [38] eyes. The long tenn changes in the lamina cribrosa have also been studies in vivo in human [39, 40] and monkey eyes [41]. Although it has been
postulated that a less rigid lamina cribrosa leads to development glaucoma, the exact mechanism between the progression of glaucoma and the rigidity of the lamina cribrosa is not known.
The rigidity of the lamina cribrosa can be estimated by studying its compliance with the intra ocular pressure [42]. For this, the change in the position of the lamina cribrosa with respect to the retinal surface is measured after changing the intra ocular pressure over a long period of time. The compliance of the lamina cribrosa can be studied using techniques like confocal scanning laser ophthalmoscopy (CSLO) [39]. Using CSLO, the height maps of the ocular area around the optic disc are generated. From the se maps, parameters such as cup depth and cup-to-disk ratio are estimated. The parameter that is measured in glaucoma using CSLO is the mean cup depth, which is the mean distance between the base of the optic disc and the retinal surface. Sorne studies suggest that lamina cribrosa moves towards the retina (anteriorly) reducing the cup depth after the lOP is reduced [42, 43]. Lamina cribrosa is said to be more compliant if the change in the cup depth is larger as compared to other eyes for the same change in IOP. In one of the study [42] it was found that lamina cribrosa was more compliant in high-risk glaucoma patients than in low-risk glaucoma patients, thereby suggesting that the rigidity of the lamina cribrosa is different in different group of people. Thus, techniques such as the CSLO, indirectly study the compliance of the lamina cribrosa, but it takes months to collect data for such kind of measurements since the IOP must be changed by glaucoma therapy such as medications, laser or surgery.
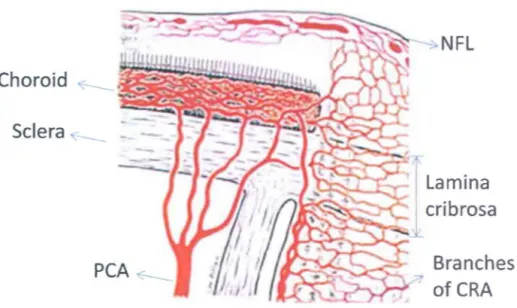
As was discussed previously, ocular blood flow plays an important role in glaucoma. This makes the lamina cribrosa an important actor in glaucoma, since the micro blood vessels that nourish the optic nerve head enter the eye from this location. The blood vessels while passing through the lamina cribrosa are organized in parallel planes, which are parallel to the wall of the eye. This structure is depicted in Figure 10.
Sciera
~__ _
... ~-... ...->"...-NFl
lamina
l
cribrosa
Branches
ofCRAFigure 10. Blood supply to the optic nerve head and the retina. Abbreviations are nerve fiber layer (NFL), central retinal artery (CRA) and posterior ciliary artery (PCA).
During systole of the cardiac cycle, the lamina cribrosa is pushed backward [44], which suggests that the micro blood vessels would feel compression due to such movement. In fact, in a study [42] it was observed that there was a slight improvement in the optic nerve he ad blood flow upon reduction of the IOP. In patients whose eyes are more compliant or their lamina cribrosa less rigid, the micro blood vessels would be subjected to more compression. Considering the
role of blood flow in glaucoma and the role of the lamina cribrosa in blood flow, it becomes evident that biomechanical properties such as the rigidity of the lamina cribrosa could contribute to the progression of glaucoma.
ln the above discussion, we have only considered the effect of long-term change of IOP on the displacement of the lamina cribrosa to estimate its biomechanical properties. From the previous work on the pulsatile ocular blood flow, it is known that the
rop
of the eye is not a constant quantity; rather it is also pulsatile in nature. These pulsations in the IOP are caused by the pulsatile ocular blood flow driven by rhythmic cardiac pulsations. The choroid is a layer that is sandwiched between the sciera (the outer layer of the eye) and the retina. The blood volume in si de the choroid is increased during systole, that is during the inflow of the blood. The choroid receives the highest amount of blood flow per gram of tissue in the human body. Due to the increased volume of the blood into the choroid, there is an expansion of the choroid that increases its thickness. During diastole, the blood leaves the eye reducing the blood volume in the choroid, which in turn brings the choroid back to its natural state. Thus, during systole and diastole the thickness of the choroid pulsates in synchrony with the cardiac cycle. During the expansion of the choroid, the retina being in front of it is also pu shed anteriorly. Since the eye is filled with an incompressible liquid called aqueous humor, the pushing of the retina causes a pressure wave to propagate from the retina surface to the cornea surface. This wave is detected as change in the IOP measurement at the cornea surface.This pulsating IOP, as measured with various tonometers, is found to be synchronous with the cardiac cycle. If a long-term change in IOP can displace the lamina cribrosa with reference to the retinal surface, then we cannot mIe out the effect of the pulsatile change of IOP on the lamina cribrosa. Considering this fact, it is hypothesized in this thesis work that "due to the pulsatile change in the lOP, the lamina cribrosa also pulsates synchronous with the cardiac cycle and these small dis placements in the lamina cribrosa are contributing to the progression of glaucoma."
Tt is not only the alteration in the blood flow due to the pulsatile movement of the lamina cribrosa that might be contributing to the progression of glaucoma but there could be other mechanisms as weIl. Since lamina cribrosa and the peripapillary retina are supplied with blood by different arteries, there might be a delay between the axial movements of the two tissue areas. ln this situation, there would be a pulsatile relative movement between the two tissues. Thus the axons of the ganglion cells being attached to the lamina cribrosa and the peripapillary retina would feel a pulsatile stretching over time due to such a relative movement. Hence, it is further hypothesized in this thesis work that "there is a relative movement between the lamina cribrosa and the peripapillary retina during the cardiac cycle which causes a stretching into the axons of the ganglion ceUs and such a slretching might be causing damage to them leading to glaucoma."
1.5 Objective
Although many studies have postulated the role ofbiomechanical properties of the eye and specifically of the lamina cribrosa in glaucoma, due to unavailability of c1inical techniques, these properties have been investigated only partially, mostly in cadaver eyes and animal models. Furthermore, it is only the long-term changes in the lamina cribrosa topography that have been measured in vivo. The small displacements in the lamina cribrosa that are caused by the pulsatile ocular blood flow still remain uninvestigated.
The pulsatile nature of the eye was described by Silver et al. [45] as a result of an imbalance between pulsatile blood inflow and steady blood outflow into the elastic eye. Each bolus of blood entering the eye causes an increase in the volume of the contents of the globe with a consequent rise in intraocular pressure, and then a decrease in volume and pressure during the outflow process. This pulsatility also drives the displacement of the various ocular tissues. The amplitude of the movement necessarily de pends on both the ocular
hemodynamics and on the eye's biomechanical properties. It is not yet known wh ether the pulsatile movements of the ocular tissues (such as the lamina cribrosa) could contribute to the pathophysiology of the glaucoma, but if they do, then their measurement could be used as an early diagnostic/prognostic test. Furthermore, as demonstrated by Hommer et al.[46], measurement of the pulsatile
movement of the eye can be used to estimate the ocular volume change, and th us the ocular rigidity from the Friedenwald equation [47], which may lead to insights on the pathophysiology of glaucoma.
As it is believed that increased IOP leads to glaucoma through compression of the lamina cribrosa, the small movements of the lamina cribrosa could also play a role, tirst, by altering the blood flow to the eye and secondly by contributing to the stretching of the axons. These small movements of the lamina cribrosa can potentially be more damaging, as these movements occur about 86,000 times per day.
ln order to measure the small movements of ocular tissues, such as lamina cribrosa, a new device is required. The objective of this thesis is 10 develop such a device and to lest its performance in human subjects as a potenlial glaucoma diagnostic tool. It is required from the device that it should be able to measure the movement of ocular tissues with an accuracy of approximately 1 f..lm. The device should also be able to precisely locate the position of the measurement so that movements of the different regions of the retina can be made. Above all, it will be highly desirable that this device is non-invasive.
Keeping these requirements in the mind, a non-invasive optical device based on Fourier-domain low-coherence interferometry was developed. The developed system is capable of measuring the movements of the cornea and the retina simultaneously, with an axial resolution of approximately 400 nm.
Further in this thesis, sorne of the previous works related to the measurement of ocular tissue movements, technique used in this thesis work and the results obtained are discussed.
Chapter 2
Techniques to measure the
ocular distances
2.1 Introduction
Various techniques for measuring pulsatile ocular movements have been reported in the literature. Application of techniques su ch as ultrasound transducers [48], laser and low-coherence interferometry [49-52] and spectral domain optical coherence tomography (SD-OCT) [53] have been demonstrated. The details of these techniques are discussed further briefly.
2.2 Ultrasound transducers
The use of ultrasound transducers for measuring the ocular tissue dynamics was first demonstrated by Zuckerman et al. [48] in 1977. Since then, ultrasound transducers have been used by various groups to study corneal dynamics [54-56].
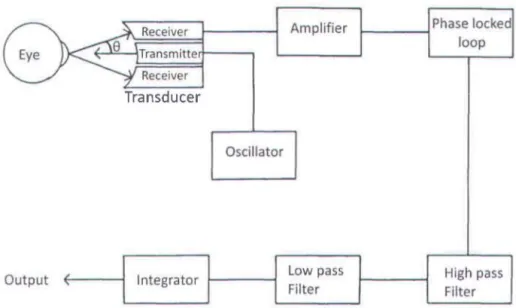
Ultrasound transducers use high frequency sound signais to detect axial movement of the cornea. A basic scheme of the ultrasound transducer technology to measure corneal displacement is shown in Figure Il.
Eye 8 Receiver Transmlttert----, Receiver Transducer Oscillator
Out putf--( - - - - i Integrator ~---f
Amplifier Low pass Filter Phase Iccked ~---l Iccp High pass Filter
Figure 11. Schematic of the Ultrasound Transducer system to measure corneal displacement.
The oscillator produces a high frequency voltage signal of frequencies ranging from 0.5 MHz to 1 MHz, which is fed to the transmitter of the transducer. The transmitter produces close to a collimated ultrasonic beam at the cornea. The signal produced by the transmitter is sinusoidal, with a temporal waveform of
A sin(2.7r ft) where A is the amplitude, fis the frequency and t is the time of the
signal. Due to axial displacement of the cornea, the ultrasonic beam retlected from the cornea is frequency modulated or Doppler-shifted. The Doppler-shifted signal is given by A sin(2.7r(f
±
I1f)t). The change in the frequency I1f or theI1f
=
f~cos(e),
wherefis the initial frequency of the signal, v is the velocity of cthe cornea, c is the speed of the sound in the media and () is the angle between the receiver and the transmitter. The Doppler shifted signal received by the receiver is then amplified using an amplifier. The signal from the amplifier is fed to a phase locked loop unit whose output is proportional to the Doppler shift. If the angle between the transmitter and the receiver is kept constant, then output of the phase locked loop unit is proportional to the velocity of the cornea. In order to obtain the displacement of the cornea, the signal is integrated using an electronic integrator.
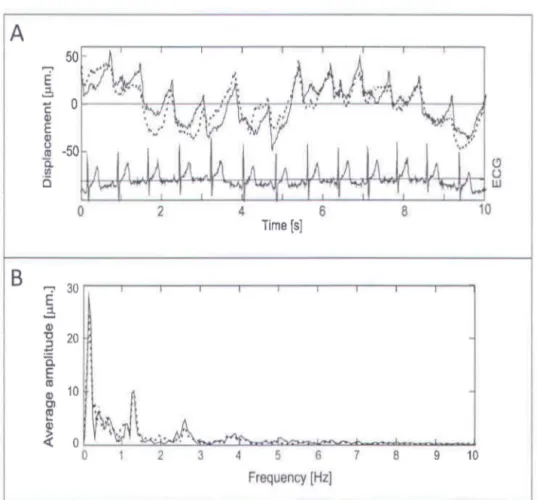
Figure 12. Axial movemet of the cornea (A) measured in both eyes simultaneously along with the electro cardiogram (ECG) signal. (B) Fourier spectrum of the recorded corneal
Using this technique, corneal displacements as small as 2 )..lm sampling at 100 Hz have been reported [54]. One such recording for the axial corneal displacement is shown in Figure 12. In this study, the axial displacement of the cornea in both eyes was simultaneously measured with two transducers. The cardiac signal was also recorded using electro cardiogram (ECG). The cardiac signal is represented by ECG signal in Figure 12(A). The Fourier spectrum of the recorded movement was calculated to investigate the frequencies present in these movements. The calculated Fourier spectrum is shown in Figure 12(B). It can be seen from the Fourier spectrum that the axial displacement of the cornea is composed of frequencies close 1.5 Hz and its harmonics which were attributed to the cardiac Although efficient in measuring the corneal displacement, this technique cannot measure the movements of inner ocular tissues, such as the ocular lens and the retina.
2.3 Laser Interferometry
The first ever experimental demonstration of light interferometry dates back to 1801 when Dr. Thomas Young established the wave nature of light through his famous double slit experiment. The light source used in those experiments was natural sunlight, which limited the applications of interferometry. After the first operational ruby laser (Light Amplification by Stimulated Emission of Radiation) in 1960, interferometry has found wide spread applications in material inspection, biological imaging and accurate measurement of very small (few picometers) to a fairly large (about 100 meter) displacement measurements. Light signais interfere due to their wave like nature. Light sources based on Laser have large spatial and temporal coherence.
Laser interferometry can be divided into two sub-categories, namely homodyne interferometry and heterodyne interferometry.
2.3.1 Homodyne Interferometry
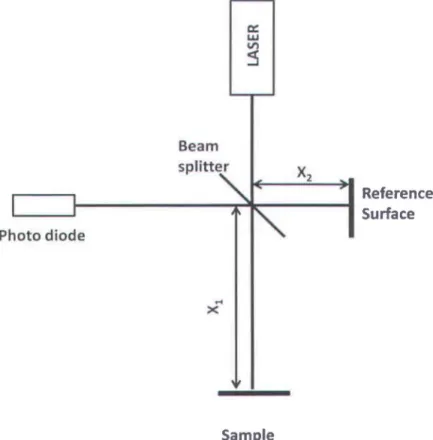
Homodyne interferometry uses only single frequencies from the laser and hence its name homodyne. The simple outline of a homodyne interferometry system is shown in Figure 13. The light from a laser source is divided into a reference and a sample heam using a heam splitter. The reflected signaIs from the reference surface and the sample surface interfere at the detector, which is normally a photodiode. 1
Ph
a: LIJ VI:5
BearnS
Plitt~
oto diode~
...
x SampleX
2 Reference SurfaceFigure 13. Schema tic of the homodyne Michelson interferometer.
The intensity IR(k) of the interference signal at the detector can he represented as
where IR(k) , Is(k) are the intensities reaching the detector from the reference surface and the sample surface, respectively, k is the wave number, d
=
Xl - X2 is the optical path difference (OPD) between the sample and the reference surface andBo
is a constant phase difference. If the OPD between the sample and the reference surface changes, then due to the presence of the cosine term in Eq. (2.1), the intensity at the detector varies accordingly. Thus the movement of the sample relative to a fixed reference surface can be measured by monitoring the intensity at the detector. The limitation of homodyne interferometric techniques is that they do not provide the direction of the movement, and the measured phase is intensity dependent. Any fluctuation in the source intensity is measured as phase change leading to error in the measurement.In sorne of the previous studies, [49, 52] modified homodyne interferometry was used to measure the ocular tissue movements. The scheme for such an interferometry is shown in Figure 14.
BEAM CORNEA
---~~~~----
---~
---J
~----
~
~
~
-
~~~~~~---)/ -
--
----
-
\CJ
/ EVE SENSOR LASERIn those studies, the eye was illuminated with a laser beam of high coherence length, which is retlected at the front surface of the cornea as weil as at the retina. The signal retlected from the cornea and received at the detector has a spherical wavefront (the beam is diverging) due to corneal curvature. On the other hand, the signal received by the detector after retlection from the retina has almost plane wavefront. The retlected signaIs from the cornea and the retina interfere with each other to produce an interference pattern with concentric bright and dark circles. This interference pattern is recorded over time to extract the relative movement between the cornea and the retina, i.e. the ocular pulsation or fundus pulsation
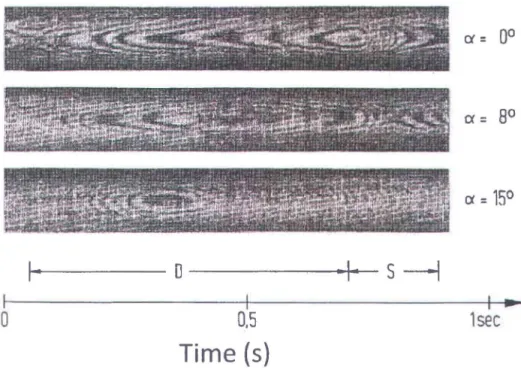
[52]. A recording ofsuch an interference pattern is shown in Figure 15.
Ci
=
00
ex
=8
0 1 ..D
-1-
s
--1
1 1 I ~0
0.5
lsec
Time
(5)
Figure 15. Fundus pulsations measured with modified homo dyne interferometry(52).
The fundus pulsations were measured at three different angles from the visual axis, at 0, 8 and 15 degrees. In Figure 15, data acquired for only 1 second is
shown, which represents one cardiac cycle. In this data, the interference pattern during diastole (0) and systole (S) can be seen. For measuring the relative movement between the cornea and the retina, the number of fringes crossing a fixed point must be counted. Each fringe cross accounts for a relative movement equal to half the wavelength of the light source used divided by the average refractive index of the ocular media.
In this technique, movement of the retina and the cornea cannot be obtained independently; therefore no information about the direction of the movement of the cornea or the retina can be deduced. AIso, as the laser source used in this technique has a high coherence length, it is difficult to determine with high certainty the specific eye elements producing the interference pattern.
2.3.2 Heterodyne Interferometry
Heterodyne interferometry overcomes sorne of the limitations of the homodyne interferometer, su ch as directionality measurement and intensity dependence of homodyne interferometry by introducing a modulating element in the system. In the initial course of this thesis work, a heterodyne interferometer was built in collaboration with MPB Communications Inc. (Pointe-Claire, Quebec) to measure the ocular movements. Heterodyne interferometry uses two frequencies from the same laser source. A layout of the system developed is shown in Figure 16.
The plane polarized light from a Helium-Neon (HeNe) laser is passed through an acousto-optic cell (AOC), which produces two beams of different frequencies, the
oth order beam at the actual frequency of the HeNe laser, and the 1 st order beam
with up-shifted frequency. The two signais from the AOC are coupled to polarization-maintaining single mode fibers. The oth order beam after reflection at
the beam splitter BS3 and the 1 st order beam after reflection at the beam splitter
BS 1 interfere at the reference detector. If the electric field of the oth order and the
Laser
1 st order beam
Measurement detector
- - Â./4 plate
Figure 16. Layout of the heterodyne interferometer.
El cos(27r
1;
+
~),
respectively, then the intensity Ir at the reference detector can be expressed as:+