Record Number: 21500
Author, Monographic: St-Hilaire, A.//Massicotte, B.//Arseneau, É.//Bobée, B.//Ouarda, T. B. M. J.//Chiasson, A. Author Role:
Title, Monographic: Hydrological and water quality assessment : petitcodiac watershed
Translated Title: Reprint Status: Edition:
Author, Subsidiary: Author Role:
Place of Publication: Québec
Publisher Name: INRS-Eau
Date of Publication: 2001
Original Publication Date: Avril 2001
Volume Identification: Extent of Work: v, 60
Packaging Method: pages incluant un annexe
Series Editor: Series Editor Role:
Series Title: INRS-Eau, rapport de recherche
Series Volume ID: 588
Location/URL:
ISBN: 2-89146-455-9
Notes: Rapport annuel 2000-2001
Abstract: En collaboration avec Roche Ltée
Call Number: R000588
Hydrological and water quality
assessment of the Petitcodiac
Watershed
Hydrological and water quality assessment of the
Petitcodiac Watershed
By
André St-Hilaire
Bernard Massicotte
'"
Eric Arseneau
Bernard Bobée
TahaOuarda
Alyre Chiasson
April 2001
Research Report R-588
TABLE OF CONTENTS
List of tables ... iii
List of figures ...•... iv Project team ... '" ... v 1.0 Introduction ... 1 1.1 Context ...•...•••..•...•...•.... 1 1.2 Objectives ... 1 2.0 Drainage basin ... 3
2.1 Geology and soil types ... 3
2.2 Main land uses ... 4
2.3 main water uses ... · ... 4
3.0 Methods ... 6 3.1 Meteorological analysis ... 6 3.2 Hydrological analysis ... 6 3.3 Water quality ... _ ... :8 3.3.1 Data collection ... ~ ... B 3.3.2 Data analysis ... ·8 4.0 Results ... 10 4.1 Climate ... 10 4.1.1 Air Temperature ... 10 4.1.2 Precipitation ... 10 4.2 Flows ... 11 4.2.1 Basic statistics ... 11
4.2.2 Flow duration analysis ... 11
4.2.3 Flood and low flow frequency analysis ... 12
4.2.4 Transposition of data to ungauged basins ... 13
5.0 Water Ouality ... 14
5.1 Descriptive statistics ... 14
5.2 Comparison to Canadian Water Ouality Guidelines (CWQG) ... 14
Petitcodiac Watershed Monitoring Group Water Quality analysis
TABLE OF CONTENTS
5.3 Spatial Variability (1997-2000) ... 15 5.4 Temporal variability (1975-1979 and 1997-2000) ... 16 6.0 References ... 18
Appendices
LIST OF TABLES
Table 1. Petitcodiac sub-catchments, with drainage basin areas ...•... 20 Table 2. Summary of water quality data collection ... 20 Table 3. Air temperature statistics from the Moncton Airport during the two periods of
interest ...•..•... ' ... .21 Table 4. Precipitation (mm) statistics from the Moncton airport,duringtheperiodsof
inte rest. ...•.•••••• .,. .... ' ...
!22
Table 5. Hydrological characteristics of the Petitcodiac River at Causewayand TurtleCreek ... 23 Table 6. Annual flow statistics, stations 01 BU002 (Petitcodiac) and 01 BU003 (Turtle
Creek) ... 24 Table 7. Flow duration analysis (using daily discharge in m3/s, from 1962-2000) and
mean monthly flows for Turtle Creek ... 25 Table 8. Flow duration analysis (using daily discharge in m3/s, from 1961-2000) and
mean monthly flows for the Petitcodiac River at the Causewayl ... 25 Table 9. Flood Frequency analysis of Turtle Creek and the Petitcodiac River (at
Causeway) using different statistical distributions. Floods shown in m3/s ... 26 Table 10. Low-flow Frequency analysis of Turtle Creek and the Petitcodiac River ~at
Causeway) using different statistical distributions. Flows shown in mIs ... 26
Table 11. Mean, flood and low flows (m3/s) for sub-basins of the Petitcodiac watershed, pro-rated from stations 01 BU002 and 01 BU003 ...•...•...•.... 27 Table 12. Water quality results - Descriptive statistics ... 28 Table 13. Comparison of water quality data to the Canadian Water Quality Guidelines,
by periode ... 32 Table 16. Cluster analysis based on inorganic parameters. List of waterbodies by
cluster ...•... 35 Table 17. Cluster analysis based on organic and nutrient parameters. List of
waterbodies by cluster ... 36
iii Petitcodiac Watershed Monitoring Group Water Ouality analysis
LIST OF FIGURES
Figure 1. Map of the Petiteodiae watershed showing locations of sampling and
hydrometrie stations ... 37
Figure 2. Mean an nuai diseharge at stations 01 BU002 and stations 01 BU003. Lines show trends with 5-year means ...•...•...•...•...•. 38
Figure 3. Results of cJuster analysis based on a) inorganie parameters and b) organie and nutrient parameters. Parameters used in the analysis are listed in tables 14 and 15. The dendrogram shows the degree of similarity between the different water bodies within the Petiteodiae watershed.
Hierarehieal elustering using average linkage ... 39
Figure 4. Temporal variations in seleeted water quality parameters in the Petiteodiae River, 1975-2000. Graphies show individual values and quantile boxes
(10th, 25th, 50th, 75th, and 90th quantiles) ... .40
Figure 5. Temporal variations in seleeted water quality parameters in the Petiteodiae River, 1975-2000. Graphies show individual values and quantile boxes (10th, 25th, 50th, 75th, and 90th quantiles) ... 41
Figure 6. Monthly variations in seleeted water quality parameters in the Petiteodiae
PROJECT TEAM
Petitcodiac Watershed Monitoring Group:
Éric Arseneau, M.A. Coordinator Alyre Chiasson, Ph.D. Technical Advisor
Roche Ltée, Groupe-conseil:
Bernard Massicotte, M.Sc. Biologist
INRS-Eau, Chair in Statistical Hydrology:
Bernard Bobée, Ph.D. Director Taha Ouarda, Ph.D. Professor
André St-Hilaire, Ph.D. Research Associate
New Brunswick Department of the Environment and Local Governments
Sheila Goucher, B.Sc. Chemist
Reference to be cited:
St-Hilaire, A., B. Massicotte, A., B. Bobée, T. Ouarda, E. Arseneau, A.. Chiasson.2001. Petitcodiac Watershed Monitoring: Water quality and hydrologieal analysis. Report produced by Roche Ltée, Groupe-conseil and INRS-Eau on behaH of 1he Pe1itcodiac Watershed Monitoring Group. 42 p., 1 appendix.
v Petitcodiac Watershed Monitoring Group Water Quality analysis
1.0 INTRODUCTION
1.1
CONTEXT
The Petitcodiac River is located in Southeastern New Brunswick. It has a drainage basin area of 1999 km2, which is home to approximately 120 000 people, most of whom live in the
Greater Moncton area.
One of the main features of this river system is the presence of acauseway. Hwas builUn 1968, wh en it became obvious that the Gunningsville Bridge could not sustain the growing traffic between Moncton and Riverview. The presence of the causeway has changed the hydrodynamic conditions in the river system. A debate on how to best manage these changes and their effects has been ongoing for a number of years. For this reason, a lot of attention has been devoted to this river system by the media, various govemment departments (both federal and provincial) and the scientitic community in recent years.
ln 1997, the Petitcodiac Watershed Monitoring Group (PWMG) was founded with a mandate to establish and support a network of volunteers who will conduct long-term water quality monitoring in the Petitcodiac watershed (Frenette, 2000). Since then, water quality data has been gathered by the PWMG at various locations in the watershed. The PWMG has also collected historical water quality data. These past and more recent data allow for spatial and temporal analysis of the water quality in the Petitcodiac drainage basin. Water sample collection and analyses have been carried out in partnership with ELG. In 1999, the PWMG received funding from the Environmental Trust Fund (ETF) to carry out a two-year water classification project.
The Petitcodiac Watershed Monitoring Group has therefore hired Roche Ltd, with the assistance of the Chair in statistical hydrology (INRS-EAU, Université du Québec) to produce a report on water quality data measured on the Petitcodiac watershed.
1.2
OBJECTIVES
The main objective of this mandate is to summarize and interpret the water quality data collected trom the Petitcodiac River and some of its tributaries. More specifically, the analyses are aimed at comparing water quality both spaüally (i.e. comparisons between
stations on the watershed, and temporally (Le. comparisons between the two sampling periods). In order to facilitate the interpretation of water quality data, an analysis of the prevailing meteorological (Le. rain and air temperature) and hydrological (Le. freshwater flows) conditions were also included.
This first report focuses on a brief description of the methodology and the results of the analyses. A second report will be produced to summarize the technical information gathered here for a larger, non-technical audience.
2 Petitcodiac Watershed Monitoring Group Water Quality analysis
2.0 DRAINAGE BASIN
From its headwaters to the causeway, the Petitcodiac drainage basin covers a surface of 1360 km2 (Figure 1). Downstream of this structure, the Petitcodiac estuary is modulated bya
very important tidal range, leaving very little water at low tide and rapidly increasing to depths greater th an 3 m at high tide. The main sub-basins (Le. drainage area greater than 290 km~ include the Polett River, North River, and Little River (Table 1 ). The medium-sized tributaries (drainage area between 100 km2 and 200 km2) include TurtleCreek, the Anagance Hiver,
and Halls Creek (including Humphrey Brook). Other smallerbrooks and streams also discharge into the Petitcodiac River. They include Jonathan Creek in Moncton, Fox Creek in Dieppe, as weil as Mill Creek and Weldon Creek (Table 1).
2.1
GEOlOGY AND SOll TYPESThe bedrock on the drainage basin is mostly composed of Pennsylvanian (or younger) red and grey sandstones, conglomerate and siltstones. On the north shore of the Petitcodiac River, and in the upper reaches of the Anagance River, the North River and the other tributaries on the north shore, the bedrock is mostly made of Mississippian red to grey sandstones, and shales with some volcanic rocks. Similar geological formations are found in the southern part of the basin, around the Memramcook River and on the Wei don Creek sub-basin (New Brunswick Department of Natural Resources, map #NR-1. 1979).
During the late quaternary era, most of the Petitcodiac drainage basin was under sea level, with the OeGeer Sea (extending from the current Bay of Fundy) covering the southem part of the basin and the Goldthwait Sea (extending from the current Northumberland Strait) covering the northern part of the basin.
Most of the basin is characterised by topsoils (first 0.5 m) made of veneer (sand and silt, with sorne clay), under which there is usually ablation moraines. Near the main river banks, however, the intertidal plains and salt marshes have soils composed mostly of clay and silt, with some fine sand (Geological survey of Canada, map 1594A, 1982).
2.2
LAND USEThe City of Moncton Engineering Department has collected land use data for the Greater Moncton Planning district. These data have been used in a Geographical Information System (GIS) to produce land use maps. The information found in these maps is summarized here. Detailed maps of land use will also be provided in the second report to be produced.
The Petitcodiac watershed is mostly a forested territory, especial1y in its southem portion. Logging is an important industry in the area. Dlder forests can usually be found in the upper reaches of the tributaries located on the south shore of the Petitcodiac. The lower reaches have been subjected to logging. The forest in the lower portion of these sub-basins is therefore mostly composed of plantations, young forests and regenerating areas.
Agriculture is concentrated along the shores of the Petitcodiac and its tributaries, especially in the northern portion of the basin. Lands in the vicinity of the Anagance and North Rivers are mostly agricultural. There is also sorne agricultural activity along the Pollett and Little Rivers. Turtle Creek is used as the main drinking water source for the Greater Moncton area (Moncton, Dieppe and Riverview). Most of its drainage basin is forested, except for the lower reaches near its confluence with the Petitcodiac, which is agricultural.
The largest urban area is the Greater Moncton area with a total population nearing1 00 DOD. It surrounds the lower reaches of Halls Creek and Jonathan Creek in Moncton, as weil as Fox Creek in Dieppe. The presence of an old dumpsite on the north shore of the river between the Gunningsville Bridge and the causeway, has recently been a cause of concem and was mentioned as a potential threat to water quality, should there be a major erosion of the river banks at the site. Two other urbanized areas are found upstream of Moncton, along the shore of the Petitcodiac. The town of Petitcodiac is located near the confluence of the North and Anagance Rivers, and the town of Salisbury is located near the confluence of the Little River and the Petitcodiac River.
2.3
MAIN WATER USESAs stated before, water quality in the upper reaches of Turtle Creek is of the upper-most importance, because it is the main source of drinking water for the Greater Moncton area. In the city of Moncton, Jonathan Creek has an important recreational mission. The creek is a
4 Petitcodiac Watershed Monitoring Group
central feature in Centennial Park and water quality has been a cause for conœrn in the past.
Upstream of the causeway, Lake Petitcodiac (the reservoir) is used by boaters for recreational purposes. Angling (mostly for trout) is also popular throughout the river system, upstream of the causeway.
Downstream of the causeway, on the south shore, the collected sewage of the cHies of Moncton, Riverview and Dieppe is received in the tidal portion of the river. There is sorne seasonal commercial fishing (gaspereau, shad and smelt) downstream of Moncton, iin 1he estuary.
3.0 METHODS
3.1
METEOROLOGICAL ANAL VSISStatistical analyses of meteorological parameters focused on the two variables, which are more Iikely to cause variations in water quality, namely air temperature and precipitation. Data provided originated from the Moncton airport, and essentially coveredthe months of May to September for the years 1975-1977 and 1997-2000. Data for themonthsof April, October and November were provided for sorne years. Basic descriptivestatis1ics (mean, minimum, and maximum) were computed with the available data for the periodsof interest, on a monthly basis.
Time series were tested for homogeneity (Le. no significant change in means between two periods, 1975-1977 and 1997-2000) using the Wilcoxon signed rank test (Wilcoxon, 1945, 1946; Hollander and Wolfe, 1973) for the mean. The Levene test (Levene 1960) was used to verity if there were shifts in the variance between two data sub sets (Le. two periods).
3.2
HVDROLOGICAL ANAL VSISTwo gauging stations, operated by Environment Canada are locatedon the watershed (Figure 1). Station 01 BU002, on the Petitcodiac River, near Petitcodiac (lat. 452 56' 37",
long. 652 10' 13") has a gauged drainage area of 391 km2
• Station 01BU003, .00 Turtle
Creek (lat. 452 57' 29", long. 64252' 44"), is on a tributary of the Petitcodiac River located on
the South Shore, with its confluence upstream of the Causeway. The gauged area for this station is 129 km2•
The Petitcodiac River has been gauged since September 1961, while flow measurements were initiated in Turtle Creek in September 1962.
Caissie (2000) has performed a detailed hydrological analysis of daily f10ws trom station 01 BU002. This analysis included flow duration and frequency analysis. Results produced by Caissie (2000) are summarized in the next section. In order to be consistent, most of the analyses performed by Caissie (2000) on station 01 BU002 were repeated for station 01 BU003 (Turtle Creek), which is the other gauged station on the basin. Basic descriptive statistics (monthly mean flows, annual means, and variance) were also calculated.
6 Petitcodiac Watershed Monitoring Group
Methods used include a study of the variability of annual runoff, analysis of independence within the time series, flow duration analysis and high and low flow frequency analyses. The Wald-Wolofowitz test (Wald and Wolfowitz, 1943), used by Caissie (2000) on the Petitcodiac River flows, was perlormed on Turtle Creek data to verity the hypothesis that daily flow observations were independent from one another. The Kendall test (Kendall, 1975) was used to verify stationarity (Le. no trend in the time series), and S-year moving averages were calculated and used as a smoothing technique to describe potential tong-term variability. The Wilcoxon rank test (Wilcoxon, 1945, 1946; Hollander and Wolfe, 1973) was used to verity homogeneity of the sample sets. Associated p-values (p) werecatculated and used to accept or reject the null hypotheses at a level of 5% (a
=
0.05)Monthly flow duration analysis were perlormed to show the distribution of discharge as a function of exceedance, in accordance with the method used by Caissie (2000) for station 01 BU003. The percentage of time a specifie discharge is equalled or exceeded was calculated for the entire time series at Turtle Creek.
High and low flow analyses were carried out using Turtle Creek data, and the same analyses perlormed by Caissie (2000) on the Petitcodiac data were reproduced. Annual floods (Le. maximum daily discharge) were identified and used by fitting different distribution functions to determine the frequency of discharge events. Caissie (2000) used four (4) distribution functions, three (3) of which are used in this report: The Three Parameter Lognormal (LN3), The Type 1 Extremal (Gumbel), and the Log-Pearson Type III (LP3) distribution functions. Low flow frequency analysis at station 01 BU003 with the same method used by Caissie (2000) on station 01 BU002. The Type III Extremal (T3E) distribution function was used and the return periods of low daily discharge events were calculated.
The frequency analyses and most statistical tests were done using the HYFRAN software (Bobée et al. 1999) developed at INRS-EAU.
Finally, sorne of the results of the statistical and frequency analyses were transferred from the reference stations to ungauged sub~basins using the ratio of drainage areas. It was assumed, for a first attempt at extrapolating hydrological information, that basic rainfall-runoff conditions, which depend on the basin topography, stream network and land uses, were relatively homogenous throughout the basin. Discharge can then be estimated using the
Where:
Og
=
discharge of the gauged drainage basin (m3/s);Ou
=
discharge of the ungauged drainage basin (m3/s); Ai=
Area of drainage basin (km2).3.3
WATER QUALITY3.3.1
Data collectionWater quality data were collected at two different periods, 1975-79 and 1997-2000. The first series of data were obtained by the New Brunswick Department of the Environment while the second series were collected by both the Petitcodiac Watershed Monitoring Group (PWMG) and the New Brunswick Department of Environment and Local Government (ELG, formerly DOE). A summary of sampling events is presented in table 2. Ali water samples were grab samples collected by hand with the exception of samples taken from the causewayin 1997, which were collected by a sample iron in one or two occasions.
Field observations were recorded by the volunteers on site and the field data sheets given to ELG staff who recorded them in their database. In 1997-98, fall field measurements were carried out using LaMotte kits (water temperature, pH and dissolved oxygen). In 1999 and 2000, dissolved oxygen measurements were made using a YSI instrument. The sampling events carried out by the volunteers were usually carried out on the last Sunday of each month. The samples were placed in coolers, packed with ice, and delivered to Fredericton either by bus or by courier. They arrived at the Analytical Services Laboratory of the Department of the Environment and Local Government the next morning where they were preserved and analysed according to accepted protocol. Metals results given are for total extractable metals.
3.3.2
Data analysisWater quality data were extracted from the ELG water quality database. Four data sets were used in this study. The first comprises the data gathered during the 1975-1979 period. The
8 PetitcocJiac Watershed Monitoring Group
second corresponds to the 1997-2000 period. Two additional data sets were included in the analysis. These data sets contained additional data from the Jonathan Creek sub-basin and bacterial data for the year 1997.
Prior to statistical treatment, ail values lower than detection limit were recoded to ha" the value of the detection limit for a given parameter (Newman 1989). This step was performed in order to allow the computation of the various descriptive statistics (percentiles, means. etc.). Similarly, coliform results reported as above a given value were re-coded to that value. The descriptive statistics were calculated for the entire database, .wherethe two periods .of sampling (1975-77 and 1997-2000) were combined.
For each of the two sampling periods, data have been compared to the Canadian Water Quality Guidelines (CCME 1999) for the protection of aquatic life. The data have been analysed in order to calculate the frequency at which these guidelines were exceeded during the two periods.
The database comprises a total of over 600 sampling events carried out at 45 different locations in the watershed. In order to summarise the information, cluster analyses (Legendre and Legendre 1984) have been performed using the sampling events as objects and water quality parameters as descriptors. The aim of these analyses is to address the spatial variability of water quality within the watershed, by calculating the degree of similarity between the different water bodies. The end result is the formation of clusters of information (i.e. stations or water bodies) with similarities. Only the 1997-2000 data have been used in order to control the temporal variability. The cluster analyses have been performed on the average values for each waterbody for the period. The calculations were done using
the
hierarchical agglomeration method with average linkage (SAS JMP, v.3).Temporal variability has been examined at two different time scales, multi-year and monthly. ln both cases a subset of stations were selected in order to control spatial variability. Stations with the most extensive records were thus selected. For multi-year comparisons, two sets of stations were used: those on the Petiticodiac River and on Jonathan Creek, which were analysed separately. For monthly comparisons, the analysis used the data trom four stations of the Petitcodiac: stations PWMG # 4,10,15
&
16.4.0
RESULTS
4.1
CUMATE4.1.1 Air Temperature
Monthly air temperature maximum, minimum and means werecalculated for the two periods of interest (1975-1977 and 1997-2000; Table 3). Typically, mean air tempe ratures increase from around 10°C in May to close to 20 oC in July and August (Table 3). By October, mean monthly air temperatures have typically decreased to the mid teens. The highest monthly mean temperature between May and September for both periods was 20.6 oC (July 1975) . . The lowest monthly mean temperature occurred in May 1977 (9.0 OC).
Daily air temperatures from the earlier (1975-1977) and later period (1997-2000) were compared and tested for shifts in means and variance. Bath tests (i.e. Levene for variance and Wilcoxon for means) showed no significant differences in the monthly means (0.06 < P <
0.62) or variances (0.15 < P < 0.44) of air temperatures during the months of May through September. This implies that the air temperature regime can Iikely be considered similar for the two periods of interest.
4.1.2 Precipitation
Total sol id and Iiquid precipitation was calculated from available data at the Moncton airport during the two periods of interest. 1977 was the year with the wettest spring and summer (May-September) period with a total of 591 mm of rain, followed by 1999 with 514 mm of rain (Table 4). The driest spring and summer period occurred in 1997 with only 389 mm of rain. Daily precipitation of the earlier (1975-1977) and latter period (1997-2000) were compared on a monthly basis and tested for stationarity. Bath tests (i.e. Levene for variance and Wilcoxon for means) showed no significant differences (p = 0.7 for mean and p= 0.11 for variance) in the precipitation regime du ring the months of May through September. This means that the precipitation regime can be considered equivalent for the two perjods of interest
10 Petitcodiac Watershed Monitoring Group
4.2
FLOWS4.2.1 Basic statistics
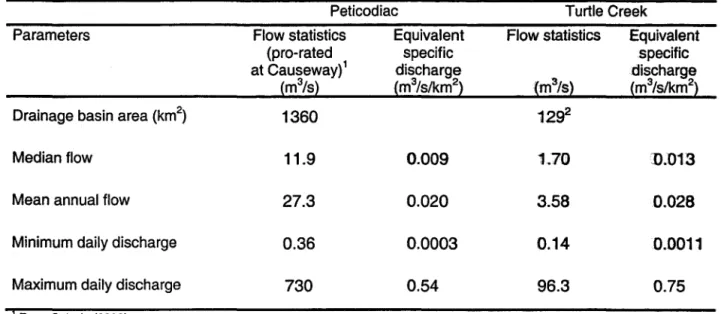
From the time series of daily flows, the mean annual discharge of the Petitcodiac River at the causeway was calculated by Caissie (2000) to be 27.3 m3/s, while it was calculated to be 3.6
m3/s for Turtle Creek (Table 5). These mean flows translate to specific discharge of
0.02 m3/s/km2 (20 Us/km2) and 0.03 m3/s/km2 (30 Us/km2) respectively. The median flow
(flow available 50% of the time) was al 50 calculated and was found to be 11.9 m3/s on the Petitcodiac at the causeway, and 1.7 m3/s for Turtle Creek.
Daily discharge measured in Turtle Creek ranged between a minimum of 0.14 mS/s and a maximum of 96 m3/s. For the Petitcodiac River at the causeway, Caissie (2000) found the
range of discharge to be between 0.36 mS/s and 730 m3/s. When converted to specific
discharge, the minimum flow in Turtle Creek (1.1 Us/km2) is higher th an the minimum flow in
the Petitcodiac River (0.3 Us/km2). Maximum specific discharge in Turtle Creek
(750 Us/km2) is 1.4 times higher th an the maximum discharge measured in the Petitcodiac
River (540 Us/km2).
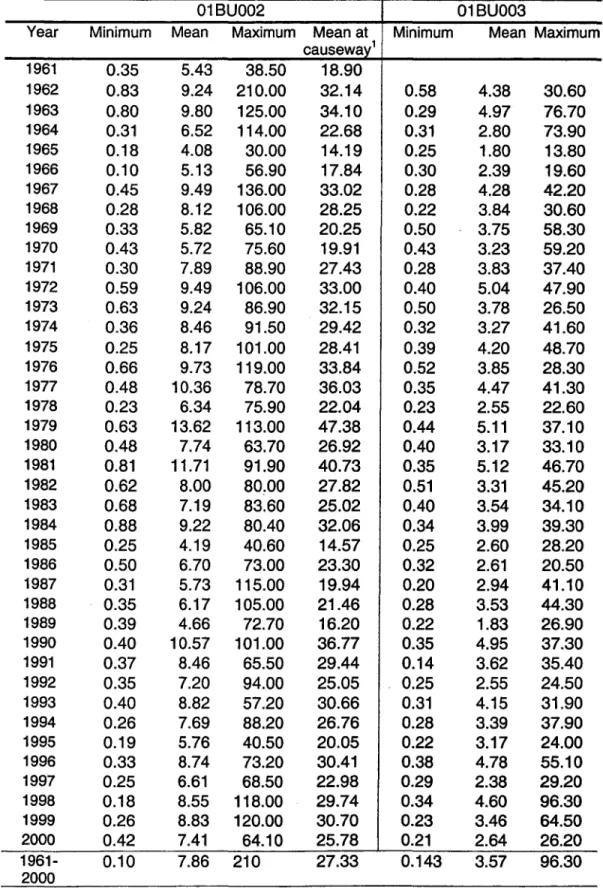
Maximum, minimum and mean annual discharges were also calculated for each year at both stations (Table 6). As reported by Caissie (2000), the highest mean annual flows Were recorded for both stations during the late 19705 and early 19805. This trend is especially visible when looking at five-year moving average for station 01 BU002 (Petitcodiac River, Figure 2). Minimum mean annual flows were reached in the late 19805 at station 01 BU002 (Figure 2). Between 1985 and 1989, mean an nuaI flows were consistently Jess th an
7.9 m3/s, which is the mean for the entire period of measurement. On Turtle Creek, the same period was also characterised by annual means below the average Of 3.57 m3/s for the entire period of observation (Table 6).
4.2.2 Flow duration analysis
Monthly flow duration analyses were performed for Turtle Creek (station 01BU003, Table 7) and for the entire Petitcodiac drainage basin at the causeway (from Caissie 2000, Table 8) using historical data. The highest observed value (0% exceedance) reached a maximum in November (96.3 m3/s) and March (91.8 m3/s) at Turtle Creek (Table 7), while they were in April (730 m3/s) and January (414 m3
Monthly means show that the lowest mean monthly discharge occurred in August and September at Turtle Creek (0.77 m3/s; and 0.79 m3/s respectively, Table 7). For the entire basin, the monthly means for the same months are 7.68 m3/s and 7.10 m3/s respectivety (Caissie 2000). Table 7 shows that the monthly means at Turtle Creek are exceeded between 30% and 40% of the time during the spring months (March to June), while they are typically exceeded between 20% and 30% of the time for the other months. For the Petitcodiac River at the Causeway, mean monthly flows are exceeded 30% of the time in
April and November, and 20% of the time for the othermonths ,(Table 8).
4.2.3 Flood and low flow frequency analysis
Prior to performing flood frequency analyses, a Kendall test for stationarity was performed on the Turtle Creek data, which revealed that there is no significant trend in the flow time series of station 01 BU003 ( 1 KI
=
0.762,P
=
0.45). When the data set from Turtle Creek was split in two sub-samples (1962-1983 and 1983-2000), a Wilcoxon test also confirmed that the means of the two sub-samples were not different ( 1 W 1=
0.836, P=
0.40).Caissie (2000) had found a sma" decreasing trend in the annual flood data of the Petitcodiac River at the causeway, which is attributed to the high flood value of 1962 (730 m3/s).
As described in section 3, flood data (annual maximum 'daily flows) were fitted with three different distribution functions (LN3, Gumbel, LP3) usingthe method of moments. ResLiIts showed that the estimated 2-year flood ranged between 36.6 m3/s and 37.1 m3/s at TurtJe Creek (Table 9). For the same recurrence interval, floods for the Petitcodiac at the Causeway were calculated to be between 287 m3/s and 284 m3/s (Caissie 2000). A 100-year flood at Turtle Creek varied between 93.4 m3/s and 95.7 m3/s, while it was calculated to be between 617 m3/s and 673 m3/s for the Petitcodiac River at the causeway (Table 9). Prior to performing a low flow analysis on Turtle Creek, sta1ionarity was verified using the Kendall test (Kendall, 1975). No significant trends were found
(1
KI
=
1.31, P=
0.19). The Wilcoxon test revealed that the low flow series is not homogenous. When split in two series (1962-1983 and 1984-2000), means of the sub-samples were shown to be significantly different at a confidence level of 5%, but not significantly different at a confidence level of 1 %( 1
KI
=
2.23, p=
0.026). Further analysis wascarried out by applying the bayesian procedure, proposed initially by Lee and Heghinian (1977), adapted by Ouarda et al. (1999) for the analysis of hydrometric data, and revised by Perreault et al. (2000) for the detection of12 Petitcodiac Watershed Monitoring Group Water Quality analysis
shifts in the mean of hydrological and meteorological time-series. This procedure provides an approach to characterise wh en and by how much a single change has occurred in a sequence of random variables.
Results of this approach show that there is a strong (p=0.98) probability that a shift in the means of annual low flows occurred in the time series. The mode of the distribution of probable years of occurrence of this shift is 1984 (standard deviation of 6.8 years). The mode of the distribution of means prior to the shift is 0.37 m3/s, whIle !hemada ·forthe distribution of means after the shift is 0.27 m3/s.
Based on the conclusions of the Bayesian analysis of low flow time series,it was decided 'to break the time series in two subsets (1962-1984 and 1984-2000), and to perform separate low flow frequency analysis for each subset.
The Type 3 Extremal distribution (T3E) was fitted to annual minimum flows at Turtle Creek (two subsets) and for the Petitcodiac River at the Causeway (Table 10). For the first period (1962-1983) a two-year low flow was calculated to be 0.37 m3/s. For the second period, (1984-2000) a two-year low flow was 0.28 m3/s at Turtle Creek. Low flows with recurrence periods of 5 years at Turtle Creek were calculated to be 0.26 m3/s for the first period and 0.19
for the second (Table 10).
For the Petitcodiac River at the Causeway, Caissie (2000) calculated the two-yeartowflow 10 be 1.4 m3/s and the 1 O-year low flow to be 0.68 m3/s (Table 10).
This hydrological information will assist in explaining water quality fluctuations in the context of fluctuating flows.
4.2.4 Transposition of data to ungauged basins
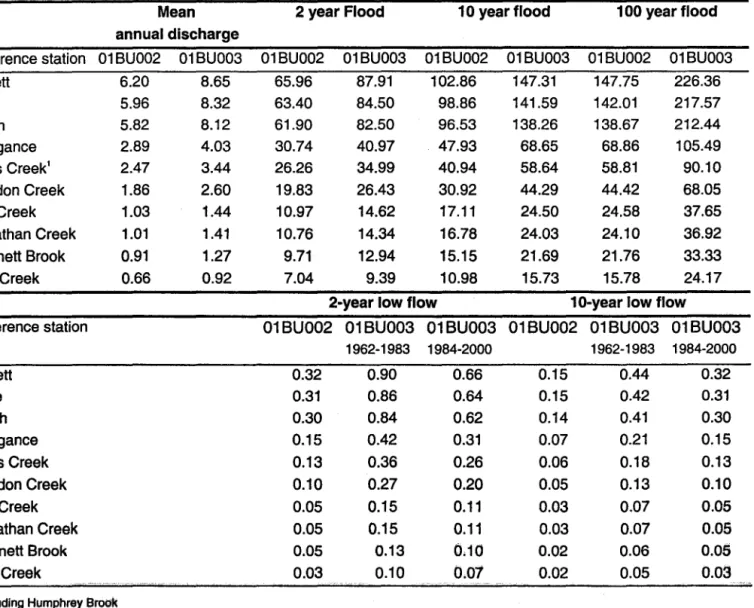
Mean, flood and low flow information calculated for the Petitcodiac River and Turtle Creek were transferred to other drainage basins using the ratio of drainage area (Table 11). Because of the difference in specific discharges between the two gauged basins, mean flood and low flow values transferred using the Petitcodiac River as a reference station are different than values calculated using Turtle Creek as a reference station. Mean annual discharge and flood values pro-rated from station 01 BU002 (Petitcodiac) are typically 65% to 75% smaller than those transferred using station 01 BU003 (Turtle Creek) as a refarence.
Low flow values pro-rated from the Petitcodiac are also typically 50% to 65% smaller than those pro-rated from Turtle Creek (Table 11).
For instance, a two-year flood for Fox Creek was calculated to be 0.66 m3/s using Petitcodiac data, while it was calculated to be 0.92 m3/s using Turtle Creek data (Table 11). A two-year low flow for the same tributary was calculated to be 30
Us
using station 01 BU002 as a reference, while it has a value of 100Us
if the reference station is 01 BU003 (Table 11). This may be indicative that our initial assumption of a relative homogeneity in the hydrological characteristics of sub-basins may need to be reviewed. Such a detailedanalysis is ,beyond the scope of the present mandate, however.5.0 WATER QUALITY
5.1
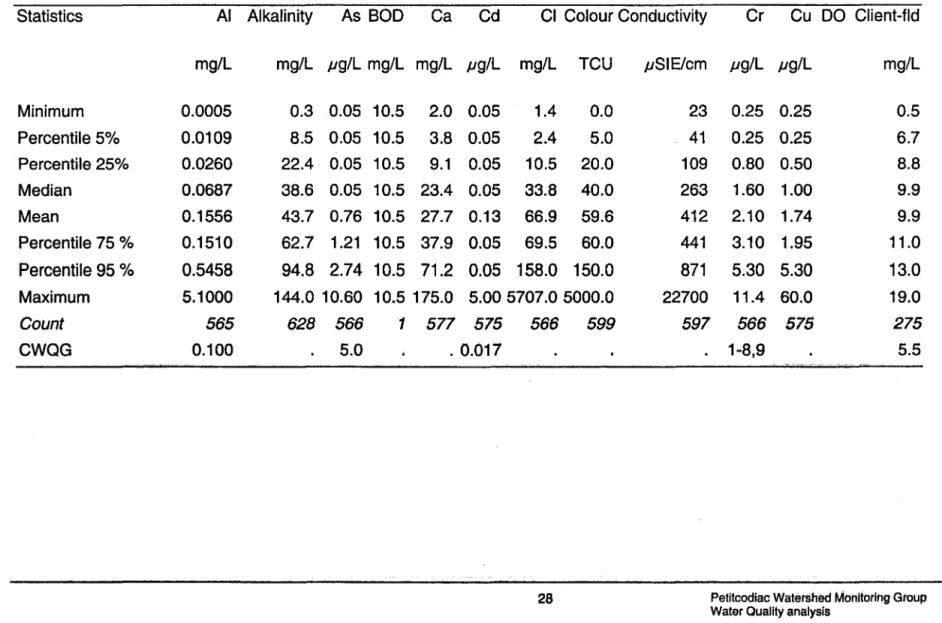
DESCRIPTIVE STATISTICSDescriptive statistics calculated from ail available water quality data are presented in Table 12. Based on median values, the waters of the watershed can be generally classified as slightly alkaline (pH slightly above neutrality) with moderate hardness and nutrient loading. Among the nutrients, P04 levels are relatively high with a median of 0,02 mg/L and a 75%
percentile of 0,04 mg/le Most metals are generally in low concentrations with the exception of aluminium and iron, which are often found in relatively high concentrations. High levels of copper, lead and zinc have also been observed in a small number of sampi es, with maximum values of 60,50 and 906 pg/L respectively.
5.2
COMPARISON TO CANADIAN WATER QUALITY GUIDELINES (CWQG)A comparison to CWOG is provided in Table 13. For the 1975-79 period, only six parameters are available for comparison to the CWOG: cadmium, dissolved oxygen, lead, mercury, pH and zinc. Zinc levels were above the guideline in ail of the nine samples. This may have been caused by the fact that the detection Iimit was higher than the current guideline value for aquatic Iife. Cadmium and lead were never detected in the samples; however the detection limit used was greater than the value of the guideline and therefore it cannotbe excluded that some of the values were above the guidelines. As for pH, only 5 values out of 97 were below the recommended range of 6,5 - 9. Dissolved oxygen was alwayswithinthe acceptable range for aquatic Iife (5,5 - 9,5 mg/L).
14 Petitcodiac Watershed Monitoring Group
Between 1997 and 2000, aluminium and iron were above the guidelines in 39% and 50% of the samples, respectively. It should be noted that for chromium, the criteria used for the comparison is applicable to hexavalent chromium (CrVI), while laboratory results are given in total extractable chromium, which may include both CrVI and the less toxic trivalent species (Crlll). The guideline for Crlll is 8,9 pg/l as compared to 1,0 pg/l for CrVI. The frequency of values above the guideline reported for chromium (67%) treats ail chromium as CrVI as no attempt was made to estimate the fraction present as CrVl. This value should thus be considered as conservative.
To a lesser extent, values above the CWQG are reported iorother parameters, with frequencies lower than 10%. These parameters are arsenic, cadmium, dissolved oxygen, N02, lead, pH and zinc.
5.3
SPATIAL VARIABILITY(1997-2000)
Nineteen different water bodies (rivers or their tributaries) have been sampled during the 1997-2000 period. In order to assess the spatial heterogeneity within the watershed, cluster analyses have been performed at the scale of the water body. These analyses were done for two categories of water quality parameters: inorganic (Table 14) and organic (Table 15). For inorganic parameters, the results indicate three distinct groups of water bodies within the watershed, as seen in Table 16 and Figure 3. The list of parameters used in the analysis, as weil as the average value for each cluster, are presented in table 14. The dendrogram iIIustrating the different clusters is presented in Figure 3(a). Table 16 lists the rivers included in each cluster for inorganic parameters. The results show that the Memramcook River clearly stands out and forms one of the clusters by itself (cluster INORG2). This iIIustrates the marine influence that affects both of the stations sampled in this river, especially station PWMG #36, at College Bridge. Another cluster (cluster INORG3) only includes Jones Lake with higher mean concentrations of metals, including lead. Cluster INORG3 comprises ail the other sampling stations.
The second cluster analysis, performed on organic and bacterial (E Coli) water quality parameters also showed three groups (Table 17, Figure 3(b». Rabbit Brook and the west Branch of Halls Creek were grouped in the same cluster (ORG2), characterised by high mean E coli concentrations (3292 MPN/100 ml; Table 15) and high Nitrate concentration (mean of 0.98 mg/l; Table 15). Cluster ORG3 includes Fox Creek, Humphrey Brook, Jones
Lake, the Memramcook River and Mill Creek. They have higher Nitrogen (TKN=0.64 mg/L)
concentrations and higher phosphate (P04
=
0.06 mg/L) th an the other two clusters.5.4
TEMPORAL VARIABILITY(1975-1979
AND1997-2000)
Long-term variations in various water quality parameters are presentedin Figures 4 (Petitcodiac River) and 5 (Jonathan Creek). Several parameters were measured ont y during the second period of observation (1997-2000) and therefore the range of parameters for which comparisons are possible is limited to nutrients, pH, alkalinity and colour.
ln the Petitcodiac River (Figure 4), one of the most important differences belween the 1wo periods is an apparent rise in water pH. White pH values were generally nearly neutral (Le. 7.0) in the 1970's, values below 7.5 were uncommon during the second period where median values were consistently close to 8.0 (slightly alkaline). Temporal trends are also observed in organic nitrogen (TKN) and orthophosphates (P04). These parameters were observed in very
high concentrations in sorne occasions in the 1970's, with maxima in the range of several
mg/L. Such extreme values were not observed in the recent period where concentrations
were consistently lower. As for NOx (nitrates - nitrites), no clear trend is apparent in the
Petitcodiac data.
ln Jonathan Creek (Figure 5), an apparent increase in pH is also observed, albeit less important th an in the Petitcodiac River. Median values were close to 8.0 in the second period, about one unit higher than in the 1970's. Othophosphates levels were relatively high in the 1970's and are consistently lower and less variable in the recent period. The same trend is observed for NOx• No significant trend is observed in the other parameters, including
TKN.
Data from the Petitcodiac River and Jonathan Creek suggest a decrease in nutrient loading between the two periods. In particular, P04 levels were markedly reduced, which is
favourable for the quality of the aquatic environment where this nutrient can be a major cause of eutrophication.
Short-term (monthly) variations have also been investigated. Data collected al four stations of the Petitcodiac (stations PWMG # 4, 10, 15 & 16) during the 1997-2000 period have been used to document these variations. Results are presented in Figure 6. Polynomial trends (second degree) are presented. It should be noted that the amount of variabitity expJained by
16 Petitcodiac Watershed Monitoring Group Water Quality analysis
these models varies greatly from one parameter to another and a large amount of unexplained variability (variability caused by other factors th an monthly variations) persists in ail cases. The amount of variance explained by each model is quantified using the «RSquare adjusted», shown below the graphs. A model explaining 70% of the variance would have a Rsquare adjusted of 0.7. The trends are presented for iIIustrative purposes only.
Many parameters showed important variations over months. Aluminium concentrations were higher in June and October and lower in August and September. The seme patterns observed for E. coli, iron, NH3 and P04• By contrast, conductivityand pH showed opposite trends, with maximum values in mid-summer. These trends are directlyrelated totbe hydrological regime in the watershed. August and September are the months where the lowest flows are observed in the Petitcodiac River (see Table 7). In baseflow conditions, the relative importance of groundwater flow is greater as dilution from rainfall is minimal. Groundwater typically demonstrates higher concentrations in major ions (e.g. Ca, Mg, K) which translates into higher electrical conductivity. Similarly, pH is generally higher in groundwater and greater pH values are th us expected in baseflow conditions. On the other hand, many pollutants, especially nutrients, are significantly related to precipitation and storm events and are expected to reach maximum values at high flows.
Although the months at which observations are available do not coverthe monthsOfhighest discharge (April, May), the data suggest that various pa rameters , including aluminium, iron and E. Coli, are sensitive to seasonal variations in discharge. It cannot be excluded that high concentrations of various parameters, especially aluminium and nutrients would be foundin maximum concentrations during the spring freshet and storm events. Sampling during these events could provide additional information about the general state of the watershed and potential sources of contaminants of the Petitcodiac River.
6.0 REFERENCES
Bobée, B. M. Haché, V. Fortin, L. Perreault et H. Perron. 1999. Hyfran, version 1.1 bêta. Developped by the Chair in Statistical Hydrology, INRS-Eau.
Caissie, D. 2000. Hydrology of the Petitcodiac River basin in New Brunswick. Cano Tech. Rep. Fish. Aquati. Sci. 2301 : 31 p.
CCME (Canadian Council of Ministers of the Environment).1999.. 'Canadian wateT
quality
guidelines for the protection of aquatic life: Summary table. In: Canadian environrnental quality guidelines 1999, Canadian Council of Ministers of the Environment, Winnipeg.Frenette, 1. 2000. Petitcodiac Watershed Monitoring Group. progress report: 31 p. Geological survey of Canada (1982). Geological map, #1594A.
Ho"ander, M. and Wolfe, D. A. (1973). Non parametric statistical methods, John Wiley, Toronto, 503pp.
Kenda", M.G. (1975). Rank correlation methods, Chanes Griffin, London.
Lee, A.S.F. and S. M. Heghinian (1977). A Shift of the Mean Level in a Sequence of Independent Normal Random Variables: A Bayesian Approach. Technometrics, 19(4), 503-506.
Legendre,
L.
and P. Legendre. 1984. Écologie numérique. 2nd Edition. Masson, Paris et les Presses de l'Université du Québec, Québec.Levene, H. (1960). Robust tests for the equality of variances, in Contributions to Probability and Statistics, Eds. 1. Olkin & Paolo Alto, Stanford University Press: 278-292.
Newman, M.C., P.M. Dixon, B.B. Looney et J.E. Pinder. 1989. Estimating mean and variance for environmental samples below detection limit observations. Water Res. Bull. 25(4): 90S-916.
New Brunswick Department of Natural Resources (1979) •• Surficial ~Geology, map #NR-1.
18 Petitcodiac Watershed Monitoring Group Water Quality analysis
Ouarda, T.S.M.J., P.F. Rasmussen, J.-F. Cantin, B. Sobée, R. Laurence, V.-D. Hoang and G. Barabé (1999). Identification of a hydrometric data network for the study of climate change over the province of Quebec. Revue des Sciences de l'Eau, 12/2 : 425-448 (in French). Perreault, L., J. Bernier, S. Sobée and E. Parent (2000). Sayesian change-point analysis in hydrometeorological time series, Part 1. The normal model revisited, J. Hydro!., 235 : 221-241. Wald, A. and J. Wolfowitz (1943). An exact test for randomness in the non-parame tric case .based on seriai correlation. Ann. Math. Statist., 14 :378-388.
Wilcoxon, F., (1945). Individual comparison by ranking methods. Biometries, 1 :80-83.
Wilcoxon, F., (1946). Individual comparisons of grouped data by ranking methods.
J.
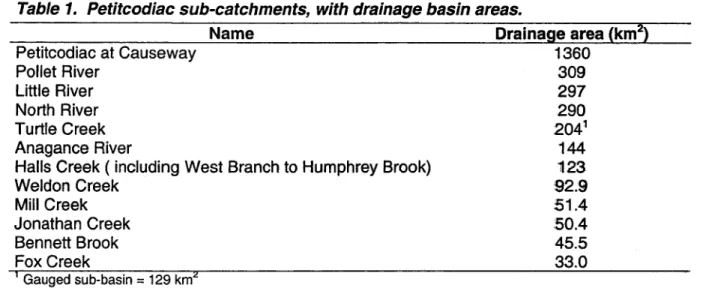
Econ. Entomo!., 39 : 269-270.Table 1. Petitcodiac sub-catchments, with drainage basin areas.
Name Drainage area (km2)
Petitcodiac at Causeway Pollet River Little River North River Turtle Creek Anagance River
Halls Creek ( including West Branch to Humphrey Brook) Weldon Creek Mill Creek Jonathan Creek Bennett Brook Fox Creek 1 Gauged sub-basin = 129 km2
Table 2. Summary of water quality data collection.
Year 1 Month Dates
1975 May 16,21,26,28,29 August 13,15,25 1976 May 13 June 9, 10 July 6, 7 November 16 1977 May 11, 12 June 5,7,8 July 11, 19 SeQtember 19 1979 July 4 1997 June 3,5,18 July 15,16 August 11,12,17 September 13,14,15 October 13 1998 June 17,18 July 30 August 11, 12, 13 September 2, 13 October 12 1999 June 9,21,22 July 12,27,28 August 16,19,29 September 1, 13,22 October 3,7,25,27,31 November 2 2000 July 6 August 14,15 September 7,24 October 29 1360 309 297 290 2041 144 123 92.9 51.4 50.4 45.5 33.0 SamQling Qerformed bï OOE OOE OOE OOE OOE DOE DOE DOE OOE OOE OOE ELG ELG, PWMG ELG PWMG PWMG ELG ELG ELG PWMG PWMG ELG ELG, PWMG PWMG ElG, PWMG PWMG PWMG PWMG ELG, PWMG PWMG PWMG
Table 3. Air temperature statistics from the Moncton Airport during the two periods of interest Month Statistics
1975
1976
April Minimum -5.9 -6.1 Maximum 7.8 11.7 Mean 1.2 3.9 May Minimum 2.0 4.7 Maximum 17.2 18.6 Mean 9.6 10.8 June Minimum 4.8 5.6 Maximum 23.9 23.1 Mean 15.5 16.6 July Minimum 13.9 12.8 Maximum 25.0 22.8 Mean 20.6 18.1 August Minimum 12.0 11.7 Maximum 23.9 26.1 Mean 17.7 18.0 September Minimum 7.9 5.9 Maximum 23.3 19.2 Mean 13.6 13.0 October Minimum -2.2 Maximum 16.7 Mean 6.7 November Minimum -6.7 Maximum 8.6 Mean -0.11977
1997
-6.7 14.3 2.6 1.4 4.2 22.4 15.6 9.5 9.0 9.7 6.6 20.1 23.4 14.19 14.1 13.0 13.0 24.2 24.2 18.3 18.3 13.8 13.3 25.0 23.3 17.9 17.7 6.5 5.8 18.5 20.3 11.9 13.8 0.1 15.4 5.6 211998
6.4 19.1 12.4 8.5 21.6 14.7 14.2 24.6 19.6 14.0 24.1 18.7 8.0 18.5 13.6 1.4 13.3 7.21999
2000 3.9 21.8 13.4 3.9 21.8 13.4 14.8 14.5 26.0 21.4 19.9 18.1 13.7 14.4 22.2 22.4 18.0 18.2 11.3 4.2 22.8 20.5 17.2 12.7 0.6 2.8 14.5 16.8 6.5 8.1Petltcodiac Wa.fetshed MOhitoring Group
Water Quality analysls
Table 4. Precipitation (mm) statistics from the Moncton airport, during the periods of interest. Month 1975 1976 April Rain 12.6 56.6 Snow 58.4 8.7 May Rain 107.2 89.3 Snow 2 9.3 June Rain 79.8 97.9 Snow 0 0 July Rain 81.9 73.9 Snow 0 0 August Rain 34.8 85.6 Snow 0 0 September Rain 129.1 80.4 Snow 0 0 October Rain 134.8 Snow 0 November Rain 68.2 Snow 3.3 Total Rain 425.6 427.1 Ma~-Seet 1977 1997 40.7 18.4 97.9 58.8 23 0 169 104.7 0 0 92.3 92.3 0 0 88.3 43.3 0 0 143.7 89.7 0 0 12.6 12.6 14.1 14.1 591.2 388.8 1998 98.3 0 51.5 0 49.3 0 114.7 0 112.1 0 224.6 0 425.9 1999
2000
29.7 0.4 32 0 100.4 68.6 0 0 120.5 0 0 0 231.8 76.2 0 0 88 147 2.8 0 514.4Table 5. Hydrologieal eharaeteristies of the Petiteodiac River
at
Causeway and Turtle Creek.Parameters
Drainage basin area (km2)
Median flow Mean annual flow Minimum daily discharge Maximum daily discharge
, From Caissie (2000)
2 Gauged area
Peticodiac
Flow statistics Equivalent (pro-rated specifie at Causeway) 1 discharge (m3/s) (m3/slkm2) 1360 11.9 0.009 27.3 0.020 0.36 0.0003 730 0.54 23 Turtle Creek Flow statistics 'L70 3.58 0.14 96.3 Equivalent specifie discharge (m3/s/km2) D.013 0.028 0.0011 0.75
Petitcodiac Watershed Monitoring Group Water Quality analysis
Table 6. Annual flow statistics, stations 01 BU002 (Petitcodiac) and 01 BU003 (Turtle Creek). Year 1961 1962 1963 1964 1965 1966 1967 1968 1969 1970 1971 1972 1973 1974 1975 1976 1977 1978 1979 1980 1981 1982 1983 1984 1985 1986 1987 1988 1989 1990 1991 1992 1993 1994 1995 1996 1997 1998 1999 2000 1961-Minimum 0.35 0.83 0.80 0.31 0.18 0.10 0.45 0.28 0.33 0.43 0.30 0.59 0.63 0.36 0.25 0.66 0.48 0.23 0.63 0.48 0.81 0.62 0.68 0.88 0.25 0.50 0.31 0.35 0.39 0.40 0.37 0.35 0.40 0.26 0.19 0.33 0.25 0.18 0.26 0.42 0.10 01 BU002 Mean Maximum 5.43 38.50 9.24 210.00 9.80 125.00 6.52 114.00 4.08 30.00 5.13 56.90 9.49 136.00 8.12 106.00 5.82 65.10 5.72 75.60 7.89 88.90 9.49 106.00 9.24 86.90 8.46 91.50 8.17 101.00 9.73 119.00 10.36 78.70 6.34 75.90 13.62 113.00 7.74 63.70 11.71 91.90 8.00 80.00 7.19 83.60 9.22 80.40 4.19 40.60 6.70 73.00 5.73 115.00 6.17 105.00 4.66 72.70 10.57 101.00 8.46 65.50 7.20 94.00 8.82 57.20 7.69 88.20 5.76 40.50 8.74 73.20 6.61 68.50 8.55 118.00 8.83 120.00 7.41 64.10 7.86 210 01 BU003
Mean at Minimum Mean Maximum
causeway1 18.90 32.14 0.58 4.38 30.60 34.10 0.29 4.97 76.70 22.68 0.31 2.80 73.90 14.19 0.25 1.80 13.80 17.84 0.30 2.39 19.60 33.02 0.28 4.28 42.20 28.25 0.22 3.84 30.60 20.25 0.50 3.75 58.30 19.91 0.43 3.23 59.20 27.43 0.28 3.83 37.40 33.00 0.40 5.04 47.90 32.15 0.50 3.78 26.50 29.42 0.32 3.27 41.60 28.41 0.39 4.20 48.70 33.84 0.52 3.85 28.30 36.03 0.35 4.47 41.30 22.04 0.23 2.55 22.60 47.38 0.44 5.11 37.10 26.92 0.40 3.17 33.10 40.73 0.35 5.12 46.70 27.82 0.51 3.31 45.20 25.02 0.40 3.54 34.10 32.06 0.34 3.99 39.30 14.57 0.25 2.60 28.20 23.30 0.32 2.61 20.50 19.94 0.20 2.94 41.10 21.46 0.28 3.53 44.30 16.20 0.22 1.83 26.90 36.77 0.35 4.95 37.30 29.44 0.14 3.62 35.40 25.05 0.25 2.55 24.50 30.66 0.31 4.15 31.90 26.76 0.28 3.39 37.90 20.05 0.22 3.17 24.00 30.41 0.38 4.78 55.10 22.98 0.29 2.38 29.20 29.74 0.34 4.60 96.30 30.70 0.23 3.46 64.50 25.78 0.21 2.64 26.20 27.33 0.143 3.57 96.30
Table 7. Flow duration analysis (using daily discharge in m3/s, from 1962-2000) and mean monthly flows for Turtle Creek.
Percentage(%) , Jan Feb Mar Apr May Jun Jul Aug Sep Oct Nov Dec
0 55.1 59.2 91.8 49.8 66.0 28.2 31.1 12.7 64.5 46.5 96.3 9.11 10 4.84 5.20 10.80 19.50 15.70 4.67 2.23 1.33 1.18 4.67 8.35 73.90 20 3.10 3.14 6.80 14.20 10.20 3.31 1.51 0.95 0.85 2.83 5.52 6.17 30 2.50 2.42 4.73 11.50 7.50 2.62 1.14 0.70 0.67 1.87 4.08 4.56 40 2.09 1.89 3.55 9.57 5.97 2.13 0.94 0.59 0.56 1.26 3.17 3.11 50 1.79 1.53 2.80 7.93 4.98 1.77 0.81 0.51 0.48 0.93 2.28 2.44 60 1.50 1.28 2.14 6.87 4.21 1.49 0.71 0.45 0.42 0.72 1.71 1.95 70 1.19 1.05 1.58 5.72 3.57 1.27 0.63 0.41 0.38 0.57 1.30 1.54 80 0.91 0.85 1.10 4.64 2.96 1.10 0.54 0.37 0.34 0.40 0.91 1.18 90 0.69 0.65 0.84 3.55 2.20 0.92 0.46 0.33 0.29 0.32 0.58 0.60 100 0.31 0.09 0.32 1.25 0.91 0.33 0.14 0.18 0.20 0.25 0.30 0.23
Mean menthly flews 2.67 2.59 4.68 10.06 7.43 2.47 1.23 0.77 0.79 2.07 3.93 4.34
1 Percentage
=
percentage of time equalled or exceededTable
8.
Flow duration analysis (using daily discharge in m3/s, from 1961-2000) and mean monthly flows for the Petitcodiac Riverat
the Causeway1.
Percentage(%)2 Jan Feb Mar Apr May Jun Jul Aug Sep Oct Nov Dec
0 414 286 383 730 473 228 302 173 211 320 369 351 10 31.5 37.5 91.8 178 106 40.5 23.9 15.1 17.4 41.6 66 71.3 20 21.4 21.2 50.4 129 61 24.5 14.2 9.5 8.6 26.4 41.9 40.7 30 16.4 14.1 33.4 98.6 45.3 17.5 9.9 6.3 6 16.9 30.3 28.4 40 12.9 10.7 23.9 78.1 36.2 13.4 7.4 4.2 4.3 10.8 23.4 21.1 50 10.7 8.5 17.1 63.9 29.7 10.7 5.6 3.2 3.3 7.2 11.9 16.7 60 9 7.1 13 53.2 25.2 8.8 4.2 2.6 2.7 5.2 13.S 13.6 70 7.5 5.9 9.4 43.6 20.2 1.5 3.2 2.1 2 3.6 10.1 10.7 80 6.1 4.9 6.2 34 16.4 5.8 2.6 1.6 1.6 2.6 6.4 7.8 90 3.6 3.3 4.3 27.3 12.4 4.3 1.8 1.3 1.2 1.7 4 4.1 100 1.7 1.5 1.4 6.6 3.8 2.1 0.79 0.36 0.36 0.71 1.23 0.81
Mean manthly flaws 18.2 17.0 36.2 85.2 46.5 18.8 12.7 7.68 7.1 18.4 29 30.6
'from Caissie (2000)
2percentage
=
percentage of tlme equalled or exceeded25 Petitcodiac WâtèfstièèJ MoHltotlng Group
Table 9. Flood Frequency analysis of Turtle Creek and the Petitcodiac River (at Causeway) using different statistical distributions. Floods shown in m3/s. Turtle Creek LN3 Gumbel LP3 Petitcodiac at Causeway1 LN3 Gumbel LP3 1 From Caissie (2000) 2 36.7 37.1 36.6 2 294 290 287 5 51.5 52.2 51.4 5 391 393 383
Recurrence Interval (years)
10 61.5 62.2 61.6 20 71.4 71.7 71.7
Recurrence Interval (years)
10 449 461 448 20 503 526 512 50 84.5 84.1 85.2 50 569 610 596 100 94.5 93.4 95.7 100 617 673 661
Table 10. Low-flow Frequencyanalysis of Turtle Creek and the Petitcodiac River (at Causeway) using different statistical
distributions. Flows shown in m3ls.
Turtle Creek Recurrence Interval (years)
1962-1983
2 5 10 20
T3E 0.374 0.256 0.184 0.119
Turtle Creek Recurrence Interval (years)
1984-2000
2
5 10 20T3E 0.277 0.191 0.135 0.082
Petitcodiac Recurrence Interval (years)
at Causeway1 2 5 10 20 T3E 1.43 0.897 0.678 0.536 1 From Caissie (2000) 50 0.041 50 0.016 50 100 0.414 0.355
Table
11.
Mean, flood and low flows (m3/s) for sub-basins of the Petitcodiac watershed, pro-rated from stations 01 BU002 and 01BU003.Mean 2 year Flood 10 year flood 100 year flood
annual discharge
Reference station 01 BU002 01 BU003 01 BU002 01 BU003 01 BU002 01 BU003 01 BU002 01 BU003
Pollett 6.20 8.65 65.96 87.91 102.86 147.31 147.75 226.36 Little 5.96 8.32 63.40 84.50 98.86 141.59 142.01 217.57 North 5.82 8.12 61.90 82.50 96.53 138.26 138.67 212.44 Anagance 2.89 4.03 30.74 40.97 47.93 68.65 68.86 105.49 Halls Creek' 2.47 3.44 26.26 34.99 40.94 58.64 58.81 90.10 Weldon Creek 1.86 2.60 19.83 26.43 30.92 44.29 44.42 68.05 Mill Creek 1.03 1.44 10.97 14.62 17.11 24.50 24.58 37.65 Jonathan Creek 1.01 1.41 10.76 14.34 16.78 24.03 24.10 36.92 Bennett Brook 0.91 1.27 9.71 12.94 15.15 21.69 21.76 33.33 Fox Creek 0.66 0.92 7.04 9.39 10.98 15.73 15.78 24.17
2-year low flow 10-year low flow
Reference station 01 BU002 01 BU003 01 BU003 01BU002 01BU003 01BU003
1962-1983 1984-2000 1962-1983 1984-2000 Pollett 0.32 0.90 0.66 0.15 0.44 0.32 Little 0.31 0.86 0.64 0.15 0.42 0.31 North 0.30 0.84 0.62 0.14 0.41 0.30 Anagance 0.15 0.42 0.31 0.07 0.21 0.15 Halls Creek 0.13 0.36 0.26 0.06 0.18 0.13 Weldon Creek 0.10 0.27 0.20 0.05 0.13 0.10 Mill Creek 0.05 0.15 0.11 0.03 0.07 0.05 Jonathan Creek 0.05 0.15 0.11 0.03 0.07 0.05 Bennett Brook 0.05 0.13 0,10 0.02 0.06 0.05 Fox Creek 0.03 0.10 0.07 0.02 0.05 0.03
'Including Humphrey Brook
. ~,---"--- "'""
27 Petitcodiac Watershed Monitoring Group Water Quality analysis
Table 12. Water quality results - Descriptive statistics
Statistics AI Alkalinity As BOO Ca Cd CI Colour Conductivity mg/L mg/L pg/L mg/L mg/L pg/L mg/L TCU pSIE/cm Minimum 0.0005 0.3 0.05 10.5 2.0 0.05 1.4 0.0 23 Percentile 5% 0.0109 8.5 0.05 10.5 3.8 0.05 2.4 5.0 41 Percentile 25% 0.0260 22.4 0.05 10.5 9.1 0.05 10.5 20.0 109 Median 0.0687 38.6 0.05 10.5 23.4 0.05 33.8 40.0 263 Mean 0.1556 43.7 0.76 10.5 27.7 0.13 66.9 59.6 412 Percentile 75 % 0.1510 62.7 1.21 10.5 37.9 0.05 69.5 60.0 441 Percentile 95 % 0.5458 94.8 2.74 10.5 71.2 0.05 158.0 150.0 871 Maximum 5.1000 144.0 10.60 10.5 175.0 5.005707.05000.0 22700 Count
565
628 566
1577 575
566
599
597
CWQG 0.100 5.0 .0.017 Cr Cu DO Client-fld pg/L pg/L mg/L 0.25 0.25 0.5 0.25 0.25 6.7 0.80 0.50 8.8 1.60 1.00 9.9 2.10 1.74 9.9 3.10 1.95 11.0 5.30 5.30 13.0 11.4 60.0 19.0566 575
275
1-8,9 5.5Table 12 (continued). WATER QUALITY RESULTS-Descriptive statistics
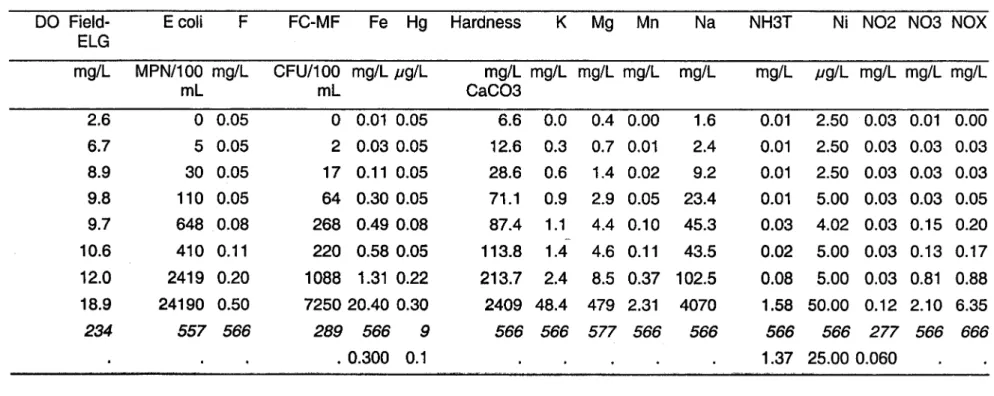
DO Field- Ecoli F FC-MF Fe Hg Hardness K Mg Mn
ELG mg/L M PN/1 00 mg/L CFU/100 mg/L ,ug/L mg/L mg/L mg/L mg/L mL mL CaC03 2.6 0 0.05 0 0.01 0.05 6.6 0.0 0.4 0.00 6.7 5 0.05 2 0.03 0.05 12.6 0.3 0.7 0.01 8.9 30 0.05 17 0.11 0.05 28.6 0.6 1.4 0.02 9.8 110 0.05 64 0.30 0.05 71.1 0.9 2.9 0.05 9.7 648 0.08 268 0.49 0.08 87.4 1.1 4.4 0.10 -10.6 410 0.11 220 0.58 0.05 113.8 1.4 4.6 0.11 12.0 2419 0.20 1088 1.31 0.22 213.7 2.4 8.5 0.37 18.9 24190 0.50 7250 20.40 0.30 2409 48.4 479 2.31
234
557 566
289 566
9
566 566 577 566
.0.300 0.1 29 Na NH3T Ni N02 N03 NOX mg/L mg/L ,ug/L mg/L mg/L mg/L 1.6 0.01 2.50 0.03 0.01 0.00 2.4 0.01 2.50 0.03 0.03 0.03 9.2 0.01 2.50 0.03 0.03 0.03 23.4 0.01 5.00 0.03 0.03 0.05 45.3 0.03 4.02 0.03 0.15 0.20 43.5 0.02 5.00 0.03 0.13 0.17 102.5 0.08 5.00 0.03 0.81 0.88 4070 1.58 50.00 0.12 2.10 6.35566
566
566 277 566 666
1.37 25.000.060Petitcodiac Watershed MonitOring Group Water Quality analysis
Table 12 (continued). WATER QUALITY RESUL TS-Descriptive statistics
Statistics Pb pH pH Sb S04 SS Total TOS TEMP Client- TEMP Field- TKN TOC
field lab coliforms fld ElG
pg/l pg/l mg/l mg/l MPN/100 ml mg/l QC QC mg/l mg/l N Minimum 0.50 5.8 4.4 0.50 1.27 0.0 69 12.7 4.0 0.5 0.01 0.50 Percentile 5% 0.50 6.3 6.7 0.50 2.6 0.0 401 21.6 6.0 2.9 0.10 1.63 Percentile 25% 0.50 6.9 7.3 0.50 4.9 1.3 1083 68.5 10.0 13.6 0.22 4.30 Median 0.50 7.5 7.7 0.50 14.20 7.5 2419 155.7 13.0 17.0 0.36 7.20 Mean 1.48 7.3 7.6 0.70 38.63 72.0 3430 186.6 13.1 16.5 0.44 8.17 Percentile 75 % 0.50 7.8 8.0 0.50 49.7 7.5 2419 230.4 16.6 20.5 0.50 11.20 Percentile 95 % 2.00 8.0 8.3 0.50 155.8 41.1 15530 482.4 21.0 25.4 0.90 17.2 Maximum 50.00 8.5 9.2 34.20 813.00 28000.0 36550 1425.3 25.0 28.5 19.0 31.7 Count
575
110663 566
566
cwaG 1.00 6.5 6.5566
289
250256
357
665
566
P04 mg/l 0.00 0.00 0.01 0.02 0.10 0.04 0.26 12.8665
Table
12
(continued). WATER QUALITY RESUL TS-Descriptive statistics Statistics TURS Zn NTU Jlg/L Minimum 0.0 2.50 Percentile 5% 0.00 2.50 Percentile 25% 0.6 2.50 Median 1.5 5.00 Mean 4.9 11.9 Percentile 75 % 4.1 11.0 Percentile 95 % 20.6 38.3 Maximum 172.0 906.0 Count 578 575 CWQG 3031 Petitcodiac Watershed Monitoring Group
Table
13.
Comparison of water quality datato
the Canadian Water Quality Guidelines~ by period.Parameter Unit CWQ
Guideline Total number of measure-ments AI mg/L 0,1 0 As pg/L 5 0 Cd pg/L 0,017 9 [3] Cr pg/L 1 [2] 0
DO
mg/L 5,5 62 Fe mg/L 0,3 0 Hg pg/L 0,1 9 NH3T mg/L 1,37 0 Ni pg/L 25 0 N02 mg/L 0,06 0 Pb pg/L 1 9 [4] PH 6,5 97 Zn pg/L 30 9(1] for DO and pH, values below acceptable range
121 based on the guldeline for hexavalent chromium (Cr VI)
1975-1979 1997-2000
Values above CWQG [1] Total number Values above CWQG [1] Count Frequency of measure-ments Count Frequency
0 554 210 38% 0 566 6 1% 0 566 5 1% 0 566 381 [2] 67% [2] 0 0% 447 11 2% 0 566 283 50% 1 11% 0 0 0 566 1 0% 0 566 2 0% 0 277 3 1% 0 566 48 8% 5 5% 566 11 2% 9 100% 553 23 4%
(3] ail values below detection limit of 10 pg/L
Table
14.
Cluster analysis based on inorganic parameters. Average values of water quality parameters, by cluster (means and standard deviation).Cluster # INORG1
Number of waterbodies in 17
cluster
STATISTICS Mean Std Dev
AI (mg/L) 0,14 0,10 Alkalinity (mglL) 44,4 24,6 Ca (mg/L) 25,3 19,4 Cd (pg/L) 0,05 0,01 CI (mg/L) 56,4 78,8 Conductivity (pSIE/cm) 337 346 Cr (pg/L) 2,08 1,10 Cu (J1g/L) 1,55 1,31 F (mg/L) 0,08 0,03 Fe (mg/L) 0,49 0,37 Hardness (mg/L CaC03) 76,4 55,8 K (mg/L) 1,05 0,52 Mg (mg/L) 3,31 2,06 Mn (mg/L) 0,15 0,17 Na (mg/L) 37,6 54,2 Pb (J1g/L) 0,65 0,30 PH 7,7 0,3 S04 (mglL) 30,1 46,8 Zn (pg/L) 9,4 3,9 33 INORG2 INORG3 Mean 0,30 22,1 21,1 0,06 538,4 1720 1,51 3,66 0,10 1,93 227,0 4,43 42,32 0,10 374,4 0,76 7,1 76,1 71,7 1 1
StdDev Mean StdDev
0,73 53,5 23,4 0,08 63,2 343 2,78 4,33 0,17 1,70 74,S 2,08 3,90 0,28 39,9 3,89 7,8 14,5 19,2
Petitcodiac Walershed Monitoring Group Water Quality analysis
Table 15. Cluster analysis based on organic and nutrient parameters. Average values of
water quality parameters, by cluster (means and standard deviation).
Cluster # ORG1
Number of waterbodies in 12 cluster
STATISTICS Mean Std. Dev.
Colour (TCU) 30,S 17,6 E coli (MPN/100 ml) 245 185 NH3T (mg/l) 0,02 0,02 N03 (mg/l) 0,08 0,10 TKN (mg/l as N) 0,26 0,12 TOC (mg/l) 5,6 3,0 P04 (mgll P04) 0,01 0,01 Mean 68,6 3292 0,01 0,98 0,49 5,6 0,04 ORG2 ORG3 2 5
Std. Dev. Mean Std.Dev.
16,9 106,4 12,7 1531 184 762 0,07 0,05 0,02 0,30 0,13 0,12 0,15 0,64 0,13 0,6 14,0 2,9 0,03 0,06 0,03
Table 16. Cluster analysis based on inorganic parameters. List of waterbodies by cluster. Cluster # INORG1 INORG2 INORG3 Waterbody Anagance River Bennett Brook Fox Creek Halls Creek Humphreys Brook Jonathan Creek Little River Mill Creek
North Branch Halls Creek North River Petitcodiac River Pollett River Prosser Brook Rabbit Brook Turtle Creek Weldon Creek
West Branch Halls Creek Memramcook River
Jones Lake
35 Petitcodiac Watershed Monitoring Group Water Quality analysis
Table 17. Clusfer analysis based on organic and nufrienf paramefers. List of waterbodies by clusfer. Cluster # ORG1 ORG2 ORG3 Water body Anagance River Bennett Brook HalisCreek Jonathan Creek Little River
North Branch Halls Creek North River Petitcodiac River Pollett River Prosser Brook Turtle Creek Weldon Creek Rabbit Brook
West Branch Halls Creek Fox Creek
Humphreys Brook Jones Lake
Memramcook River Mill Creek
1
-'"
• Water quality sampling sites • Hydrometrie stations
o 15
16.00 14.00 12.00 10.00
-.!!! C") E 6.00 -:= oC ,cp Q 6.00 4.00 2.00 0.00 i -III (0 al....
-,V
~"
"""'
L...o/~~
r-..
~h
Année CV) CIO al....
~
~ III ~....
-~--o
Mean 01 BU003 • Mean 01 BU002 ~- ---._._---_. ._._-_._-_._---~ .~--"1
IV
1'0."
l -al CIO al...
1; ~..(~
~ ... III al al....
l-Figure
2.
Mean annual discharge
at
stations 01 BU002 and stations 01 SUÔ03. Llnes
-,.--.
_.~---~-
a)
1 :
~i~tf~i~-~~-R~--·-f - P r o s s e r Br<>c>k l - \A/el d o n C r e e k 1 - P o l l e t t R.. . - F o x C r e e k - , u r t l e C r e e k~~~~~~~~~~~~~~~~~~~~::~:
! - H U r Y l p h r e y s B r o o k - H a l l s Cre~k - , J o n a t h a n C r e - e k - N o r t h B r a n c : h H a l l s C r e e k - V V e s t B r a n c h H a l l s C r e e k - N o r t h R_ - P e t i t c o c : l i a c R. - l\IIill c:::reek - R a b b i t . BrC>CJk - B e n n e t t Br<:>ok - ..Jones L a k e - f\./]~f"'l,ra'-T.c.::ot:.:)k b) <>.~
..
~
..
~~~
..
~
__
.e.-~
J
----
..
-
..
---~==~..
~~..
~~..
~~..
~==~..
~~..
~~.~.~~~~=======================================Figure 3. Results of cluster analysis based