Non-destructive quality control of carbon
anodes using modal analysis,
acousto-ultrasonic and latent variable methods
Thèse
Moez Ben Boubaker
Doctorat en génie chimique
Philosophiæ doctor (Ph. D.)
Québec, Canada
iii
Résumé
La performance des cuves d’électrolyse utilisées dans la production d’aluminium primaire par le procédé Hall-Héroult est fortement influencée par la qualité des anodes de carbone. Celles-ci sont de plus en plus variables en raison de la qualité décroissante des matières premières (coke et braie) et des changements de fournisseurs qui deviennent de plus en plus fréquents afin de réduire le coût d’achat et de rencontrer les spécifications des usines. En effet, les défauts des anodes, tels les fissures, les pores et les hétérogénéités, causés par cette variabilité, doivent être détectés le plus tôt possible afin d’éviter d’utiliser des anodes défectueuses dans les cuves et/ou d’apporter des ajustements au niveau du procédé de fabrication des anodes. Cependant, les fabricants d’anodes ne sont pas préparés pour réagir à cette situation afin de maintenir une qualité d'anode stable. Par conséquent, il devient prioritaire de développer des techniques permettant d’inspecter le volume complet de chaque anode individuelle afin d’améliorer le contrôle de la qualité des anodes et de compenser la variabilité provenant des matières premières.
Un système d’inspection basé sur les techniques d’analyse modale et d’acousto-ultrasonique est proposé pour contrôler la qualité des anodes de manière rapide et non destructive. Les données massives (modes de vibration et signaux acoustiques) ont été analysées à l'aide de méthodes statistiques à variables latentes, telles que l'Analyse en Composantes Principales (ACP) et la Projection sur les Structures Latentes (PSL), afin de regrouper les anodes testées en fonction de leurs signatures vibratoires et acousto-ultrasoniques. Le système d'inspection a été premièrement investigué sur des tranches d'anodes industrielles et ensuite testé sur plusieurs anodes pleine grandeur produites sous différentes conditions à l’usine de Alcoa Deschambault au Québec (ADQ). La méthode proposée a permis de distinguer les anodes saines de celles contenant des défauts ainsi que d’identifier le type et la sévérité des défauts, et de les localiser.
La méthode acousto-ultrasonique a été validée qualitativement par la tomographie à rayon-X, pour les analyses des tranches d’anodes. Pour les tests réalisés sur les blocs d’anode, la validation a été réalisée au moyen de photos recueillies après avoir coupé certaines anodes parmi celles testées.
v
Abstract
The performance of the Hall-Héroult electrolysis reduction process used for the industrial aluminium smelting is strongly influenced by the quality of carbon anodes, particularly by the presence of defects in their internal structure, such as cracks, pores and heterogeneities. This is partly due to the decreasing quality and increasing variability of the raw materials available on the market as well as the frequent suppliers changes made in order to meet the smelter’s specifications and to reduce purchasing costs. However, the anode producers are not prepared to cope with these variations and in order to maintain consistent anode quality. Consequently, it becomes a priority to develop alternative methods for inspecting each anode block to improve quality control and maintain consistent anode quality in spite of the variability of incoming raw materials.
A rapid and non-destructive inspection system for anode quality control is proposed based on modal analysis and acousto-ultrasonic techniques. The large set of vibration and acousto-ultrasonic data collected from baked anode materials was analyzed using multivariate latent variable methods, such as Principal Component Analysis (PCA) and Partial Least Squares (PLS), in order to cluster the tested anodes based on vibration and their acousto-ultrasonic signatures. The inspection system was investigated first using slices collected from industrial anodes and then on several full size anodes produced under different conditions at the Alcoa Deschambault in Québec (ADQ). It is shown that the proposed method allows discriminating defect-free anodes from those containing various types of defects. In addition, the acousto-ultrasonic features obtained in different frequency ranges were found to be sensitive to the defects severities and were able to locate them in anode blocks.
The acousto-ultrasonic method was validated qualitatively using X-ray computed tomography, when studying the anode slices. The results obtained on the full size anode blocks were validated by means of images collected after cutting some tested anodes.
vii
Table of contents
Résumé ... iii
Abstract ... v
Table of contents ... vii
List of tables ... xi
List of figures ... xiii
Nomenclature ... xvii Acknowledgements ... xix Foreword ... xxi Chapter 1 Introduction ... 1 1.1 Aluminium production ... 2 1.2 Anode production ... 5
1.3 Factors affecting anode quality ... 8
1.3.1 Anode raw materials ... 8
1.3.2 Green anode manufacturing process ... 9
1.3.3 Anode baking process ... 11
1.4 Common anode defects ... 13
1.5 Problems ... 15
1.6 Methods for green and baked anode quality control ... 17
1.6.1 Empirical and numerical models for predicting anode properties ... 17
1.6.2 Machine vision techniques ... 18
1.6.3 Electrical resistivity measurements ... 18
1.7 Other relevant NDT techniques ... 21
1.7.1 Visual inspection ... 21
1.7.2 Electromagnetic or Eddy current testing ... 22
1.7.3 Ultrasound... 23 1.7.4 Acoustic emission ... 25 1.7.5 Vibration analysis ... 27 1.7.6 Radiography ... 28 1.7.7 X-rays tomography ... 29 1.7.8 Thermography ... 30
1.7.9 Synthesis and method selection ... 31
1.8 Objectives ... 33
viii
2.1 Introduction ... 37
2.2 Modal analysis ... 38
2.2.1 Principles of modal analysis ... 38
2.2.2 Types of excitation systems ... 38
2.2.3 Measurement tools ... 40
2.2.4 Numerical modal analysis ... 43
2.3 Acousto-ultrasonic ... 46
2.3.1 Principles of the method ... 46
2.3.2 Theory of mechanical wave propagation ... 47
2.3.3 Propagation modes ... 48
2.3.4 Wave propagation velocity ... 49
2.3.5 Excitation and acquisition ... 50
2.4 Signal analysis ... 51
2.4.1 Temporal approaches ... 51
2.4.2 Frequency approaches ... 55
2.4.3 Time-frequency approaches ... 59
2.5 Computed tomography method ... 61
2.5.1 Principle of the method ... 61
2.5.2 X-Ray computed tomography data acquisition ... 61
2.6 Image texture analysis ... 62
2.7 Latent variable methods ... 64
2.7.1 Principal Component Analysis (PCA) ... 65
2.7.2 Projection to latent structures (PLS) ... 66
2.7.3 Model interpretation tools ... 67
2.8 Anode parts and blocks ... 68
The potential of acousto-ultrasonic techniques for inspection of baked carbon anodes………..73
3.1 Introduction ... 75
3.2 Experimental ... 77
3.2.1 Acoustic Inspection System... 77
3.2.2 Baked Anode Samples ... 78
3.2.3 Acoustic Inspection Data Collection ... 80
3.3 Acoustic Signal Processing and Analysis ... 81
3.3.1 Acoustic Features Extraction ... 81
ix
3.4 Results and Discussion ... 83
3.5 Conclusion ... 88
Inspection of Prebaked Carbon Anodes using Multi-Spectral Acousto-Ultrasonic signals, Wavelet Analysis and Multivariate Statistical Methods ... 91
4.1 Introduction ... 93
4.2 Materials and experimental data acquisition ... 95
4.2.1 Baked anode samples and X-Ray CT-Scan imaging ... 95
4.2.2 Acousto-ultrasonic signal acquisition ... 96
4.3 Extraction of features from acoustic signals and X-ray images ... 98
4.3.1 Acousto-ultrasonic signals ... 98
4.3.2 X-ray image texture analysis ... 100
4.4 Multivariate statistical methods for analysis of the AU signal and image features... ... 102
4.4.1 Principal Component Analysis (PCA) ... 102
4.4.2 Partial Least Squares (PLS) regression ... 103
4.5 Results and discussion... 103
4.5.1 Texture analysis of X-ray images ... 104
4.5.2 Regression of X-ray image textural features on acousto-ultrasonic features…….. ... 107
4.6 Conclusion ... 110
Inspection of baked carbon anodes using a combination of multi-spectral acousto-ultrasonic techniques………113
5.1 Introduction ... 115
5.2 Materials and experimental set-up ... 117
5.3 Processing and analysis of acousto-ultrasonic signals ... 119
5.3.1 Acoustic attenuation features ... 121
5.3.2 Analysis of the acoustic features using PCA ... 123
5.4 Results and discussion... 124
5.4.1 Defect severity underneath stub holes ... 124
5.4.2 Effect of baking position ... 129
5.4.3 Assessment of the within anode variability ... 133
5.5 Conclusion ... 139
Non-destructive testing of baked anodes based on modal analysis and principal component analysis………..141
Résumé ... 141
x
6.1 Introduction ... 143
6.2 Materials and Methods ... 144
6.2.1 Selection of Industrial Anodes ... 144
6.2.2 Numerical Modeling ... 145
6.2.3 Excitation and Measurement Set-Up ... 147
6.3 Modal Analysis of the Vibration Signals ... 150
6.3.1 Mode identification and features calculation ... 150
6.3.2 Principal Component Analysis (PCA) ... 151
6.4 Results and Discussions ... 152
6.5 Pruning of the PCA model ... 156
6.6 Conclusion ... 157
Acknowledgement ... 158
Conclusion and recommendations ... 159
7.1 Conclusion ... 159
7.2 Original contributions ... 160
7.3 Recommendations for future work ... 163
Appendix 1 Similarity of the acousto-ultrasonic responses of the rods to those of their corresponding corridors ... 189
Appendix 2 Inspection of Prebaked Carbon Anodes using Multi-Spectral Acousto-Ultrasonic signals, Wavelet Analysis and Multivariate Statistical Methods: Additional results ... 193
Appendix 3 Attenuation maps of all tested anodes ... 205
xi
List of tables
Table 1-1 Chemical components and physical properties of baked anodes [30]. ... 7
Table 1-2 Degree of influence of the factors provoking common defects in anodes [74]. .. 15
Table 1-3 Main features of the widely used non-destructive testing methods used in the industry (Modified from [293] and [294]). ... 32
Table 2-1 Comparison of excitation methods (modified from [189]). ... 40
Table 2-2 Mechanical properties of different areas. ... 45
Table 2-3 The different evaluations of FRFs [336]. ... 57
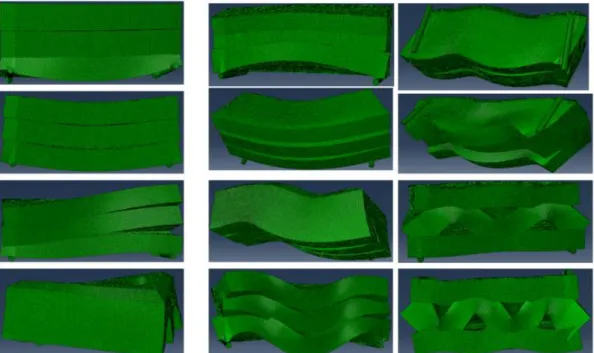
Table 2-4 Anode numbers and description. ... 70
Table 3-1 Percent cumulative sum of squares explained (R2) and predicted (Q2) by the principal component analysis (PCA) model built on attenuation features collected from ... 84
Table 4-1 Percent cumulative sum of squares explained (R2) and predicted (Q2) ... 104
Table 5-1 Anode numbers and description. ... 117
Table 5-2 Cumulative percent of the variance ... 125
Table 5-3 Cumulative percent of the variance ... 129
Table 5-4 Cumulative percent of the variance of Xw,L explained and predicted ... 134
Table 6-1 Anode numbers and description………...145
Table 6-2 Percent cumulative sum of squares explained (R2) by by the PCA model built on modal features collected from anodes………..152
Table A2-1 Percent cumulative sum of squares explained (R2) and predicted (Q2) by the PCA model built on textural features collected from corridor images. ... 195
xiii
List of figures
Figure 1-1 Representation of changes in the global primary aluminium production, energy consumption and electrical costs per ton of aluminium. The evolution of the LME
aluminium price is also presented. Sources: Naturel Resources Canada [1], London Metal
Exchange [2], USGS [3], I.E.A - Energy Prices and Taxes [4]. ... 1
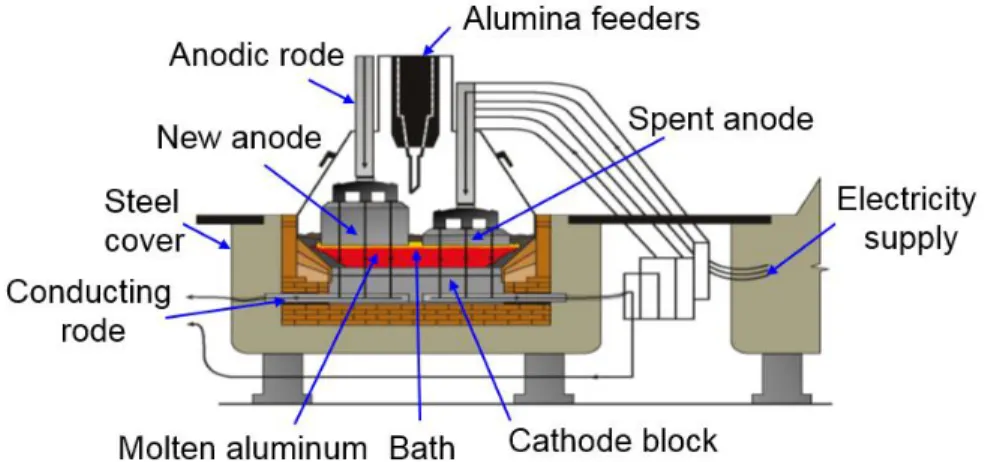
Figure 1-2 Cross section of a prebaked reduction cell technology (Courtesy of Alcoa). ... 3
Figure 1-3 Heat loss distributions in an electrolytic cell during operation [75]. ... 4
Figure 1-4 Anode consumption figures [43]. ... 5
Figure 1-5 Schematic of anode manufacturing process [19]. ... 6
Figure 1-6 Cracked carbon anode due to the thermal shock ... 13
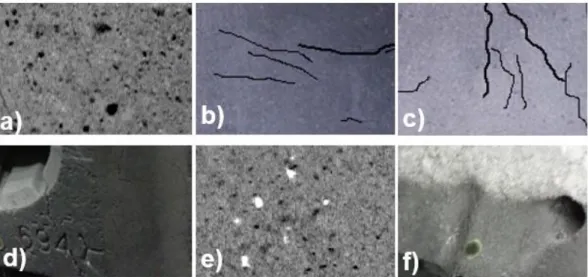
Figure 1-7 Common anode defects a) pore (inhomogeneity), b) horizontal cracks, c) vertical cracks, d) corner cracks, e) impurities, f) over baking. ... 14
Figure 1-8 Eddy current testing procedure [52]. ... 23
Figure 1-9 Schematic representation of Ultrasonic testing set-up (pulse-echo mode) [56]. ... 24
Figure 1-10 Typical mounting of acoustic emission testing [57]. ... 26
Figure 1-11 Typical vibration analysis set up with impact hammer [58]. ... 27
Figure 1-12 Radiography testing procedure [59]. ... 29
Figure 1-13 The experimental set-up for obtaining a CT-scan image [70]. ... 30
Figure 1-14 Experimental set-up used for IR thermography [71]... 31
Figure 1-15 Schematic of the quality control methodology for baked anodes. ... 35
Figure 2-1 Meshing of the anode. ... 44
Figure 2-2 Areas distribution for the allocation of suitable properties. ... 45
Figure 2-3 Example of the anode mode shapes. ... 45
Figure 2-4 Explanatory diagram of propagation [224]. ... 48
Figure 2-5 a) Longitudinal mode, b) Transversal mode, λ: Wavelength. U : Displacement vector.
n
: Direction of wave vector, [225]. ... 48Figure 2-6 Propagation velocity rates of the compression waves for the three basic matter phases [303]. ... 49
Figure 2-7 Sensors configurations [226]. ... 51
Figure 2-8 INRS-ETE Siemens Somatom Sensation 64 (Courtesy of INRS-ETE). ... 62
Figure 2-9 The appearance of the obtained images: left, 3D-image of... 62
Figure 2-10 Baked anode after slicing. ... 69
Figure 2-11 Preparation of six corridors after removing top and bottom. ... 69
Figure 2-12 Some examples of the selected anodes with various defects. ... 71
Figure 3-1 The acoustic inspection system. (1) multi-channel acoustic emission system, (2) acoustic sensors, (3) pre-amplifier, (4) AEwin™ software, (5) coupling gel. ... 77
Figure 3-2 The sliced baked anode. (a): The selected eight slices are identified in red; (b): Example of the seventh slice used for acoustic testing. ... 79
Figure 3-3 Example X-ray Computed Tomography (CT scan) image obtained for slice number 7. The 6 corridors within the slice are virtually divided by red lines and are identified by numbers 1-6. The black region correspond to one of the anode slot. ... 79
xiv
Figure 3-4 Acoustic data acquisition set up through different corridors of an anode slice. The corridors are identified by numbers in the figure. ... 80 Figure 3-5 Examples of raw acoustic signals acquired at different excitation frequencies. 81 Figure 3-6 The t1-t2 score plot of the principal component analysis (PCA) model ... 84
Figure 3-7 X-ray images showing the distribution of cracks and pores through different corridors for selected anode slices. ... 85 Figure 3-8 X-ray images showing a transversal section of the sliced anode. ... 86 Figure 3-9 The p1-p2 loading plot of the PCA model built on AU signal attenuation features.
MAX: maximum, STD: standard deviation, E: energy, RMS: root mean square, S: skewness, K: kurtosis. Numbers next to the feature names indicate the excitation
frequency (kHz). ... 87 Figure 4-1 The sliced baked anode. (a): the selected 8 slices are identified in red; (b): Example of a slices used for acousto-ultrasonic testing [309]. ... 96 Figure 4-2 Example X-ray Computed Tomography (CT Scan) image obtained for slice 7. The corridors are identified by the red lines and numbered from 1-6. The black region corresponds to one of the anode slots [309]. ... 96 Figure 4-3 The frequency modulated waveform used as the excitation signal. Both the time series (top) and the frequency content (bottom) of the signal are shown. ... 97 Figure 4-4 Example wavelet decomposition of an acoustic signal using 4 decomposition levels. The raw signal, the 4 wavelet detail signals as well as the residuals (approximation) are presented. ... 100 Figure 4-5 2D discrete wavelet decomposition of an X-ray image at 4 scales and in 3 directions. The wavelet sub-images are identified by the direction of analysis (h,v,d)
followed by the scale number (1-4). ... 102 Figure 4-6 Score plot of the PCA model (t1-t2) showing the clustering pattern of the
corridors in each slice based on their textural features extracted from X-ray images. Observations are identified by the slice number (red numbers in Fig. 1) followed by the corridor number (1-6). Different colors are used to distinguish the different corridors as shown in the anode slice image included in the figure. ... 105 Figure 4-7 Loading plot of the PCA model (p1-p2) built on image textural features (Y data).
The energy features are identified by letter “E” followed by the wavelet direction (H, V, or D), and scale number. ... 106 Figure 4-8 Score plot of the PLS model (t1-t2) between acoustic attenuation and X-ray
image textural features. Observations are identified by the slice number (red numbers in Fig. 1) followed by the corridor number (1-6). Different colors are used to distinguish the different corridors as shown in the anode slice image included in the figure. ... 108 Figure 4-9 Loadings bi-plot (w2*-c1 – w2*-c2) of the PLS model between acoustic attenuation
signals and X-ray image textural features. The features are identified by their names and by the scale at which they were calculated (1-4)... 109 Figure 4-10 X-ray images showing the distribution of cracks and pores in selected
corridors. ... 110 Figure 5-1 Experimental acousto-ultrasonic measurement set-up. ... 118 Figure 5-2 Location of the 29 excitation positions on each anode. ... 119 Figure 5-3 Examples of two raw acoustic signals with varying degree of attenuation. .... 120
xv
Figure 5-4 Signal processing and analysis framework. ... 121
Figure 5-5 PCA score plot (t1-t2) of the anode responses underneath the stub holes. ... 126
Figure 5-6 PCA loadings plot (p1-p2) for the anode responses underneath the stub holes. ... 127
Figure 5-7 Images of cuts made on some tested baked anodes. The anode number is indicated in the top left corner of each image. ... 128
Figure 5-8 Different baking positions; a) Top view of one furnace section, b) Side view of one pit. Positions 111, 222 and 333 correspond to the warmest (red), the intermediate (green), and the coldest (blue) regions in the furnace. ... 130
Figure 5-9 PCA score plot (t1-t2) obtained using the data collected for all excitation positions. The colors indicate the anode baking positions in the furnace (red: 111; green: 222; blue: 333; black: position unknown). ... 131
Figure 5-10 PCA model built using all excitation points. a) Plot of the loadings (p1-p2), b) map of signs of the p2 loadings on the anodes. ... 132
Figure 5-11 Pictures of the most severely damaged anodes, a) A3 and b) A7. ... 134
Figure 5-12 PCA score plot (t1-t2) showing the intra anode variability in the longitudinal direction (excitation points 22-29). ... 135
Figure 5-13 PCA loadings (p1-p2) capturing the intra anode variability in the longitudinal direction (excitation points 22-29). ... 136
Figure 5-14 Maps of the t1 score values associated with signal attenuation for anodes A3, A4, and A5. The color bar indicates the level of attenuation on relative scale, from low (dark blue) to high attenuation (dark red). ... 138
Figure 6-1 Example of anodes showing different types of defects………...145
Figure 6-2 Different tested supports configurations………147
Figure 6-3 The first two simulated vibration modes of the anode for the two cross bars configuration and excitation on the top……….147
Figure 6-4 Experimental mechanical vibration set-up………148
Figure 6-5 Position of the five excitation points (identified by numbers) on four different anode faces (E1-orange, E2-blue, E3-red, E4-green circles)………149
Figure 6-6 Position of the seven accelerometers (identified by numbers) for measuring the response of each corresponding excitation face (R1-orange, R2-blue, R3-red, and R4-green dots)……….149
Figure 6-7 The first two peaks of the power spectrum of 11 anodes obtained from one accelerometer after excitation on the top face……….150
Figure 6-8 PCA score plot (t1-t2) of the anode vibration responses………..153
Figure 6-9 PCA loadings (p1-p2) of the anode vibration responses………..154
Figure 6-10 Images of cuts made on some tested baked anodes………155
Figure 6-11 PCA score plot (t1-t2) after model pruning………157
Figure A1-1 An example of 6 rods cut of slice #21... 189
Figure A1-2 Acoustic data acquisition setup. ... 190
Figure A1-3 Cumulative variance explained (R2) and predicted (Q2) by the PCA model built on the acoustic responses of rods. ... 191
Figure A1-4 PCA scores plot of rods using sequential excitations (t1-t2). ... 192
xvi
Figure A2-2 Distribution of cracks and pores through different X-ray images of some
corridors. ... 194
Figure A2-3 Acoustic data acquisition set-up through different ... 195
Figure A2-4 Projection of the textural images features along the plane defined ... 196
Figure A2-5 Loading plot of the PCA model built on image textural features: ... 198
Figure A2-6 Analysis flowchart. ... 199
Figure A2-7 The t1-t2 score plot of the principal component analysis (PCA) model built on acousto-ultrasonic (AU) signal attenuation features. ... 200
Figure A2-8 p1-p2 loading plot of the PLS model built on AE signal attenuation features. 201 Figure A2-9 Loadings bi-plot (w*c1 – w*c2) of the PLS model between acoustic attenuation signals and X-ray image textural features. ... 202
Figure A3-1 Maps of the t1 score values associated with signal attenuation for all tested anodes. The color bar indicates the level of attenuation on relative scale, from low (dark blue) to high attenuation (dark red). ... 212
Figure A4-1 The first two peaks of the power spectrum of 11 anodes obtained from one accelerometer after excitation on the top face. ... 215
Figure A4-2 The first two peaks of the power spectrum of 11 anodes obtained from one accelerometer after excitation on the left face. ... 215
Figure A4-3 The first two peaks of the power spectrum of 11 anodes obtained from one accelerometer after excitation on the front face. ... 216
Figure A4- 4 Zooming of the left view responses with another excitation point (different from that of Figure A4-2). ... 216
xvii
Nomenclature
ADQ Alcoa Deschambault Quebec
AE Acoustic emission
Al Aluminium
AU Acousto-ultrasonic
CAD Computed-aided design
CCD Charge-coupled device
Coif Coiflet
CT Computed tomography
CT-Scan Computed tomography scan
CV Cross-validation
CWT Continuous wavelet transform
Db Daubechies
DEM Discrete element method
DFT Discrete Fourier transform
DWT Discrete wavelet transform
E Energy
FEM Finite element method
fn Natural frequency
FRF Frequency response function
FFT Fast Fourier transform
FT Fourier transform
GLCM Gray-level co-occurrence matrix
IR Infrared
IRT Infrared thermography
K Kurtosis
LV Latent variable
MA Modal analysis
MAX Maximum
MLR Multiple linear regression
MIA Multivariate image analysis
MIREA Mesure Instantanée de la Résistivité Électrique Anodique
MSC Mauricie Sowing Center
NDT Non-destructive testing
NDE Non-destructive evaluation
PAC Physical acoustic corporation
PCA Principal component analysis
PLS Projection to latent structures/partial least squares
RMS Root mean squares
RTA Rio Tinto Alcan
RGB Red Green Blue
S Skewness
SMB-PLS Sequential multi-block-PLS
STD Standard deviation
Sym Symlet
UT Ultrasonic testing
VBD Vibrated bulk density
Voxel Volumetric pixel
xviii
xix
Acknowledgements
و ةلاصلاو لله دمحلاو الله مسب لا
نيدلا موي لاإ ناسحإب مهعبت نمو هلسر ىلع ملاس
Here comes the moment of thanks. A daunting but essential task to express my deep respect and gratitude to the people who contributed to the completion of this PhD. I hope not to forget anyone.
This work was carried out within the Departments of Chemical, Mechanical and Civil Engineering at Laval University, and more precisely within laboratories: REGAL, structures and concrete (saw room). It was funded by Alcoa, Fonds de recherche du Québec–Nature et technologies (FRQNT), Aluminium Research Centre – REGAL, NSERC and Laval University.
I would like first to thank my supervisor, Professor Carl Duchesne for his availability, confidence, support, guidance and opportunities that strongly participate in the success of this project. Professor Houshang Alamdari of the department of mining, metallurgical and materials engineering, co-supervisor of this thesis, for his precious ideas, comments, suggestions and guidance all along my project. Prof. Mario Fafard of the department of civil and water engineering for his technical support. Dr. Jayson Tessier, my industry co-supervisor, for his professionalism, participation through all the industrial tasks as well as through the different coordination with Alcoa. Dr. Donald Picard and Dr. Hicham Chaouki, for their enthusiasm, dedications and respective knowledge of experimentation and modeling that have been profitable for the experimental set-up development as well as for the planning and execution of the experiments. Be assured of my great esteem and friendship.
My sincere thanks also go to the technicians and engineers who helped me during this PhD. Special thanks to Guillaume Gauvin, the man of “difficult missions”, who is always striving to overcome the industrial/academic coordination challenges, and who stayed with me during the majority of the laborious experimental tasks. I especially appreciate the availability, collaboration and technical assistance in the laboratory of my dear Sirs: Hugues Ferland, Pierre-André Tremblay, Mathieu Thomassin-Maillot, and Martin Lapointe. Finally, I would also like to thank the students and trainees, with whom I shared the laboratories, for their patience and tolerance vis-à-vis the cluttering of the place and the uncomfortable conditions caused by our big block of carbon. My thanks also go to my colleagues in the
xx
office Kamran, Julien, Pierre-Marc, Massoud, Amélie, Wilinthon, Corinne, Alexandre, Jean-Pascal, Thierry, Mathias, Juliette, Karl, Simon, Shahab, Véronique and Adéline. All the moments shared and enjoyed together were profoundly appreciated.
I would like to thank all my fellow students at the Engineering schools and training centers, especially those we spent a lot of time together as volunteers in the associative framework. I will keep a wonderful memory of the fruitful scientific and human exchanges and the exciting discussions I had during breaks with all of you my friends.
In conclusion, I express my profound gratitude to my family for their unconditional encouragement and support. Especially my mom, dad, sisters and my wife, I could not have completed a Ph.D., raise our beautiful daughter “Sarah”, succeed several social and other projects and still have a normal life without you. To all my friends, with whom, I had the opportunities to live the best moments of my life and I would like to have new opportunities with.
xxi
Foreword
This thesis consists of seven chapters and four appendices. In the first chapter, the recent progresses in anode quality control as well as non-destructive methods applied to the inspection of anode materials are described. In addition, the possible defects that may occur in the anodes and the different techniques that may be used to detect those are discussed and compared in order to select the best candidates. The second chapter focuses on the methods used in this thesis. The principles of modal analysis and acousto-ultrasonic are presented first, followed by the signal and image analysis methods, the numerical modal analysis, and a background on the multivariate latent variable methods. Chapters 3 to 6 consist of the four articles published or to be published in international scientific journals. The last chapter contains general conclusions, a discussion of industrial benefits, and recommendations for future work. The following subsections explain the contributions of each article in the field as well as the contribution of the candidate to each article.
Chapter 3:
The sensitivity of the acousto-ultrasonic signals to the various defects present in carbon anode materials is investigated in this chapter. This mainly concerns the detection and identification of internal defects like pores and cracks using the attenuation of the mechanical waves propagating through the material. The investigation was conducted on slices cut from a full-size baked anode. Each slice was virtually subdivided into 6 vertical corridors. The set of so-called corridors were excited by an acoustic (mechanical) wave at a given frequency and its response (attenuated wave) was recorded. This process was repeated sequentially using 7 different excitation frequencies. A method was proposed to process the acousto-ultrasonic response signals obtained from various anode slices in order to extract a large set of potentially relevant acoustic features representing the material’s attenuation behavior. The approach used in this research was to compute as many features as possible to capture all aspects of the material response. Since the large number of features were highly collinear, multivariate statistical methods were used for analyzing them. Pruning of the set of features in order to simplify the analysis was not considered in this thesis, but should be examined in future work to simplify the practical application of the method. The presence of defects inside different parts and their identification was therefore
xxii
revealed by applying Principal Component Analysis (PCA) to the matrix of acoustic features, and by analyzing the clustering patterns of 6 different subsections (called corridors) within each anode slice. The acoustic features were found to be sensitive to the presence of cracks and pores within the materials and were able to discriminate between them. These results were validated qualitatively using images of X-ray computed tomography that revealed the internal morphology of each anode slice included in this work.
This work published in:
- M. Ben Boubaker, D. Picard, J. Tessier, H. Alamdari, M. Fafard, C. Duchesne, The Potential of Acousto-Ultrasonic Techniques for Inspection of Baked Carbon Anodes, Metals, Vol. 6 (7), 151, 2016, 1-13.
Some of the results were also presented in:
- M. Ben Boubaker, D. Picard, J. Tessier, H. Alamdari, M. Fafard, C. Duchesne, Inspection of baked carbon anodes using acoustic techniques, Proceedings of 33rd International
ICSOBA Conference, Dubai, UAE, 2015, 467–476.
It is necessary to mention that the slices preparation including anode slicing and X-ray imaging was led by Dr. Donald Picard (Research assistant) to meet the objectives of another research project. The remaining slices were used in this PhD project. I carried out the ordering of missing equipment, cutting of additional slices, experimental set-up preparation, acousto-ultrasonic testing, signal analysis and features extraction by writing the necessary MATLAB codes. I also performed X-ray images preprocessing, and applied multivariate latent variable methods for data analysis. Finally, I wrote the first draft of the manuscript and corrected it under the guidance of my supervisors.
Chapter 4:
This chapter presents an improved acousto-ultrasonic method for testing the materials and analyzing their response in a more efficient way. Instead of exciting the materials sequentially at different frequencies, a single multi-spectral excitation signal was investigated as a mean of reducing the time required for inspecting each anode. The frequency modulated excitation signal spanned the same frequency range as that used in
xxiii the work reported in Chapter 3. Since the new excitation signal results in a more complex attenuation response (also containing several frequencies), the method for processing and analyzing the attenuation signals also required some modifications. Instead of computing acoustic features directly from the attenuated signal (as in Chapter 3), the latter was first decomposed into 4 different frequency bands using the 1D Discrete Wavelet Transform (DWT), followed by calculation of the acoustic features from each wavelet sub-signal (i.e., filtered signal in each frequency band). This new approach was applied on the same anode slices and corridors as described in Chapter 3. In addition to this, it was desired to build relationships between the CT-scan images of each anode slice and their acoustic attenuation features in order to provide a thorough quantitative analysis of the data (as opposed to the qualitative validation proposed in Chapter 3). To link material attenuation features and images, a vector of features was calculated from the latter in order to formulate a regression problem with two data matrices; X containing the acoustic features and Y the image data. The CT-scan image features were extracted by applying the 2-D Discrete Wavelet Transform to decompose the image signals in 4 frequency bands along three spatial directions within the images. The energy of the signal in each wavelet sub-image was used to form a row-vector of features of each image. These were found to extract information about the material structure (pores and cracks). After applying PLS regression using both data matrices, it was found that the multi-frequency excitation strategy led to very similar results as the sequential excitation but was much faster. Again, the corridors in each slice were discriminated based on the contained pores or cracks, and how severe these defects were.
This work was presented in:
- M. B. Boubaker., D. Picard, J. Tessier, H. Alamdari, M. Fafard, C. Duchesne, Inspection of Prebaked Carbon Anodes using Multi-Spectral Acousto-Ultrasonic signals, Wavelet Analysis and Multivariate Statistical Methods, Proceedings of 34rd International ICSOBA
Conference, October 3-6, Québec City, Canada, 2016. And will be submitted in the following journal:
- M. Ben Boubaker, D. Picard, J. Tessier, H. Alamdari, M. Fafard, C. Duchesne, Inspection of Prebaked Carbon Anodes using Multi-Spectral Acousto-Ultrasonic signals, Wavelet Analysis and Multivariate Statistical Methods, “to be submitted to Metals”.
xxiv
Through communication with the manufacturer, I have adapted the acoustic system for a comparative multi-spectral analysis. This was achieved by adding some external components such as resistors and electrical connections. I have performed all the multi spectral acousto-ultrasonic tests and data analysis including the writing of the new MATLAB codes for signals and image analysis, as well as for modeling. I wrote the first draft of the manuscript and revised it under the guidance of my supervisors.
Chapter 5:
The acousto-ultrasonic inspection technique developed in Chapter 4 was then applied to full-size industrial anode blocks, the material ultimately targeted for the industrial application. A total of 27 anodes were sampled from the production line at the Alcoa Deschambault Quebec (ADQ) smelter, including some anodes containing known defects visible from their surface, and a larger set of anodes which had no visual defects but manufactured under different operating conditions (i.e., normal operation, start-up of the paste plant, and anodes baked in different positions within the furnace). The multi-frequency excitation strategy was applied to each anode at 29 different positions (21 along the anode height and 8 in the direction of its long side), and the attenuation signals were recorded for each. These response signals were preprocessed according to the method proposed in Chapter 4. The attenuation features in each position in each anode were organized in two different matrices in order to analyze the variability within each anode as well as the variability between all of them. The first data matrix was formed by concatenating all the attenuation features in all positions for a given anode in a row vector. Thus, each row of that matrix corresponds to the attenuation signature of one anode and allows for a comparison between the different anodes (between anode variability). Applying Principal Component Analysis (PCA) to that data matrix allowed clustering the anodes based on known defects or according to the process conditions under which they were produced. To analyze the within anode variability, each row of the second data matrix was filled with the attenuation features for a single position in a given anode, after which PCA was applied. Several case studies are presented, but all of them confirmed the sensitivity of acousto-ultrasonic signals to defects within the anode structure and changes in some manufacturing conditions. Qualitative validation of the results was performed by collecting images of internal surfaces of several anodes after cutting them along their long side.
xxv This work was written in a manuscript format to be submitted to a scientific journal:
- M. Ben Boubaker, D. Picard, J. Tessier, H. Alamdari, M. Fafard, C. Duchesne, Quality inspection of carbon anodes with combination of acousto-ultrasonic technique and principal component analysis, (It will be submitted to a journal that will be determined soon).
One of the big challenges in this work was how to deal with the large industrial anodes including their selection from a large variety, testing them using acoustic methods and cutting them for result validation. The latter was conducted with the help of Mr Guillaume Gauvin (research assistant at REGAL centre) and collaboration with the ADQ smelter and the Mauricie Sowing Center (MSC). I performed all the experiments including anodes preparation, acousto-ultrasonic testing and numerical imaging after cutting some anodes followed by the data analysis. At this point, it is necessary to mention that part of tests were conducted at ADQ and the other part in the civil engineering labs. I wrote the first draft of the manuscript and revised it under the guidance of my supervisors.
Chapter 6:
In this chapter, an alternative approach to acousto-ultrasonic inspection of baked anode blocks, namely vibration modal analysis, was investigated. This technique was considered in this thesis because it could lead to a faster inspection compared to acousto-ultrasonic, and could be easier to implement in an industrial environment site. However, it cannot provide as much detailed information as the acoustic methods. A combination of both approaches may be considered in the future to improve inspection efficiency. Modal analysis would be applied to all manufactured anodes for the purpose of detecting defects. Acoustic inspection would be used to provide a detailed diagnosis of the defects (i.e., type, severity, location) only upon positive detection by modal analysis. Hence, modal analysis is studied in this chapter to determine its potential for defect detection. The same set of 27 anodes used in acoustic inspection (chapter 5) was also used for this part of the research work. These anodes were mechanically excited at several different positions on four faces of the block using a hammer, and the vibration signals of the blocks were measured by accelerometers also at different positions. Where to hit the block and to measure the vibrations was determined with the assistance of finite element modeling. The vibration signals were recorded by seven accelerometers after each excitation. A code was
xxvi
developed to compute the first two vibration modes (natural frequencies) from each of the recorded signal. The frequency corresponding to these modes obtained for each excitation point and accelerometer were stored in a row vector. A modal feature matrix was formed by collecting the row vectors obtained for each anode. The data was then analyzed by PCA to cluster the anodes according to their vibration modes. It was shown that this approach could also discriminate the anodes based on known defects and/or the conditions under which they have been manufactured. Finally, the results were confirmed visually using some images collected after cutting some of the tested anodes (similarly as for the acoustic technique).
The results were presented and published in:
- M. Ben Boubaker, D. Picard, J. Tessier, H. Alamdari, M. Fafard, C. Duchesne, Non-destructive testing of baked anodes based on modal analysis and principle component analysis, TMS, Light Metals, 2017, 1289-1298.
I performed all experiments including sensor selection, ordering the missing equipment, set-up preparation, anodes fixing and vibration tests. In addition, I developed necessary MATLAB codes for natural mode identification and frequency selection. Finally I wrote the first draft of the paper under helpful ideas, comments, suggestions and modifications by my supervisors.
Appendices:
Appendices 1&2:
Due to word and page limitation imposed by ICSOBA proceedings and Metals journal, some parts of the work on the reliability of acousto-ultrasonic technique could not be included in the submitted manuscript presented in chapter 3 and 4. Hence, two appendices present additional results pertaining to the ‘similarity of the acousto-ultrasonic responses of the rods to those of their corresponding corridors’ and ‘the possibility to distinguish between corridors containing high density of pores and those containing different cracks’, respectively. These additional results are discussed in appendix 1 and appendix 2, respectively.
xxvii I performed all the experiments including sample preparation, acousto-ultrasonic tests, signal and image analysis, and reported the results under the guidance of my supervisors.
Appendix 3:
Since Chapter 5 was written in a manuscript format to be submitted to a scientific journal the attenuation maps of only three anodes (two anodes containing severe defects and a defect free anode) were presented for sake of conciseness. Therefore, the attenuation maps of all tested anodes are presented in Appendix 3.
I performed all the experiments, the corresponding analysis and the attenuation maps as well as reported the results under the guidance of my supervisors.
Appendix 4:
Due to the TMS paper-format restrictions the comparison between the numerical and the experimental modal responses of the anode, as well as details about the numerical model, such as the boundary conditions used, were omitted in chapter 6. These additional information are reported in Appendix 4.
I performed both of experimental and numerical modal analysis including the numerical simulation, preparation of experimental set-up and experimental measurements. Finally, I performed the corresponding statistical analysis and reported the results under the guidance of my supervisors.
1
Chapter 1 Introduction
Nowadays, global economic development is highly suffering by the increase of energy consumption in various sectors. In countries such as Canada, where the economy is mainly based on the exploitation of abundant natural resources, the energy consumption grows enormously. These large energy requirements are mostly concentrated in the industrial sector, especially those involved in metal refining, smelting and production of aluminium. To optimize these needs and their effects on global warming, the Canadian government is providing funding to meet the performance standards in order to help improve the energy efficiency of different sectors. According to the Office of Natural Resources Canada [1], these measures have helped the economy by saving more than 1 560 petajoules in 2010, which is equivalent to the energy consumption of all sectors throughout the province of Quebec during the same year. Figure 1-1 illustrates the efforts of Canadian primary aluminium producers in terms of both energy efficiency and production costs.
Figure 1-1 Representation of changes in the global primary aluminium production, energy
consumption and electrical costs per ton of aluminium. The evolution of the LME aluminium price is also presented. Sources: Naturel Resources Canada [1], London Metal
Exchange [2], USGS [3], I.E.A - Energy Prices and Taxes [4].
In the context of the strong increase in global primary aluminium production that reached 45Mt per year with a Canadian contribution around 7% [5-7], as illustrated in Figure 1-1, the industry must improve the performance and efficiency through the reduction
2
of the production cost and technological innovation. The significant increase in demand is explained by the intrinsic properties of aluminium that make it an interesting material to replace steel in a number of applications. This increment is offset by apparition of the new producers that simultaneously affect the economic and strategic issues. To maintain its competitiveness, primary aluminium producers rely today on a constant improvement of the manufacturing process control in their different smelters. Energy efficiency and carbon consumption during manufacturing processes are two important performance metrics that need to be optimized. However, these factors are hugely dependent on the carbon anode quality. Indeed, the worst-case scenario happens when the carbon anodes contain defects (i.e., heterogeneities, cracks, and pores). For such reason, carbon anode quality is becoming a well-known concern for aluminium producers. On the one hand, they have to deal with the decreasing quality and increasing variability of raw materials (petroleum coke and coal tar pitch) on the market. These raw materials are by-products of refineries, who have little incentive to better control their quality. On the other hand, the aluminium producers must mitigate the impact of changes in these raw material properties through appropriate adjustments to the anode manufacturing process parameters. Producing anodes with more consistent quality is therefore necessary.
1.1 Aluminium production
Aluminium is the third element and the first most abundant metal, constituting around 8% of the earth's crust [8]. It is produced via an electrochemical reaction, reducing alumina to metal aluminium. Alumina is mainly extracted from bauxite by the Bayer process [9]. Paul L.T. Héroult in France and Charles M. Hall in the United States of America both had independently discovered the electrochemical process for the manufacture of aluminium in the 19th century [10]. Until now, the dominant primary aluminium production technology is based on the Hall-Héroult process. A schematic of a modern aluminium-smelting cell is presented in Figure 1-2. The reactor (also called reduction cell or pot) is made of a steel shell internally covered with a lining of carbonaceous materials, acting as a thermal insulator and protecting the shell from the extremely harsh conditions prevailing in the cell. The electrical current enters the cell by a set of pre-baked carbon anodes (typically 40 anodes/cell). These are suspended in the cell by means of steel stubs, and float in a layer of cryolite (electrolyte also commonly called bath) containing dissolved alumina, continuously fed in the cell by point feeders. The overall alumina reduction, reaction taking place in the electrolyte layer, is represented in the following equation:
3
2 3 2
2Al O + 3C + electricity 4Al + 3CO (1.1) where alumina (Al2O3) is reduced to aluminium (Al) by applying an electrical current in the
presence of a carbon source. Carbon dioxide (CO2) is also released during the reaction. The
aluminium produced by the reaction settles at the bottom of the cell and forms a metal pad. A cathode block made of a graphitic material is installed at the bottom of the cell. The electrical current exits the cell by the cathode after passing through the metal pad. Several hundreds of cells are electrically connected in series in a typical smelter, using a system of bus bars. The metallic aluminium is periodically tapped from the cells and sent to the cast house.
Although this technology is a century old, the energy efficiency of modern reduction cells is still relatively low, with roughly half of the electrical energy input that leaves, in some cases on purpose, the pots in the form of waste heat. Since the primary production of aluminium is a process that requires extensive amounts of electricity (~13-15 MWh per ton of Al produced), these energy losses are enormous considering the Al production capacity of 2.8 million tons per year in the province of Québec alone.
Figure 1-2 Cross section of a prebaked reduction cell technology (Courtesy of Alcoa).
Carbon anodes provide the carbon source for alumina reduction (i.e., they are consumed by the reaction) and are therefore considered as a consumables for the smelting process. Their quality affects the economic and environmental performance of the process. Approximately half of electrical energy passing through the anodes is converted into heat by means of Joule effect.
4
In spite of several improvements in the electromagnetic stability, in the chemical behavior of the bath, in electrode design, as well as the application of better process control schemes, the typical thermal loss of a modern electrolysis is still high. As mentioned previously, these heat losses comprise approximately half of the consumed electrical energy. A typical distribution of the heat loss for an electrolytic cell is illustrated in Figure 1-3.
Figure 1-3 Heat loss distributions in an electrolytic cell during operation [75].
Basically, 96% of the electrical energy, consumed in a smelter, is used for aluminium electrolysis [11] and around 10% of such energy is consumed to overcome the electrical resistance of prebaked anode that can reach 60µΩm [12-14]. As shown in Figure 1-3, the thermal loss through the anode can reach up to 33% [15-16]. These losses are not only related to the nature of anode materials but also to the defects such as heterogeneities, cracks and porosity in the baked anodes. In addition, a low quality anode may result in a more reactive anode towards air and CO2, which cause more material loss and dusting, low
flexural strength and low thermal shock resistance [12]. Carbon consumption is also negatively correlated with the anode density, affecting its electrical resistivity [13, 17]. This explains the difference between theoretical and real carbon anode consumption of approximately 0.33 and 0.4kg/kg Al, respectively, as illustrated in Figure 1-4. Finally, in order to obtain a lasting service life and good energy efficiency in the electrolysis cell the anode quality have to be kept as high as possible in order to minimize the electrical resistivity, air permeability and carbon consumption.
5
Figure 1-4 Anode consumption figures [43].
1.2 Anode production
The anode manufacturing process involves five main stages: formulation, blending, mixing and forming to obtain the so-called green anode, followed by baking (carbonizing) to obtain the so called baked anode [18]. A typical process flowsheet is shown in Figure 1-5. The raw materials (coal-tar pitch, petroleum coke and recycled butts) are preheated separately at around 200°C and introduced in the mixer or the kneader to produce the anode paste. The latter is then densified by pressing or vibro-compacting. Afterwards, the green anodes are baked in large open pit furnaces at 1100-1200°C. Lastly, the baked anodes are stored until rodding, and the conveyed to the electrolysis cells. The rods (aluminium/steel assembly) serve to suspend the anodes in the electrolytic bath and to transmit the electrical current to the cell through the anodes.
6
Figure 1-5 Schematic of anode manufacturing process [19].
The size of a typical anode is 1.4-1.6 m in length, 0.65-0.75 m in width and 0.6 to 0.65 m in height. The value of the density of the baked anode can reach up to 1.570 g.cm-3 and
the Young modulus (compression) varies between 7000-11000 MPa [20-21]. The mass composition of a typical anode is 65% of petroleum coke, 15% of coal-tar pitch and 20% of anode butts (anode residues crushed and recycled after their use in the electrolysis cells). These components are distributed throughout the volume of the anode, sometimes heterogeneously. Compositional heterogeneities and variations in carbon structure may give rise to defect anodes. The baked anode volume also includes a high quantity of pores of different sizes. A normal anode typically contains about 25% of pore space. The typical size of these pores varies between 10-300 µm. Larger pores (> 300 µm) can also appear due to some variations in the anode process production parameters. The size at which pores become an issue for anode performance is still unclear at this point, and more research is
7 required to address this question. For more details about the baked and green anode structures as well as the porosity distribution the reader is referred to the thesis of Azari Dorcheh [43]. The raw materials (coke and pitch) are by-products of petroleum and coal, respectively. Coal-tar pitch is the much preferred binder in the industry. Coke and pitch are mostly composed of carbon but there are impurities, in particular, sulfur in petroleum coke that tends to increase in recent decades [21]. Recycled anode butts also add some impurities (e.g., fluorine, sodium and aluminium) in the anodes since they have been in contact with the electrolytic bath. Table 1-1 lists the typical chemical elements and physical properties of baked anodes.
Table 1-1 Chemical components and physical properties of baked anodes [30].
The anode quality is defined in terms of the properties such as strength, density and electrical resistivity. These depend on the operating parameters of the manufacturing process as well as on the raw material properties. Any change in these properties or in the process is usually reflected in the process efficiency [21-28]. A bad combination of manufacturing conditions may decrease the process efficacy by introducing heterogeneities in the anode blocks or by increasing the chances of creating cracks. This thesis will elaborate the possibilities to identify such defects as well as some of their causes, using non-destructive techniques.
8
1.3 Factors affecting anode quality
The various factors that have an influence on the final quality of the anode are divided into three groups [29]; including the raw materials characteristics, the manufacturing parameters of green anode (mixing, compaction and cooling), and baking conditions. The knowledge of the physical and chemical properties of different anode components as well as their preparation process is necessary to understand how heterogeneities arise, and how cracks are formed in the anode blocks.
1.3.1 Anode raw materials
It is worth mentioning that the anode density, electrical resistivity, mechanical strength, and reactivity are determined by a number of characteristics such as types, portions and properties of raw materials as well as the dry particle sizes. It was mentioned previously that the green anode is obtained after molding a mixture of liquid binder coal tar pitch and dry aggregates, composed of calcined petroleum coke and recycled butts particles of different sizes. The three components and their impacts on the anode quality will be discussed in the next section.
Calcined coke is commonly used in the aluminium industry and is made from green petroleum coke, a by-product of the heavy oil refinery, by means of a calcining operation. It is the main carbonaceous material in the anodes and has the highest mass fraction in anode paste comprising more than 60%. Any problem in calcining conditions and green coke quality corresponding to the crude oil quality, refining operation and delayed coking operation parameters consequently reflects in the quality of the obtained calcined coke [19]. On the other hand, the refineries do not have benefits to improve the quality of low value by-products such as coke, since it is obtained from the residuals of raw petroleum that have low cost on the market. Some authors [31] addressed the classification of various coke categories and their effects on the anode characteristics such as cracking, density, CO2
emission, metallic impurities and oxidation. Others have discussed about the impact of oil quality and process operation on green coke quality [32-33]. The study conducted by Rodenovc [34] shows that if the coke does not contain high amount of sodium, vanadium and sulfur (thermally unstable), good binding efficiency between coke and pitch can be obtained after baking. Presence of sulfur in an optimum amount assists in reducing reactivity. Contrariwise, sodium and vanadium increase the CO2 and air reactivities.
9 The main role of coal tar pitch, second raw material, is to bind filler aggregates together and thus to provide sufficient strength in anode blocks especially after pyrolysis in the baking process. It consists of approximately 50% non-volatile fraction of coal-tar that remains in the down level of the column after vaporization of all contained oils [35-37]. At room temperature, it is presented as a black friable solid. It becomes fluid above its softening point (110-115 °C, depending on its chemical composition). The pitch is then subjected to various heat treatments to improve its quality before being used in the anode recipe [38]. Its quality depends on the constituents and the operation conditions in the cooking ovens. The pitch is also useful to penetrate in the coke pores to increase the anode density and consequently the electrical conductivity. Consequently, its quality can be defined in terms of wetting properties since less viscous pitch can penetrate in smaller voids and increase the anode density [39]. Moreover, after baking the amorphous pitch transforms into semi-crystalline coke that improves the mechanical properties.
Anode butts consist of the remained anode part after about 25 days operation in typical modern electrolysis bath since the anodes are not completely consumed to avoid metal contamination by the connection steel rods. They are crushed after cooling and cleaning from bath contaminants such as sodium. The crushed butts are then used with coke as dry aggregates in the anode paste and account for about 20 % of the green anode formulation [40]. The proportion, particle size, physical as well as chemical properties of butts are crucial for anode quality [40-42]. In the latter, Fischer, Perruchoud and Belitskus also found that an increment in butt content would result in an increase of baked apparent density, decrement in electrical resistivity and shrinkage during anode baking. In addition, it was found that carbon consumption depends also on butt particle size [40].
1.3.2 Green anode manufacturing process
The quality of carbon anodes depends on other various parameters of the manufacturing process such as the type of equipment used, methods of preparation, process conditions, and allotted time for each stage. The initial step is the preparation of aggregates where the coke particles sizes are reduced by a preheated crusher [43]. This is followed by a further refinement of the resulting particles that is defined by the used technology. Zhuchkov and Khramenko [44] provided a typical range of particles size distribution: 30% coarse particles (0.6-5 mm), 20% medium particles (0.3-0.6 mm), 20% the particles of small sizes (<0.3 mm) and finally 30% of dust. After crushing and screening, the
10
coke and butt aggregates must be heated, weighed and then blended with pitch to obtain the desired recipe. The preparation of the dry aggregates and paste directly influences the formation of defects in the anode, mainly the homogeneity of the block and the cracking phenomenon. It is therefore important to use an optimum dosing of different coke particle fractions (coarse, intermediate and fines) and the coarse butts as well as the liquid pitch in order to ensure a better particles distribution [19,44].
The last step to prepare the anode paste is the mixing of the blended raw materials. The power, time and temperature of mixing are the most important parameters determining the mixing effectiveness. The efficient mixing is defined in terms of homogenous distribution of the anode contents [45-49] and lower porosity in the paste in order to obtain anodes with high density [49] and thermal shock resistance [46]. The moderate mixing energy is important because low energy leads to poor distribution of pitch and therefore inhomogeneous paste while high-energy risks to break the large particles [26]. Moreover, this must be conducted under a specific temperature (around 170°C) since the pitch characteristics such as viscosity and wetting capacity have significant effects on the anode-cracking phenomenon [48, 51]. Certain properties of the anode such as density and porosity can be correlated with mixing temperature and its duration since these parameters have an effect on the visual appearance of the paste [53-54]. Therefore, the optimization of all parameters mentioned above is necessary to obtain a good anode quality.
The anode forming can be done in two ways: by pressing or vibro-compacting. The processes that are using the vibro-compactor are preferred as they allow a more homogeneous distribution in the anode by decreasing the paste viscosity. The anode geometry is important as well, because the degassing of volatile components in the pitch depends on the anode dimensions. A bigger anode is more likely to undergo cracking because the volatiles have to travel a longer distance to exit the block. Insufficient heating during anode forming can cause an heterogeneous distribution of pitch and may lead to formation of cracks and porous areas during baking [55]. In addition, the forming temperature must not be too high (implies too low paste viscosity) in order to avoid the anode collapse when removed from the mold. Lastly, since the non-uniform density distribution within the anode can occur when the anode paste is filled in the mold, it is very important to ensure a balanced filling [55].
11 After extraction from the mold, the anode undergoes either a slow cooling over 540 minutes in ambient air or an accelerated cooling by spraying or immersing in water, at a temperature approaching 70°C, which takes about only 90 minutes to cool down the green anode [18]. Generally, the vibro-compacted anodes need a longer cooling time than those formed by presses because of the higher forming temperature [30]. However, in both cases, the temperature should be suitably adjusted in order to avoid the development of high temperature gradient between the cooling fluid and the anode surfaces. When using a low cooling temperature, the anode is exposed to significant thermal stresses, which may exceed the limit supported by the anode. Furthermore, small cracks may appears during a rapid cooling caused of the excessive contraction in the anode surface since a high temperature gradient between the surface and the anode center can be produced. If the anode is already holding defects especially cracks, the thermal stresses are more likely to cause further propagation of the horizontal pre-existing cracks, regardless of the uniformity of the cooling (uniform or variable) [26]. Finally, the transportation, handling and storage of the green anodes after forming should be completed with care because the hot anodes are more vulnerable to damages.
1.3.3 Anode baking process
The most important step in the anode production process is the anode baking since the anode mechanical and physical properties develop during this process. In this step, part of the pitch is released as volatiles and the other part is coked to give the anode its rigid form. The baking process is very complex because there are several parameters that can change the anode structure. It is also the most expensive step in the anode production line. The anodes are staked vertically in the pits of an open ring furnace and are covered with fine particles of coke in order to fill the empty spaces and avoid anode burning during baking at high temperatures reaching up to 1200°C [19, 30]. Meanwhile, the heat is provided by burning a fuel during all baking operation that takes around two weeks. The furnace design, the heat-up rate, the final temperature, the temperature gradient, and the soaking time at such temperature are the important baking parameters [60-62]. In addition, the way to inject the fuel into the furnace also affects the baking process efficiency in a considerable way and consequently affects the quality of baked anodes [63].
At the beginning of baking, an anode expansion phenomenon occurs, at about 200°C, due to the pressure (induced by the anode expansion) that is accumulated during the
12
previous process: mixing and green block cooling. However, if the resulting stress exceeds a critical limit, a vertical crack may appear at the center of the anode [25, 26]. At a temperature higher than 200°C, the release of volatiles generates an evolution of the pressure in the whole anode block. If this pressure is not efficiently removed by degassing, the same vertical cracking phenomenon can result. When the temperature exceeds the boiling point of the pitch, the volatiles emerge through micro-pores and provoke the apparition of micro-cracks by interconnecting these pores. For these reasons, it is important to operate the furnace with an optimal heating rate to avoid the pressure increase and thus to decrease the crack development. In addition, when a high heating rate is used, the operation requires more energy (i.e. fuel) especially at the beginning of baking [64]. According to Dagoberto et al. [65], the heating rate must not be exceed 15°C/h to avoid the formation of this kind of cracks.
Other types of cracking are caused by the stresses already present within the anode, which is accumulated during compacting and green anode block cooling, if they reach a certain threshold. The overpressure accumulated inside the anode is quickly stopped when the cooling is accelerated by water, which increases the pressure in the anode. However, in the case where the cooling is performed by air, the heating rate during firing can be done at a higher speed [58]. The better distribution of the pitch in the anode block causes a reduction of the internal pressure during de-volatilization, which leads to an anode with less cracks.
Moreover, the lifetime of the anode and their consumption in the electrolysis are directly related to the final cooking temperature [66]. Liu et al. [67] highlighted this by means of studying the influence of the plant parameters and anode properties. The results show that the major causes of this problem is the propagation of pre-existing cracks. The latter are created during the baking process when a density gradient is accumulated in the green anode. The release of induced stress, which is formed by both compaction and cooling process, leads to the creation of vertical cracks by de-volatilization of pitch during the baking process [68].
In conclusion, it is clear from the above that the appearance of defects can be caused either by different anode manufacturing processes or by the quality of raw materials. Although these mechanisms are completely different and independent of each other, some form of defects, such as vertical cracks, can be caused by different factors. This makes the exact origin of these cracks difficult to identify.
![Figure 1-3 Heat loss distributions in an electrolytic cell during operation [75].](https://thumb-eu.123doks.com/thumbv2/123doknet/3686687.109317/34.918.283.598.276.586/figure-heat-loss-distributions-electrolytic-cell-operation.webp)
![Figure 1-6 Cracked carbon anode due to the thermal shock in the electrolysis cell [50]](https://thumb-eu.123doks.com/thumbv2/123doknet/3686687.109317/43.918.239.722.375.669/figure-cracked-carbon-anode-thermal-shock-electrolysis-cell.webp)
![Table 1-2 Degree of influence of the factors provoking common defects in anodes [74].](https://thumb-eu.123doks.com/thumbv2/123doknet/3686687.109317/45.918.156.806.343.609/table-degree-influence-factors-provoking-common-defects-anodes.webp)
![Figure 1-10 Typical mounting of acoustic emission testing [57].](https://thumb-eu.123doks.com/thumbv2/123doknet/3686687.109317/56.918.185.688.103.356/figure-typical-mounting-acoustic-emission-testing.webp)
![Figure 1-13 The experimental set-up for obtaining a CT-scan image [70].](https://thumb-eu.123doks.com/thumbv2/123doknet/3686687.109317/60.918.236.645.177.392/figure-experimental-set-obtaining-ct-scan-image.webp)
![Table 1-3 Main features of the widely used non-destructive testing methods used in the industry (Modified from [293] and [294])](https://thumb-eu.123doks.com/thumbv2/123doknet/3686687.109317/62.918.69.854.345.930/table-features-widely-destructive-testing-methods-industry-modified.webp)
![Table 2-1 Comparison of excitation methods (modified from [189]).](https://thumb-eu.123doks.com/thumbv2/123doknet/3686687.109317/70.918.114.763.545.967/table-comparison-excitation-methods-modified.webp)