SUPPORTING PRODUCTION FROM A SINGLE SURFACE ROUGHNESS PROFILE
PAUL PROVENCHER
D´EPARTEMENT DE G´ENIE M´ECANIQUE POLYTECHNIQUE MONTR´EAL
TH`ESE PR´ESENT´EE EN VUE DE L’OBTENTION DU DIPL ˆOME DE PHILOSOPHIÆ DOCTOR
(G´ENIE M´ECANIQUE) SEPTEMBRE 2017
POLYTECHNIQUE MONTR´EAL
Cette th`ese intitul´ee :
SUPPORTING PRODUCTION FROM A SINGLE SURFACE ROUGHNESS PROFILE
pr´esent´ee par: PROVENCHER Paul
en vue de l’obtention du diplˆome de : Philosophiæ Doctor a ´et´e dˆument accept´ee par le jury d’examen constitu´e de :
M. LAKIS Aouni, Ph. D., pr´esident
M. BALAZINSKI Marek, D. Sc., membre et directeur de recherche M. SEDAGHATI Ramin, Ph. D., membre et codirecteur de recherche M. ACHICHE Sofiane, Ph. D., membre
DEDICATION
ACKNOWLEDGEMENTS
My sincere thanks to the Canadian people and in particular the people of Quebec for sup-porting my research and studies.
I am proud to acknowledge the financial support of H´eroux-Devtek Inc., Pratt & Whit-ney Canada Corp., Mitacs Canada, the Natural Sciences and Engineering Research Coun-cil of Canada (NSERC), the Synergetic Research and Innovation in Aerospace Consortium (CRIAQ), and the Collaborative Research and Training Experience Program (AeroCRE-ATE). The CRIAQ project was made possible by its Principal Investigator, Professor Myriam Brochu.
I am very grateful to Professor Marek Balazinski, both for his perpetually open door and for his faith in me and my non-engineering background. His support and advice have been invaluable.
My thanks to Professor Ramin Sedaghati for his advice in preparing my papers and software tools.
Thank you to all the members of my Ph.D. defense jury for participating in the completion of my doctorate: Professors Sofiane Achiche, Marek Balazinski, Wit Grzesik, Aouni Lakis, Diane Riopel, and Ramin Sedaghati. Professor Grzesik’s publications also aided the direction of my work.
Thank you to the school administration for their very useful changes to this thesis. My gratitude also goes to Dr. Maryam Aramesh for her personal help in working out the direction of my research and to Dr. Anna Los for technical discussion.
I would like to thank Mr. Arnaud Divialle of H´eroux-Devtek for his insightful advice. A special thank you also to Dr. Serafettin Engin and Pratt & Whitney Canada for granting me the opportunity to spend time on location in the company’s Longueuil plant.
The American Society of Mechanical Engineers (ASME) is recognized for granting per-mission to reproduce Figure 2.5.
Most importantly, my deepest thanks to Mme Carmen Larivi`ere for her boundless sup-port, guidance, and inspiring attitude.
R´ESUM´E
En production, le contrˆole et la mise au point de coupes pr´ecises d´epend fortement d’une approche essai et erreur et de l’expertise des sp´ecialistes d’usinage. La manipulation des nombreuses variables du proc´ed´e en vue d’´elaborer des conditions acceptables exige la fabri-cation de pi`eces d’essai. Lorsque le coˆut unitaire d´epasse les dizaines de milliers de CAD, il est digne d’int´erˆet de diminuer le nombre de pi`eces d’essai mˆeme d’un seul exemplaire. Le contrˆole du proc´ed´e est ´egalement important afin d’empˆecher les pi`eces rebut´ees.
Cette th`ese d´ecrit le d´eveloppement de la capacit´e d’acqu´erir un unique profil lin´eaire de rugosit´e d’une pi`ece soumise au tournage dur de finition, de remettre ce profil `a une analyse automatis´ee et obtenir les contributions proportionnelles de certains m´ecanismes envers des param`etres arbitraires d’amplitude de rugosit´e.
L’´evaluation en tant que contribution `a n’importe param`etre facilite l’utilisation en fab-rication, vu qu’en production il est normallement d’importance capitale de satisfaire aux crit`eres sp´ecifiques du dessin tel la rugosit´e moyenne Ra, plutˆot qu’`a des param`etres
exo-tiques. L’analyse automatis´ee est importante afin d’´eviter d’exiger une expertise sp´eciale pour appliquer les techniques chez le manufacturier. Les profils de rugosit´e lin´eaires sont at-trayants pour leurs qualit´es d’ˆetre rapides, peu chers, non-destructifs, et d´ependants unique-ment d’´equipements communs en atelier d’usinage.
Les d´efis relev´es comptent la tˆache non-triviale d’automatiser l’identification des traces d’outils dans les profils lin´eaires de rugosit´e, en absence de connaissance a priori de la mor-phologie des traces d’outils `a cause de la d´eformation plastique importante lors du tournage dur de finition. La m´ethode cr´e´ee est nomm´ee identification par domaine corr´el´e (CDI)
et exploite la variabilit´e al´eatoire du proc´ed´e sans effectuer de r´egression. Des signatures de m´ecanismes actifs lors de la finition dure ont ´et´e identifi´es en tant que modes de variabilit´e de la coupe, sans devoir prescrire par r´egression les d´eformations attendues. Les modes cor-respondent `a la vibration radiale et axiale et `a des r´eponses plastiques du mat´eriau. Les modes ont ´et´e id´ealis´es math´ematiquement. De plus, il a ´et´e v´erifi´e exp´erimentalement que les vibrations radiales expliquent la signature de son mode associ´e dans sa totalit´e.
L’´etude culmine avec une impl´ementation sous forme de logiciel graphique destin´e `a l’utilisation en production. L’analyse est con¸cue pour la facilit´e de l’utilisation et se trouve presque enti`erement automatis´ee. Le logiciel compte aussi parmi ses fonctionnalit´es l’estima-tion par ´el´ements finis de la concentration de contrainte microg´eom´etrique et la g´en´eration d’hypersurfaces de r´eponse pour plans exp´erimentaux. Les codes sont structur´es et docu-ment´es afin de faciliter une continuation suivant le d´epart de l’auteur du programme doctoral.
ABSTRACT
In production, control and optimization of precision cuts is heavily dependent upon trial and error and upon machining specialist expertise. When unit cost is in the tens of thousands of CAD, manipulation of the many process variables in order to narrow in on acceptable conditions should be done with as few trial parts as possible; reduction of the number of trial parts by even one specimen is worthwhile. Process control is equally important to maintain stable production and prevent the scrapping of parts.
This thesis describes the development of the ability to acquire a single linear roughness profile from a finish hard turned metallic part, submit the roughness profile to a computer-automated analysis, and obtain percent contributions of specific mechanisms to arbitrary roughness parameters of profile amplitude.
Expression as a contribution to any parameter facilitates applicability in manufactur-ing, in which production is usually concerned with meeting specific scalar surface roughness requirements such as average roughness Ra rather than exotic roughness parameters.
Auto-mated analysis is important in order to avoid requiring special expertise in the techniques developed for manufacturer implementation. Linear roughness profiles are attractive for the quick, inexpensive, and non-destructive nature of their acquisition, and for the widespread availability of linear roughness measuring machines in machine shops.
The challenges overcome include the non-trivial task of automating identification of the locations of tool traces or “feed marks” in linear roughness profiles, without any a priori knowledge of feed mark shape due to the significant plastic deformations in finish hard turning. The method developed is dubbed “Correlated Domain Identification” (CDI), does not depend on regression techniques, and exploits the continuous random variability of the cutting process. Signatures of specific mechanisms active during hard turning were identified as modes of cut variability without coercing the data by fitting of expected deformations. The modes identified include radial and axial cutting vibration, local ploughing, and side flow. The modes were idealized mathematically. The claim that radial vibration fully accounts for its associated mode signature was verified experimentally.
The study culminates with implementation as a graphical software program suitable for use in production. The analysis is nearly entirely automated and is designed for ease of use. Additional features of the software include finite element estimation of microgeometry-induced stress concentration and generation of response hypersurfaces of designed exper-iments. The codes developed are neatly organized and documented in order to facilitate development following the author’s departure from the Ph.D. program.
TABLE OF CONTENTS
DEDICATION . . . iii
ACKNOWLEDGEMENTS . . . iv
R´ESUM´E . . . v
ABSTRACT . . . vi
TABLE OF CONTENTS . . . vii
LIST OF TABLES . . . xi
LIST OF FIGURES . . . xii
LIST OF APPENDICES . . . xv
LIST OF SYMBOLS AND ABBREVIATIONS . . . xvi
PREFACE . . . xvii CHAPTER 1 INTRODUCTION . . . 1 1.1 Problem Statement . . . 2 1.2 Hypotheses . . . 4 1.3 Objectives . . . 5 1.4 Thesis Organization . . . 5
CHAPTER 2 LITERATURE REVIEW . . . 7
2.1 Hierarchy of Context . . . 7
2.2 Microgeometry Inspection . . . 10
2.3 Microgeometry Specification . . . 12
2.4 Decomposition of Feed Marks . . . 16
2.5 Cutting Dynamics . . . 18 CHAPTER 3 ARTICLE 1: AUTOMATIC IDENTIFICATION OF FEED MARKS IN
VARIATIONS . . . 22 3.1 Introduction . . . 22 3.2 Theory . . . 24 3.3 Experiment . . . 29 3.4 Results . . . 30 3.4.1 Identified marks . . . 30 3.4.2 Crisp results . . . 30
3.4.3 Detection of visually non-obvious or misleading marks . . . 32
3.4.4 Correlation between adjacent marks . . . 32
3.4.5 Long-range correlation . . . 33
3.4.6 Correlation matrix blurriness . . . 33
3.4.7 Variability of repeated profile measurements . . . 33
3.4.8 Qualifier function error . . . 34
3.4.9 Limitations of the model . . . 34
3.4.10 Negative correlation of adjacent marks . . . 35
3.4.11 Some limits of CDI . . . 36
3.5 Discussion . . . 36
3.6 Conclusion . . . 41
3.7 Conflict of Interest . . . 41
3.8 Acknowledgements . . . 41
CHAPTER 4 ARTICLE 2: PRINCIPAL COMPONENT IDEALIZATIONS OF THE DOMINANT MODES OF VARIABILITY IN THE MECHANICS OF THE CUT-TING PROCESS IN METAL TURNING . . . 42
4.1 Introduction . . . 42
4.2 Theory . . . 46
4.2.1 Feed marks in linear roughness profiles as snapshots of the cut . . . . 46
4.2.2 Use of Correlated Domain Identification (CDI) to verify feed mark phase 46 4.2.3 Principal component breakdown of feed marks . . . 47
4.2.4 Effects of common modes of cutting variability on feed marks . . . . 48
4.2.5 Method of quantifying the influences of modes of cutting variability on roughness parameters . . . 52
4.3 Materials and Methods . . . 53
4.4 Results and Discussion . . . 53
4.4.1 Fine-tuning of effective feed for Correlated Domain Identification (CDI) 54 4.4.2 Experimental principal components of feed marks . . . 54
4.4.3 Idealizations of feed mark principal components and relationships with
cutting mechanics . . . 55
4.4.4 Quantitative influences of modes of cutting variability on roughness parameters . . . 56
4.5 Conclusion . . . 58
4.6 Conflict of Interest . . . 59
4.7 Acknowledgements . . . 59
CHAPTER 5 ARTICLE 3: FEED MARK DEPTHS IN LINEAR SURFACE ROUGH-NESS PROFILES OF FINISH HARD TURNED METAL PARTS COMPARED WITH THE RADIAL COMPONENT OF CUTTING VIBRATIONS . . . 60
5.1 Introduction . . . 60
5.2 Theory . . . 63
5.2.1 Feed mark identification by correlated domain identification . . . 63
5.2.2 Decomposition of feed marks . . . 66
5.3 Experiment . . . 66
5.4 Results . . . 67
5.4.1 Comparison of frequency spectra . . . 67
5.4.2 Comparison of depth distributions . . . 67
5.5 Discussion . . . 69
5.5.1 Discussion of the frequency spectra . . . 69
5.5.2 Discussion of the depth histograms . . . 73
5.6 Conclusion . . . 74
5.7 Acknowledgements . . . 75
CHAPTER 6 GRAPHICAL SOFTWARE IMPLEMENTATION . . . 76
6.1 Roughness Profile Treatment and Filtering . . . 76
6.2 Estimation of Cutting Variability Contributions to Roughness . . . 76
6.2.1 Determination of the effective feed length . . . 77
6.2.2 Determination of the phase of the feed marks in the roughness profile 77 6.2.3 Estimation of the percent contributions of cutting effects to roughness parameters . . . 78
6.3 Finite element estimation of microgeometrical stress concentration . . . 78
6.4 Response Surface Generation . . . 79
CHAPTER 7 GENERAL DISCUSSION . . . 88
7.2 Scientific Results . . . 90
7.2.1 Feed mark correlation maps . . . 90
7.2.2 Modes of feed mark variability . . . 91
7.2.3 The radial vibration variability mode . . . 92
7.3 Development as a Support Tool for Production . . . 93
7.4 Limitations of the Study . . . 94
CHAPTER 8 CONCLUSIONS AND RECOMMENDATIONS . . . 95
CHAPTER 9 ORIGINAL CONTRIBUTIONS . . . 97
REFERENCES . . . 98
LIST OF TABLES
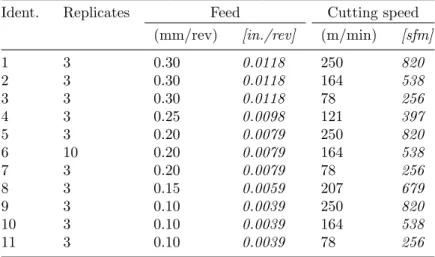
Table 2.1 Some arithmetic and statistical parameters of roughness profiles . . . 14 Table 3.1 The cutting conditions and numbers of replicates of each experimental
treatment in Article One . . . 30 Table 4.1 The cutting conditions and numbers of replicates of each experimental
LIST OF FIGURES
Figure 1.1 Linear roughness profiles . . . 3
Figure 2.1 Common elements of a skidded contact stylus roughness measuring machine detector . . . 11
Figure 2.2 Simplified process for generating the primary, waviness, and roughness profiles . . . 14
Figure 2.3 Plastic flow in turning and a model of its effect on roughness profiles 18 Figure 2.4 A model of the vibrational dynamics of the machine tool-tool-workpiece system . . . 19
Figure 2.5 Illustration of ploughing and material flow . . . 20
Figure 2.6 The phenomenon of sidewall surface generation in milling . . . 21
Figure 2.7 Description and modeling of elastic-plastic material influence on surface roughness . . . 21
Figure 3.1 A chart of the CDI algorithm . . . 25
Figure 3.2 Explanatory illustration of a profile dissected into segments of twice the feed length and superimposed . . . 26
Figure 3.3 Graphs aiding the explanation of point-by-point correlation of segments of twice the feed length . . . 27
Figure 3.4 Illustration of the method of evaluating the qualifier function . . . 28
Figure 3.5 Visual aid for explaining the usage of the qualifier function . . . 29
Figure 3.6 The mean feed marks identified from 33 of the 40 machining tests for Article One, each one taken from one profile . . . 31
Figure 3.7 A profile with a particularly crisp correlation matrix . . . 32
Figure 3.8 An uncrisp correlation matrix with a crisp qualifier function . . . 33
Figure 3.9 An example of detection of a visually non-obvious feed mark . . . 34
Figure 3.10 An example of considerable correlation between adjacent feed marks . 35 Figure 3.11 An example of periodic, long-range, inter-mark correlation . . . 35
Figure 3.12 An example of a profile with a blurry correlation matrix . . . 36
Figure 3.13 An example of negative correlation between adjacent feed marks . . . 37
Figure 3.14 An example of correlation maps from repeated measurements . . . . 38
Figure 3.15 An example of a roughness profile where the qualifier function applies poorly . . . 39
Figure 3.16 The effect of the length of the profile on the qualifier function . . . . 39
Figure 4.2 Illustration of the CDI method . . . 47
Figure 4.3 A measured profile from finish hard turning. The feed marks are not obvious from visual inspection . . . 48
Figure 4.4 The modes of variability due to cutting mechanics considered and their simple-form idealizations . . . 49
Figure 4.5 The coupling of the horizontal line and inclined line components . . . 50
Figure 4.6 Summary of the mathemetical definition of the feed mark components 51 Figure 4.7 Illustration of local, sub-feed-mark failure of the cutting tool to engage the workpiece material . . . 52
Figure 4.8 The effect of utilizing effective feed estimation on feed mark correlation maps . . . 54
Figure 4.9 An example of experimental principal components . . . 55
Figure 4.10 The proportion of feed mark variance explained as a function of the number of principal components included . . . 56
Figure 4.11 A fit of idealized feed mark components to an experimental roughness profile . . . 57
Figure 4.12 Estimation of cutting mechanism contributions to roughness parameters 57 Figure 4.13 Another estimation of cutting mechanism contributions to roughness parameters . . . 58
Figure 5.1 The coordinate system used . . . 64
Figure 5.2 The experiment at a glance, in Article Three . . . 64
Figure 5.3 Illustration of the CDI method . . . 65
Figure 5.4 Photograph of the lathe tool holder with the accelerometer attached . 67 Figure 5.5 A y-z (azimuthal) stylus-measured roughness profile . . . 68
Figure 5.6 The radial component of the accelerometer readings . . . 68
Figure 5.7 Frequency space comparison of the radial accelerometer readings and the y-z profile . . . 69
Figure 5.8 An excerpt of an x-z stylus-measured roughness profile in Article Three 70 Figure 5.9 The correlation map for identifying feed marks in Article Three . . . 70
Figure 5.10 The qualifier function for identifying feed marks in Article Three . . . 71
Figure 5.11 The result of the computer-automated feed mark identification in Ar-ticle Three . . . 71
Figure 5.12 The radial displacement of the tool as a function of time, from the accelerometer . . . 72
Figure 5.13 Comparison of radial tool displacement and feed mark depths . . . . 72 Figure 6.1 The frequency filtering panel of the graphical software implementation 80
Figure 6.2 The power spectrum panel of the graphical software implementation . 81 Figure 6.3 The correlation map panel of the graphical software implementation . 82 Figure 6.4 The panel of the graphical implementation estimating feed mark
vari-abilities . . . 83
Figure 6.5 Schematic of the finite element model used . . . 83
Figure 6.6 The setup panel for the finite element estimation of microgeometrical stress concentration . . . 84
Figure 6.7 The result panel for the finite element estimation of microgeometrical stress concentration . . . 84
Figure 6.8 Mesh size convergence . . . 85
Figure 6.9 Convergence for finite element block thickness . . . 85
Figure 6.10 Definition of “block thickness ratio” as used in Fig. 6.9 . . . 85
Figure 6.11 Validation of the finite element model using elliptical notches . . . 86
LIST OF APPENDICES
LIST OF SYMBOLS AND ABBREVIATIONS
a, b, c, d, ... The first few principal components of a set of feed marks, in order of decreasing importance (variance).
A The idealized feed mark component corresponding to radial displace-ment of the cutting tool (see Chapter 4).
B The idealized feed mark component corresponding to axial displace-ment of the cutting tool.
C The idealized feed mark component corresponding to local, intra-mark ploughing.
D The idealized feed mark component corresponding to side flow. CDI Correlated domain identification (see Chapter 3)
FEA Finite element analysis Kt Stress concentration
f The effective machining feed length, as it appears in a measured linear roughness profile
ϕ Phase (measure of lateral position within a linear (i.e. 2D) roughness profile)
ϕm Feed mark phase (start of the first feed mark in the roughness profile)
q(ϕ) The qualifier function (see Chapter 3)
x The axial coordinate of a cylindrical turned surface. y The tangential coordinate orthogonal to x and z. z The radial coordinate of a cylindrical turned surface.
rev Revolution
PREFACE
Montreal, late at night
When they offer you grad studies, they don’t tell you it’s aboard a submarine. Not explicitly. It’s cold and I keep wishing there were windows, but even when I’m alone there’s always the hum of the mini-fridge and the company of my “CDI” method and of the-part-of-my-brain-that-doesn’t-care-what-I’m-working-on.
“I’m going to ad-lib a song about how to colonize Mars. It’s set to the tune of ‘Stressed Out’ by Twenty One Pilots.”
“Thanks, TPOMBTDCWIWO.”
I think it’s worked out all right. My work started out as a Master’s degree; though the sentiment was not universal, Professor Balazinski had no hesitation in taking on a physics science major as a grad in mechanical engineering. After a year I knew I had enough material lined up to do quick Ph.D. instead, which seems to have lasted a total of three and a half years. Meanwhile, I’ve very nearly completed the slew of exams the Ordre des Ing´enieurs prescribed me to qualify as a junior mechanical engineer. Still, it feels like I’m a physicist pretending to be an engineer. Eh, what’s that, CDI?
“You’re more of an analyst-parastatistician-manufacturing-engineer-experimental-physi-cist-materials-coding guy.”
“Bit of a mouthful. Just go back to finding feed marks.”
“I also think you should have published the finite elements part as a technical note.” “That’s enough from you, CDI! I birthed you from my mind-vagina!” I think it sounded better when Dan Avidan said it.
Though I wish I’d gotten to build more lab setups, like I did before I came here, I might be doing that again soon; I can only suppose my work has been appreciated, seeing as the next chapter of my life looks like it might be a postdoc contract aboard a nicer submarine.
For those who will come after, if you choose to use some of my work in yours, I’ve made sure to organize and comment all my scripts as nicely as I can. Maybe I can get them to you, no need to reinvent everything. I’d be delighted for my work see use again. Whether or not your work is related to mine, I hope you enjoy what you’re creating and don’t fret working at the bottom of the sea.
CHAPTER 1
INTRODUCTION
To state the research question informally, can a single linear roughness profile from a hard finish turned part1 be submitted to a computer, analyzed in an automated way, and yield percent contributions of specific cutting variabilities (vibrations and plastic effects) to arbi-trary roughness parameters? Concluding in the affirmative, developing that ability is the goal of this thesis. Informally, the fundamental hypothesis of this thesis rests on the notion that the two-dimensional cross-sections of the tool trace on the surface of a turned part, or “feed marks”, in a given profile behave as a statistical sample of the instantaneous state of the dynamic cutting interface. The feed marks behave as “snapshots” of the cut.
The context is precision finish machining, a class of techniques that is appropriate for the generation of critical surfaces having particular surface integrity requirements. The criticality of a surface is dependent upon its function: a gas turbine disk may require pronounced fatigue reliability, a gastight seal flange may require particular surface microgeometry, and an optical surface may require smoothness in the hundredths of a micron. Achieving the requirements of a surface by manufacturing successive trial parts may be demanding and costly. Similarly, it is desirable to eliminate operations entirely by producing a finished surface by cutting alone, without additional processing. Once a process is approved and a part enters production, monitoring the evolution of a production line’s results is equally important to prevent the scrapping of parts.
Surface finish is highly relevant to many critical surfaces. Sadly, road pavement (Boscaino et al., 2003) and machined parts, despite very different surface generation mechanisms, are both treated using the same simple geometrical descriptors such as the ubiquitous rough-ness parameter Ra 2. The typical analytical treatment of surface roughness is devoid of
significance to the process having generated the surface, in no way describing the physics of the manufacturing process. Machining specialists are therefore very reliant on experience to minimize trial-and-error. Experimental tools exist, such as the insertion of a dynamometer between tool holder and turret, the measurement of the vibrational modes of the machine tool system, measurement of spindle power, high-speed video recording of the cut, and many other means of diagnosing the cutting process. However, these methods may be
cumber-1That is to say, finish turned by hard turning. 2R
aexpresses the amplitude of a roughness profile, the mean absolute deviation from the center line (ISO 4287:1997, 1997).
some and time-consuming, requiring special equipment and experts for data acquisition and analysis, and may imply drawbacks such as the addition of new vibrational modes from the inclusion of a dynamometer.
A simple and inexpensive alternative may be the collection of linear roughness profiles3
from machined parts. A stable cut is inevitably a dynamic stability, evidenced by the unique-ness of each feed mark in any given linear roughunique-ness profile. Each feed mark in a linear roughness profile indicates the instantaneous condition of the interface between cutting edge and workpiece. It follows that treatment of the feed marks of a profile as a statistical sample of snapshots may reveal the signatures of the dynamic processes involved in generating the surface. Linear roughness profiles are appealing for the ease, quickness, and inexpensiveness of their measurement, and for their non-destructive nature. Linear roughness profiles are commonly used in industrial practice.
There is currently an extreme dearth of research into the treatment of linear roughness profiles as snapshots of the cut. This thesis develops the ability to have a computer au-tomatically decompose a roughness profile into quantitative information about the physics of the cut, for the sake of reducing non-trivial production expenses resulting from the trial and error methods described above. As an example, the contribution to surface roughness parameter Ra from the radial component of vibration between tool and workpiece can be
quantified. Supposing that in a particular case it were ascertained that Ra could be reduced
by 16% by stabilizing the cut, then the machining specialist would have that information to decide whether the surface should be improved by reducing system vibration rather than selecting another way of modifying the cut, such as a sharper edge preparation, harder tool, or any number of other approaches to process optimization.
The scope of the research in this thesis is limited to the study of linear roughness profiles resulting from hard finish turning. Nonetheless, it is expected that derivative techniques might be applicable to milling and drilling, as both those techniques produce feed marks in a manner similar to turning.
1.1 Problem Statement
In a production scenario, typical problems with microgeometry include inadmissibly large values of roughness parameter Ra, readhered material, tears, laps, poor finish due to
built-up edges, white layer, scratches, waviness, traces of vibrations, and dimensional inaccuracy. To resolve this type of issue, experience is very heavily valued, and in combination with cutting tests, touch, visual inspection, and roughness measuring tools, a cutting specialist
Figure 1.1: Linear roughness profiles. a) An example of a linear roughness profile of a cylindrical turned part. The profile was measured axially along the part, and has visually evident tool trace cross-sections, or “feed marks”. The dashed lines indicate the locations of the marks, as determined using Correlated Domain Identification (CDI), the new technique described in Chapter 3. b) An illustration of digital encoding of linear roughness profiles
using a skidless contact stylus (more details on the apparatus in Section 2.2).
may narrow in on the primary cause of the problem faced. He may then improve the cut by changing the cutting tool material, tool geometry, edge preparation, tool holder, cutting feed, cutting speed, depth of cut, coolant, method of coolant application, the order of cuts, and so forth among many ways of adjusting the machine tool-tool-workpiece system. Even a cut that satisfies the nominal requirements of a part may present a risk to its production series if the degree of control over the cut is such that an eventual part may have to be scrapped.
Furthermore, improving a cut by trial and error becomes expensive very rapidly as the number of dimensions increases; even if only feed, speed, and depth of cut considered as controlled variables, plus one response variable, exploring the resulting four-dimensional space may require many trial parts to be manufactured.
There are therefore two advantages to understanding the cutting dynamics specific to a given precision cut. “Cutting dynamics”, here, should convey the notion that a cut is a dynamically stable process: the mercurial behavior of built-up edges, vibrations, temperature fluctuations (for example, due to coolant splashing and inconstant chip morphology), material inhomogeneity (in terms of internal stresses, work hardening, and composition), and so on, continuously agitate the interface between cutting edge and workpiece. The first advantage is to reduce the number of trial parts when optimizing the cut. The second advantage is to maintain a cutting process that is stable and consistent. Both are directly related to manufacturer expenses, particularly when unit cost is high.
Reducing the number of trial parts necessary to optimize a process may be the more important of the two advantages, simply because some processes may be costly to alter once approved for a production line, especially in aerospace, in which certification is the name of the game. In some cases, a single turned trial part may cost tens of thousands in USD for bulk workpiece material alone. By comparison, analysis of roughness costs very little, especially automated analysis. Linear roughness profiles are of particular interest because linear roughness measuring machines are common in shops and are non-destructive (see Fig.1.1).
This thesis demonstrates that a single roughness profile from a hard finish turned part can be exploited as a set of snapshots of the dynamic state of the cutting interface. That treatment may yield estimates of the percent contributions of specific cutting effects to ar-bitrary amplitude-based roughness parameters, in order to support production in efficiently controlling precision cuts.
1.2 Hypotheses
This work confirmed the following hypotheses:
• Random variabilities within feed marks are correlated with one another within indi-vidual feed marks, and are not correlated with each other between feed marks. This is the basis of the Correlated Domain Identification (CDI) technique developed in Article One (Chapter 3).
• Feed marks vary according to a small number of modes of variability, and those modes are associated with individual competing mechanisms active during the cut. This state-ment was previously made by Ancio et al.(Ancio et al., 2016).
• The modes of variability are largely independent, and their contributions may be treated as a sum. This is the basis for the use of principal component analysis of feed marks in Article Two (Chapter 5), revealing modes of feed mark variability that correspond with the deformations expected from specific mechanisms. Specifically, the signatures of radial and axial vibration, and of ploughing and side flow, were found. This is shown in Article Two (Chapter 4). The notion that the contributions of physical mechanisms to surface roughness may be treated as independent was previously suggested by W. Grzesik and S. Brol (Grzesik and Brol, 2011).
• The mode of variability associated with feed mark relative depths is fully accounted for by the radial component of cutting tool vibration, both in spatial frequency and in amplitude (Chapter 5).
1.3 Objectives
The general objective of the proposed research is to derive information about the cut from machined surface microgeometry. This is to be done by segmenting linear roughness pro-files into individual feed marks, in order to treat the feed marks as “snapshots” of the cut, that is, as a statistical sample of the instantaneous state of the interface between cutting edge and workpiece. Snapshots in time of the interface may contain signatures of dynamic processes active during the cut, and that information may enable estimation of the percent contributions of specific mechanisms to arbitrary roughness parameters of amplitude.
This work was inspired by the following principles. In practical application as a support tool for production, the techniques developed must:
• Be inexpensive to use. (Be quick, non-destructive and not unduly laborious.)
• Make use of equipment typical of manufacturers of precise machined aerospace compo-nents. (Not require atypical equipment.)
• Have mostly automated analysis. (Not require any special expertise to employ.) • Produce information machining specialists can immediately apply to cutting process
optimization. (Be useful for production.)
Though a practical, graphical computer program implementation was developed and is shown in this thesis, these guiding stars do not imply that the thesis includes development of commercial-quality analytical tools.
As the specific objectives, an easily employed, mostly-automated analysis method was developed as a support tool for production, that can:
• Take as input a single roughness profile from a hard finish turned metallic part. • Identify the locations of the feed marks.
• Break down feed mark variabilities by specific cutting effects such as vibration and workpiece plastic deformation
• Estimate percent contributions of those specific effects to arbitrary amplitude-based roughness parameters.
1.4 Thesis Organization
• Automated identification of visually non-obvious feed marks. Hard finish turned sur-faces often exhibit either feed marks that are severely deformed (as compared with the ideal tool nose trace) by plastic effects, or indeed no visually evident feed marks at all. How can a computer identify where the feed marks are located in a roughness profile digital signal, without a priori assuming a feed mark shape? This is resolved in Article One (Chapter 3).
• Decomposing feed marks into phenomenon signatures: Do feed marks from a profile, treated as a statistical sample, reveal modes of variability that are related to what is expected for feed mark deformations? Radial cutting vibration, axial cutting vibration, ploughing, and side flow as modes of variability are revealed in Article Two (Chapter 4). In the same paper, the modes are idealized and can be digitally subtracted from rough-ness profiles, in order to express the percent contributions of the modes to arbitrary roughness parameters.
• Validation that the mode associated with radial cutting vibration is indeed fully ac-counted for by radial vibration. This is achieved in Article Three (Chapter 5).
There follows a chapter on the graphical software implementation of the techniques devel-oped, intended as a support tool for production. That software tool also includes the abilities to estimate microgeometrical stress concentration with an automated finite element model, and the ability to generate and display n-dimensional response surfaces from designed exper-iments.
The General Discussion chapter discusses the work of the above chapters as they relate to one another and in hindsight. It also discusses unsuccessful approaches, the main scientific results, the practical software tool developed, and the limitations of the study.
The conclusion summarises the work. Finally, the novelty of the work is stated in the Original Contributions chapter.
CHAPTER 2
LITERATURE REVIEW
This thesis concerns the development of the ability to submit a single linear roughness profile from a cylindrical, hard finish turned metal part to computer-automated decomposition of feed marks, so as to extract the quantitative contributions of the signatures of specific cutting dynamics to arbitrary amplitude-based roughness parameters.
The literature reviewed below covers the following. Beginning wide to broach the subject, surface integrity is discussed to introduce the relevance of surface roughness to manufacturing operations, and in particular the advantages of using linear roughness profiles in a production scenario. There follows a discussion of the existing microgeometry inspection methods. From inspection it is then natural to discuss microgeometry specification.
Those topics aptly frame the much narrower context of decomposition of feed marks, and the specific phenomena that influence feed mark morphology. Importantly, literature is very scarce on decomposition of feed marks, the topic most important to this thesis.
2.1 Hierarchy of Context
Surface integrity is a high-level category of manners of describing manufactured surfaces. Surface integrity includes microgeometry, and microgeometry is itself a parent notion to the sharply limited body of work on feed mark morphology. Here, we approach the importance of surface integrity to manufacturing from a top-down approach, painting surface integrity as having twofold purpose: monitoring of the stability of manufacturing processes, and gaging of part performance in service. The discussion narrows to linear roughness profiles and analysis of feed marks.
In historical perspective, it is typical (Jawahir et al., 2011; Astakhov, 2010; Griffiths, 2001) to credit M. Field and J.F. Kahles for developing “surface integrity” as a technical term (Field and Kahles, 1964; Field et al., 1972), defining surface integrity very broadly as the condition of a surface produced by any means. Field et al., working from a machining standpoint, considered specific mechanisms which alter parent bulk material when machining metals. As I.S. Jawahir et al. remarked in a substantial 2011 CIRP keynote paper (Jawahir et al., 2011) on surface integrity, Field et al. identified “plastic deformation, microcracking, phase transformations, hardness variations, tears and laps related to built-up edge formation, [and] residual stress distribution”, among other mechanisms affecting the integrity of newly
machined surfaces. Indeed, in the same keynote paper (which also treats surface integrity from material removal processes), the very broad definition of surface integrity offered by Field et al. is embraced rather than challenged, calling for collaboration between researchers and application specialists and for recognition of the multidisciplinarity of the issue of surface integrity.
In the vein of multidisciplinarity, B. Griffiths lists (Griffiths, 2001, page 2) relevant ex-ample disciplines, related by their influence on surface integrity (in the context of manufac-turing): chemistry, mechanics, tribology, metrology, physics, metallurgy, manufacturing, and design. In the form of part properties, those disciplines are echoed with specific examples by V.P. Astakhov in J.P. Davim’s “Surface Integrity in Machining” (Astakhov, 2010), including surface finish, resistance to fatigue, to corrosion, and to wear, and properties of adhesion, diffusion, optics, absorptivity, adsorption, bonding, friction, washability, wettability, and any other aspects relevant to any particular case.
However, for all the agreement (far beyond the texts cited above) on the vastness and multidisciplinary of surface integrity, it is common for definitions of surface integrity to differ in a particular and significant way. For illustration, Astakhov’s definition expresses explicitly that for a characteristic of a surface to be considered an aspect of its surface integrity, it must affect the surface’s performance in service. This definition is contradicted by G.P. Petropoulos et al. in the following chapter (Petropoulos et al., 2010, page 38) of the same book (!). Petropoulos explains that traditionally, surface texture (which is within the scope of surface integrity), has been used to monitor the stability of manufacturing processes such as tool wear, machine vibration, and machine damage, rather than to gauge the functional performance of manufactured parts. In effect, the Astakhov-type definition is too restrictive, because part performance does not run the show alone, industry-wide. The recognition of both process monitoring and part performance as distinct motivators for the analysis of surface integrity broadens the importance of surface integrity in manufacturing. Indeed, process monitoring and part performance are both motivators for the work in the current thesis.
The distinction is operationally meaningful. For academic researchers, surface integrity for part performance appears to be a hot topic (and has been for some time): it is ver-dant with industrially applicable research avenues for models of microstructure, of surface roughness, of the wettability of plasma-treated wood, and so on. As an example for part performance, Petropoulos notes that Ra does function as in index of various incarnations of
part performance, but other parameters greatly augment it. For example, he reports that profile skewness is an indicator of tribological performance, and Zahavi et al. discuss profile valley curvature as an important indicator for fatigue life performance (Zahavi et al., 1996,
page 183). Compounding the limited correlability of Ra to part performance, in the 1990
NIST Surface Finish Metrology Tutorial (Vorburger and Raja, 1990), Vorburger et al. point out that Ra is not even an intrinsic property of a surface profile, and varies as a function
of sampling length1. Surface integrity, and in particular surface microgeometry, is therefore
important in many cases to part performance. Furthermore, though the temptation appears to be to reduce surface microgeometry to a single scalar value, estimation of part performance may greatly benefit from the use of a more specialized parametrization of surface roughness than Ra.
In stark contrast, and for good reason, it is discouraged for mechanical designers to require very demanding sets of surface requirements; exotic and simultaneous requirements may be prohibitively difficult to achieve on the manufacturing side of an operation, and must furthermore typically be verified by quality control (often in a non-destructive manner!). For these reasons, design requirements are typically limited to roundabout parameters that the designers deem adequate, archetypally surface roughness parameter Ra and appropriate
statistical limits on surface discontinuities (Zecchino, 2003). Manufacturers will then monitor those relatively simple parameters and little else as indicators of the stability of manufacturing processes. That is to say, the convenient, limited surface descriptors do enable process monitoring, despite doing little in terms of gaging part performance directly.
The operationally-motivated distinction between the use of surface integrity for process monitoring and for part performance is widespread and manifestly useful. Nevertheless, the distinction evaporates when reframing integrity as dependent neither uniquely upon the manufacturing process nor upon the manufactured part, but upon the process, the part, and their interaction, which may be termed the machine tool-tool-workpiece system (Quintana et al., 2009, page 108). For analysis of the physics of surface generation, the machine tool-tool-workpiece system frame, being more comprehensive, may be the more appropriate frame. To narrow the context, investigation of a part’s surface microgeometry may yield in-formation relating both to part performance (fatigue performance (Zahavi et al., 1996) e.g. tears, laps, geometrical stress concentration, and tribological performance (Petropoulos et al., 2010, page 51)(Greenwood and Wu, 2001; Brown, 2012) e.g. oil retention capability, surface roughness profile skewness Rsk) and to process stability (condition of the cutting tool e.g.
workpiece tears and laps, and the condition of the spindle e.g. statistical ergodicity between
1 Most roughness parameters from a profile sample are influenced by the sampling method. Very common and egregious, lack of understanding of profile spatial frequency filtering (ISO/TS 16610-29:2006, 2006), commonly done automatically by roughness measuring machines, skews roughness results, both in industry and academia. An unfiltered profile also suffers, as soon as the profile is corrected for inclination between the axis of stylus travel and the nominal surface of the part (hence the influence of sampling length, sampling interval, and resolution (Whitehouse, 2011, page 94))! See also footnote 14.
surfaces2 and stationarity3 of roughness parameter R
a). These examples and sub-examples
are by no means a strict nor exhaustive categorization.
Narrower still, measurement of linear roughness profiles is often quick (compared, for example, to metallographic cuts), inexpensive (in terms of materials, personnel-time, and required training), and non-destructive4.
Focusing upon the subject of this thesis, linear roughness profiles of turned parts are composed of feed marks. As stated above, the aim is to treat roughness profile structure at the feed mark level in order to estimate the quantitative contributions of mechanisms active during the cut to arbitrary surface roughness parameters. What literature exists on the topic is discussed further below.
2.2 Microgeometry Inspection
This thesis develops a method of describing the surface microgeometries of parts to aid the machining specialist in controlling cuts. A brief discussion of roughness profile acquisition is therefore warranted.
Inspection of microgeometry begins with visual and tactile inspection. A machining spe-cialist may tell without tools if a surface is wavy, rougher than expected, subject to readhered material, scratched, microstructurally altered or damaged by chatter. A magnifying lens and a portable roughness gauge or roughness measuring machine may often be enough for pre-liminary inspection. Detailed and quantitative inspection of roughness requires instruments. Two classes of instruments exist: contact and non-contact. Significantly, the work of this thesis is applicable to linear roughness profiles obtained by any method.
Contact methods are simpler and more common and rely on contact between the mea-sured surface and a stylus (with or without a skid5). To orient the reader, a common detec-tor scheme is shown in Fig. 2.1. D.J. Whitehouse explains in his Handbook of Surface and Nanometrology (Whitehouse, 2011) the involved details of analysis of contact stylus methods, especially for surfaces that deform elastically or plastically when touched. For this research
2“Ergodicity between surfaces” means that the results of repeated operations under the same nominal conditions are consistent.
3A process is said to be statistically stationary if statistical parameters describing it (e.g. surface roughness parameter Ra) are stable i.e. do not follow any trends. Mathematically, a process is stationary if the probability distribution governing its stochastic component is invariant.
4Although usually considered non-destructive, the use of a contact stylus to measure surface roughness may in some cases be considered a destructive measurement by mechanically damaging a very finely finished surface. Non-contact alternatives exist, such as laser confocal microscopy and other optical means.
5A skidless contact stylus has only the stylus in contact with the measured surface. A skid eliminates some long spatial wavelengths by resting on the surface around the stylus, so that the roughness measurement at any lateral position is always made relative to the immediate surroundings. A skid also reduces vibrations, for example from the cantilever arm of the stylus.
proposal, surface deformation during measurement is neglected, as the metals used are hard (>45 HRC) and stylus contact is gentle. Considerations such as stylus tip radius and angle are treated according to ISO standards (ISO 4287:1997, 1997) (save for some liberties in frequency filtering). Whitehouse comments on the damage a stylus or skid may cause to a surface, which in practice, for machining of hard metals, even for fatigue-sensitive appli-cations, is neglected. Whitehouse also details signal artifacts caused by the measurement apparatus, which again, are so so subtle as to be neglected for the purposes of this thesis6. The experiments in this thesis make use of contact topographical measurements in order to scan over several millimeters; methods such as atomic force microscopy are too slow or im-practical for characterization of feed marks, and such methods are also quite rare in machine shops, which would limit the applicability of the results. Contact methods may also be used to generate areal maps (3D topography) of a surface by rastering.
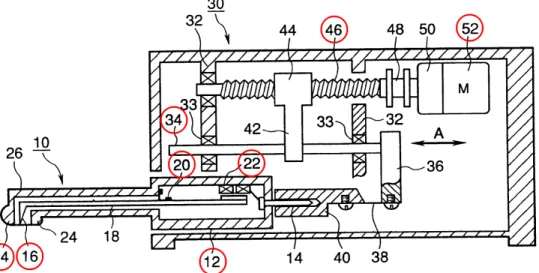
Figure 2.1: Figure 22 of a patent (Fujii and Shirai, 2000) owned by Mitutoyo Corporation illustrating common elements of a skidded contact stylus roughness measuring machine detector. The stylus 16, housed behind skid 24, pivots on fulcrum 20, and its motion is picked up by magnetic inductance-type detectors 22. Motor 52 feeds detector case 12 along
feed screw 46 and sliding shaft 34. Signal processing accounts for gain calibration, stylus radius compensation, and other errors. (Copyright information: As a US patent figure, this
image may be freely copied (USPTO, 2017), and this image does not appear to be subject to any other copyright.)
6Signal artifacts due to the apparatus are subtle, but more to the point, barely affect the decomposition of feed marks in this thesis. Signal artifacts generally produce aberrations in the frequency domain (Whitehouse, 2011), which average out over a statistical sample of feed marks, because the wavelengths of these aberrant frequencies are much shorter than the feed marks. In effect, the frequency domain measurement artifacts appear at “random” phases in individual space-domain feed marks, vanishing statistically for samples of many feed marks.
Non-contact methods are dominated by optical techniques, but other, more exotic meth-ods exist, listed by Whitehouse: capacitive, eddy current, pneumatic, and other methmeth-ods. Optical methods have the advantage of causing no damage to the surface and of produc-ing areal scans quickly. Interferometry and confocal microscopy in particular offer rapid, non-contact measurement of surface roughness, but, for the moment, optical measurement of surface roughness in machine shops is uncommon.
Electron microscopy deserves mention because microstructure and surface discontinuities of machined parts (such as tears, laps, scratches, and readhered material) are often evaluated using scanning electron microscopy (SEM), and the technique is utilized in production by some manufacturers. SEM provides a topographical7 assessment of a surface, but on a scale
too small to obtain linear roughness profiles with multiple feed marks at the scale studied.
2.3 Microgeometry Specification
Description of surface roughness is at the heart of this thesis concerned with quantifying cutting mechanism contributions to arbitrary roughness parameters. It is paramount to discuss how microgeometry is specified in the literature.
At the top level, machined surfaces often exhibit lay (Petropoulos et al., 2010, page 39), which is the primary direction of any anisotropic pattern. Surface texture may then be divided into “orders” of deviation from the nominal part geometry (adapted from Deutches Institut Fuer Normung (national German standardization institute) (DIN 4760, 1982) and Petropoulos):
• Macrogeometric deviations: they are due to machine tool errors, deformation of the workpiece, erroneous setups and clamping, vibration and workpiece material inhomo-geneities (Benardos and Vosniakos, 2003)(Klocke and Kuchle, 2011, page 11).
– 1st order: Form errors (flatness, roundness, straightness, cylindricity, etc.).
– 2ndorder: Waviness. To obtain the waviness profile, a long-pass filter and a
short-pass filter are applied to a raw surface profile waveform (ISO/TS 16610-29:2006, 2006).
• Microgeometric deviations: 3rd- and 4th-order deviations are often caused by the cutting
process; 5th- and 6th-order deviations are due to physico-chemical processes on the
crystal grain and lattice scales (Benardos and Vosniakos, 2003). Penetration of the tool into the workpiece may cause grooves; the higher orders are primarily random and are linked to the chip formation process (Klocke and Kuchle, 2011, page 11).
– 3rd order: Grooves. This would include traces of chip formation and the helical
feed mark on a turned part and other sorts of tool marks.
– 4th order: Cracks, for example as a result of thermal contraction after cutting.
– 5thorder: Polycrystalline structure, including crystallization mode, corrosion, and
other chemical alterations of the order of crystal grains. – 6th order: Lattice-level crystalline structure.
Surface finish is the superposition of the orders of deviations. This thesis is primarily con-cerned with feed marks, which are 3rd-order deviations (grooves), and the higher-order
devi-ations within (up to 5th order).
For profile analysis, it is often desirable to separate 1st- and 2nd-order deviations from the other orders (see Fig. 2.2). The ISO standards for surface roughness treat those low orders as “waviness”, and treat the high orders, together, as “roughness”8 (ISO 4287:1997, 1997). The following is written with respect to the ISO standards.
Separation of waviness and roughness is done very simply by filtering of spatial frequen-cies. The raw, as-measured profile is treated to remove form (by simple subtraction), and a low-pass frequency filter is applied to remove whatever high frequencies do not represent the surface due to the measurement process. ISO filters are Gaussian9, and this initial filtering
is done from wavelength λs. Correction may also be performed for stylus radius10 and other
experimentally-induced aberrations. The result is the “primary profile”, which is appropriate for analyses where additional filtering would destroy relevant information (such as evaluation of cracks, for example using the deepest valley in the profile as a parameter, or estimation of microgeometrical stress concentration for fatigue). The primary profile may then be filtered again at cutoff wavelength λc to separate the long wavelengths from the short ones: the
longer ones are the “waviness”, and the shorter ones the “roughness”.11
Frequency filtering is typically followed by evaluation of roughness parameters. Rough-ness profiles are treated in a variety of ways, including many arithmetic and statistical (ISO 4287:1997, 1997), motif (ISO 12085:1996, 1996), areal (ISO 25178-2:2012, 2012), and frac-tal (Petropoulos et al., 2010) parameters, wavelet analysis (ISO/TS 16610-29:2006, 2006),
8The ASME standards make the waviness-roughness distinction, too (ASME B46.1 - 2009, 2009). ISO and ASME standards are commonly used in North America for evaluation of surface finish.
9Gaussian frequency filters are symmetrical filters chosen to limit windowing artifacts. In particular, they are “non-oscillatory” and prevent Fourier ringing. (Allen and Mills, 2004, page 652)
10Because the surface of the part is not flat and the stylus probe tip has a nonzero size, the angle of incidence between the stylus tip and the surface causes an error.
11Other methods of separating roughness and non-roughness exist. Wavelet transforms and the motif method (discussed below) are alternative means of creating a reference line to be subtracted from the measured profile. Other authors have proposed methods for specific circumstances: X. Rimpault et al. in our own research group have proposed a method for the difficulties the plies in laminated composites cause to roughness profiles (Rimpault et al., 2016).
Figure 2.2: Simplified process for generating the primary, waviness, and roughness profiles
Fourier transformation, and autocorrelation (Petropoulos et al., 2010), among others. They are not related to the means by which the surfaces were manufactured. Table 2.1 lists some common arithmetic and statistical parameters.12
Table 2.1: Some arithmetic and statistical parameters of roughness profiles
Ra The arithmetical mean absolute deviation from the profile mean line. The most com-mon roughness parameter for machined parts.
Rq Serving the same function as Ra, Rq sums quadratic deviations and is more sensitive to extremes.
Rsk Skewness. Represents how positive (or negative) the profile deviations are about the mean line. Sometimes significant to oil retention.
Rku Kurtosis. Represents how concentrated the profile deviations are around the mean line. Relevant to friction.
Rv The absolute value of the maximum profile valley depth. Relevant to fatigue.
Rz Maximum profile height as of ISO 4287:1997. This is a source of confusion, as the older definition (10-point mean) is well-established and widely used.
RzJ IS The ten-point mean, commonly referred to as Rz (JIS B 0601-2001, 2001). Relevant to fatigue and tribology.
RSm Mean width of the profile elements. Used for feed mark spacing, for example. Rdq Root mean square slope. Relevant in some optical applications.
Linear profiles can also express material distribution. The cumulative distribution (inte-gral) in the z-direction (perpendicular to the nominal surface) of the linear profile is called the bearing area curve and has its own, if less commonly used, scalar descriptive parameters. The bearing area curve is of particular importance for cases where oil retention for surfaces in contact is of interest.
Motif parameters are an alternative to frequency filtering13 (ISO 12085:1996, 1996). D.J.
12These roughness parameters have areal equivalents for 3D topographies, for which an S is substituted for the R (ISO 25178-2:2012, 2012). Primary and waviness profiles may be treated similarly, in which case a P or W is substituted for the R, respectively.
Whitehouse (Whitehouse, 2011, page 41) describes the appeal of motifs as being adaptive (“intrinsic”) to surfaces rather than prescriptive as frequency cutoffs are. Used mainly by the French automotive industry, the motif method deconstructs profiles into “motifs”, which are patterns identified using a set of rules; it is a form of pattern recognition. It may also (Dietzsch et al., 1998) be described as a good method for surfaces with unknown nominal microgeometry, for inquiries into the envelopes of surfaces, and for surfaces with waviness and roughness that are difficult to separate by frequency filtering due to similar wavelengths. For applications where envelope is more meaningful than mean line, motifs may be a better choice than frequency filtering.14
Like motifs, fractal or “chaotic” parameters are “intrinsic” to surfaces. According to Whitehouse (Whitehouse, 2011, page 94), the interest in treating roughness with fractal anal-ysis is to produce scalar roughness parametrizations with reduced dependence on metrological measurement method. Fractal dimension (a measure of structure complexity) and topothesy (a measure of structure scale) are usually cited (Petropoulos et al., 2010; Whitehouse, 2011) as fractal parameters for roughness, each with multiple methods of mathematical evaluation from a profile. The reason for the existence of multiple methods is the nature of experimental roughness profile measurements as discrete, digital signals, which enable only approximations of fractal parameters. Though interesting, fractal roughness parameters are as far as we know unrelated to the mechanisms of surface generation, and are also, by themselves, incomplete descriptions of surfaces, lacking absolute indications of amplitude and lateral spacing. Fur-thermore, Whitehouse believes, on the basis of fracture mechanics, that chaotic treatment of roughness is unjustified for processes involving plastic flow.
Complementary to the above methods, Fourier transformation and autocorrelation show the degree of periodicity of a roughness profile (Petropoulos et al., 2010). The power spec-trum plots the profile in the frequency domain, with periodic components differentiating themselves as peaks from nonperiodic components. The autocorrelation function is an alter-native representation of the degree of periodicity in a profile.
Assessments of periodicity also lack information on profile non-stationarity. Grzesik and Brol described the continuous wavelet transform (CWT) as an alternative to Fourier trans-formation by transforming the profile not to a basis of sinusoids, but to a basis of wavelets, and can detect disturbances and non-stationary behavior in profiles of turned parts (Grzesik and Brol, 2009). Wavelet analysis of roughness profiles is also an alternative method of
de-14 A comment complementing footnote 1: the motif and fractal analysis methods are examples of profile parametrizations that are more “intrinsic” to surfaces than others, avoiding some of the difficulties with sampling. The problem reduces to subtracting nominal part geometry or microgeometry from the measured profile; stated as such, motif and fractal methods are subject to the problem too (though resistant), not immune to it as some authors (Whitehouse, 2011, page 41)(Petropoulos et al., 2010, page 48)(Sahoo et al., 2011, page 4) suggest.
termining the profile reference line (non-roughness additive component of the profile) (Chen et al., 1999).
In addition, it is worth mentioning that scalar roughness parameters reduce roughness profiles to a finite set of scalars, simplifying description but necessarily destroying informa-tion; although not considered a roughness parameter, a plot of the surface roughness profile itself may be a useful addition to any roughness report, and may reveal problems with ma-chine tool axis motion, workpiece bending, failure to engage the tool, tool failure, or any other unexpected eventuality.
It may be concluded that literature on parameters quantifying cutting dynamics from linear roughness profiles is very limited. It has of course been mentioned that introducing “custom” parameters should be done cautiously to avoid superfluous or erroneous methods (Tabenkin, 2001). Naturally, many alternative roughness parameters have been proposed for various purposes. Grzesik and Brol suggested roughness parameters relating to the vertical and lateral displacement and elongation of feed marks of imposed nominal shape, especially in relation to plastic flow (see Section 2.4). The work of this thesis is designed in part to avoid creating spurious new roughness parameters that will be difficult to apply in practice in the communication between manufacturer design and production teams.
2.4 Decomposition of Feed Marks
In this work, we consider surface roughness of hard finish turned parts. Specifically, we exploit the fact that a single linear roughness profile that crosses the helical tool trace multiple times contains “snapshots” in time of the state of the cut. That statistical sample can be leveraged to quantify process dynamics. “Dynamics” here is intended in a broad sense, including not only vibration but also plastic side flow, ploughing, and all other mechanisms that exhibit a dynamic stability, rather than static contribution to post-machining part microgeometry. Dynamometers and accelerometers measuring during the cut are widely used by researchers, but analysis of feed mark morphology is very sharply limited, and is the concern of this thesis. A matter of scope, it is important to note that the topic here is decomposition of feed marks, which should be distinguished from the modeling of machining. Decomposition es-timates the influence of machining effects from a roughness profile, whereas modeling of turning, much more common, starts from machining effects to simulate surface generation. Benardos and Vosniakos authored an important review paper on predicting roughness (Be-nardos and Vosniakos, 2003).
Work closely related to this thesis includes that of F. Ancio et al., who have been able to reconstruct part microgeometry from online readings of cutting tool acceleration, beginning
with a paper in 2012 (Ancio et al., 2012) and developed further in 2014 (Ancio et al., 2015). In 2013, Ancio et al. introduced the use of principal component analysis on roughness profiles of machined parts (Ancio et al., 2013), demonstrating that a superposition of a few patterns suffices to describe most of the roughness of the surfaces studied. In 2016, Ancio et al. suggesting a methodology for principal component analysis on turned parts (Ancio et al., 2016). Significantly, they suggested that cutting traces contain information about the physical processes generating machined surfaces, which includes vibrations and material responses. They did not publish in detail on feed mark morphology.
W. Grzesik has also published on the relationship of cutting effects and intra-feed mark surface roughness morphology. In 2011, W. Grzesik and S. Brol published a simple method for describing feed marks (Grzesik and Brol, 2011), consisting of fitting parabolas to linear profiles. That method is sometimes justified for round-nosed cutting tools, but is somewhat limited in finish hard turning where plastic effects may dominate even the scallop-shaped ideal tool nose trace. Grzesik and Brol used that method to measure the vertical and lateral displacements of feed marks and feed mark elongations, expressing belief that those defor-mations relate to plastic side flow, spring-back, cutting edge preparation, cutting edge wear, and other considerations. Importantly, Grzesik and Brol acknowledge that roughness profiles contain information about the surface-generating physical mechanisms. Crucially, Grzesik and Brol also expressed the belief that the relative depths of feed marks are due to material response. While true, in the current thesis it is demonstrated that the radial component of tool vibration is a direct, clear, and sufficient explanation for variation in feed mark depth across a roughness profile.
In J.P. Davim’s Metal Cutting: Research Advances, W. Grzesik and S. Brol published a chapter (Grzesik and Brol, 2010) about generation and modeling of surface roughness. The paper describes surface roughness generation as a dynamic process of material removal and elastic-plastic deformation, with the analytical nominal shape of feed marks based on tool geometry and minimal undeformed chip thickness. The chapter also discusses plastic flow and numerical treatment of other effects such as cutting edge preparation. The chapter also introduces plastic flow, shown in Fig. 2.3 and other elements15.
Importantly, no literature at all was found detailing how a computer can find the feed marks in a linear roughness profile without assuming some manually input feed mark shape. More subtle and just as important, expecting a particular feed mark shape does not indicate where, laterally, feed marks begin and end, due to deformations (particularly plastic) not accounted for by nominal feed mark shape.
15The other elements discussed are a numerical treatment of the influence of cutting edge preparation and a treatment of feed mark decomposition as in the previously discussed paper by Grzesik and Brol (Grzesik and Brol, 2011). Also shown is a visualization of feed mark disturbances by continuous wavelet transform.
Figure 2.3: Plastic flow in turning and a model of its effect on roughness profiles. The images are redrawn from Grzesik and Brol (Grzesik and Brol, 2010). a) Side flow. b)
Distortion of the surface profile (dashed line).
2.5 Cutting Dynamics
Typically, authors will dub only the effects of vibrations and forces “cutting dynamics”. In this thesis, the term should suggest all processes that are inconstant in time that affect the interface between tool and workpiece. This thesis considers vibrations (radial and axial), and plastic flow (side flow and ploughing).
Vibrations affect tool wear and tool failure, surface finish, residual stresses, microstruc-ture, chip formation, and machine spindle wear. It is therefore of interest to quantify the influence of vibrations during cutting; doing so directly from a linear roughness profile rather than an accelerometer or dynamometer would be convenient. Fig. 2.4 illustrates the ma-chine tool-tool-workpiece system as a pair of oscillators. When considering the cross-sectional traces of the tool, as in a roughness profile, the number of degrees of freedom of the system may be reduced to two; the relative vibrational motion of the tool with respect to the work-piece is then two-dimensional, as suggested in Grzesik and Brol’s 2011 paper on feed mark decomposition (Grzesik and Brol, 2011), where they considered both the lateral and vertical displacements of feed marks.
Machining vibrations may be either free, forced, or self-excited (Cheng, 2008, page 10). The cause of self-excited vibrations is internal to the process (for example, interrupted chips, or stick-slip), and self-excited vibrations usually result in chatter. A cut with chatter is not considered a stable process, and so for the current thesis, self-excited vibrations are neglected. Free vibrations in turning may be caused by material inhomogeneity, by external agitation of the machine tool base, or other one-time excitations, and dissipate. Forced vibrations are different in that their energy source persists in time. As examples, an unstable spindle, uneven workpiece surface geometry, interrupted cutting (in the case of milling), or other time-dependent forces. For this thesis, the important remark is that in two-dimensional
Figure 2.4: A model of the vibrational dynamics of the machine tool-tool-workpiece system. Note that vibration into the page is not depicted but of course exists. The components have effective masses and are subject to the elastic and damping responses. The damped-elastic
model corresponds to the elastic-plastic behavior of the workpiece, and the gap shown between tool and workpiece is imaginary. The diagram is inspired by a figure in Machine Tool Vibrations and Cutting Dynamics by B.C. Gegg et al. (Gegg et al., 2011, page 103).
roughness profiles, vibrations should influence feed mark depth and lateral displacement. The quantitative import of vibration on surface microgeometry could therefore be estimated from the morphologies of the feed marks in a linear roughness profile.
As noted in Section 2.4, decomposition of feed marks should be distinguished from mod-eling the influence of dynamics on surface roughness. Although it is not directly involved in the work in this thesis, modeling of roughness from dynamics is common and should be mentioned. Benardos and Vosniakos (Benardos and Vosniakos, 2003), in their review paper on prediction of surface roughness, note some classes of approach: analytical machining the-ory, experimental investigations, designed experiments, and artificial intelligence. They note Ehmann and Hong’s (Ehmann and Hong, 1994) 1994 paper modeling tool runout, machine deformation, and higher-order kinematics to the estimation of surface finish. In 1998, Lin and Chang’s (Lin and Chang, 1998) kinematic simulation demonstrated the radial compo-nent of vibration as much more significant to the resulting roughness profile than the other components. Other works have built on simulation of microgeometrical surface generation for vibration, developing models involving simulation of the milling cutter, workpiece, machine spindle, and so on. In particular, and important to this thesis, superposition of microgeom-etry from multiple simultaneous mechanisms appears to be valid (at least sometimes) (Kim and Chu, 1999). Note also that extensive modeling of workpiece, tool, machine, and so on may be warranted in some industrial cases, but that realistic modeling is time-consuming and expensive.
For the influence of vibrations on feed marks, F. Ancio et al.’s 2014 paper (Ancio et al., 2015) deserves special mention, and is discussed in Section 2.4.