UNIVERSITÉ DE MONTRÉAL
DESIGN METHODOLOGY FOR INTEGRATED DOWNSTREAM
SEPARATION SYSTEMS IN AN ETHANOL BIOREFINERY
NAVID MOHAMMADZADEH ROHANI DÉPARTEMENT DE GÉNIE CHIMIQUE ÉCOLE POLYTECHNIQUE DE MONTRÉAL
MÉMOIRE PRÉSENTÉ EN VUE DE L’OBTENTION DU DIPLÔME DE MAÎTRISE ÈS SCIENCES APPLIQUÉES
(GÉNIE CHIMIQUE) JUIN 2014
UNIVERSITÉ DE MONTRÉAL
ÉCOLE POLYTECHNIQUE DE MONTRÉAL
Ce mémoire intitulé:
DESIGN METHODOLOGY FOR INTEGRATED DOWNSTREAM
SEPARATION SYSTEMS IN AN ETHANOL BIOREFINERY
présenté par : MOHAMMADZADEH ROHANI Navid
en vue de l’obtention du diplôme de : Maîtrise ès sciences appliquées a été dûment accepté par le jury d’examen constitué de :
M.PERRIER Michel, Ph.D, président
M.LEGROS Robert, Ph.D, membre et directeur de recherche M.STUART Paul, Ph.D, membre et codirecteur de recherche Mme SAVULESCU Luciana Elena, Ph.D, membre
ACKNOWLEDGEMENTS
This work was completed with support from the Natural Sciences and Engineering Research Council of Canada (NSERC) Environmental Design Engineering Chair at École Polytechnique.
I would also like to express my gratitude in particular toward, Prof. Paul Stuart, Prof. Robert Legros without whom this work would have never been accomplished.
I would like to thank Dr.Jean-christophe Bonhivers who helped me understand Bridge method and guided me in using and implementing his method.
RÉSUMÉ
Les enjeux de sécurité d’approvisionnement énergétique et de protection de l’environnement ont mené à une augmentation significative de production de biocarburants. La réussite de ce choix stratégique dépend, entre autres, de la rentabilité et de la viabilité à long terme des unités de production. Les biocarburants de seconde génération, par exemple l’éthanol, sont souvent produits à partir de matière ligno-cellulosique. Ils sont plus difficiles à produire que ceux de première génération car (1) des étapes coûteuses supplémentaires sont nécessaires pour la séparation des différents constituants de la biomasse avant fermentation, (2) et la concentration en produit quittant le réacteur de fermentation est plus faible, ce qui augmente les difficultés pour la purification.
Dans une bio-raffinerie produisant de l’éthanol, les coûts relatifs à la purification du produit quittant le réacteur de fermentation sont significatifs. L’opération classique de purification inclut un ensemble de colonnes de distillation. Cependant, la nature non-idéale du mélange eau-éthanol, qui forme un azéotrope à 95 % en poids d’éthanol, complique cette opération. Une étape additionnelle de déshydratation est ainsi nécessaire afin d’obtenir de l’éthanol pur à 99.5 % en poids. Plusieurs techniques ont été proposées afin de résoudre les difficultés inhérentes aux équilibres liquide-vapeur des mélanges éthanol-eau. Ces techniques, telles que l’utilisation de membranes ou l’extraction par solvant organique, visent non seulement à obtenir de l’éthanol pur mais aussi à réduire la consommation d’énergie.
Réduire la consommation d’énergie lors de la production est de première importance pour la viabilité de l’industrie des biocarburants. L’intégration de procédé, telle que définie par Ressources Naturelles Canada, est une approche système pour l’analyse et la synthèse de procédés afin de minimiser la consommation en énergie, eau et matières premières. L’utilisation de cet outil peut permettre aux bio-raffineries d’économiser de l’énergie et augmenter leur rentabilité. Les techniques d’intégration de procédé ont été adoptées avec succès par plusieurs industries ; elles sont basées sur l’utilisation optimale des sources en énergie, eau et matières premières disponibles dans le procédé afin de satisfaire les demandes et ainsi réduire la consommation externe.
Du point de vue de l’industrie papetière, qui doit faire face à une demande en produit déclinant avec le temps, à une compétition globale et à des prix de vente peu élevés, l’intégration de
technologies de bio-raffinage dans des usines de production de pâte kraft peut être une option intéressante, leur permettant de diversifier le portfolio de produits et d’entrer sur de nouveaux marchés. Les systèmes d’utilités existants, le savoir-faire en génie et en gestion de la chaîne logistique, ainsi que des opportunités d’intégration énergie et matière entre une usine de pâte et une unité de bio-raffinage peuvent offrir des avantages compétitifs et améliorer la performance économique de l’industrie papetière. Par conséquent, l’intégration énergie est une possibilité qui doit être considérée par l’industrie du bio-raffinage forestier.
L’objectif de ce travail est de développer une méthodologie pour la conception de systèmes de purification du produit de raffinage et de la tester sur une étude de cas, une unité de bio-raffinage produisant de l’éthanol. Plusieurs techniques de purification ont été évaluées selon trois scenarii : (1) sans intégration énergie, (2) avec intégration énergie à l’intérieur du système de purification et (3) avec intégration énergie entre le système de purification et une usine de pâte kraft. Les consommations en énergie, les coûts d’investissement ainsi que les performances économiques ont été évalués pour chaque technique de purification et chaque scénario d’intégration. La meilleure des options a finalement été identifiée selon des critères technico-économiques.
Les possibilités d’intégrations ont été identifiées avec la méthode de pincement pour le deuxième scénario, et avec la méthode pontale pour le troisième scénario car ce dernier requiert une analyse pour la rétro-installation du réseau d’échangeur de chaleur du procédé kraft.
Les résultats révèlent l’importance de l’intégration énergie pour réduire la consommation énergétique et améliorer la performance des unités de production de bio-raffinage. Ils montrent également que le système classique de purification d’éthanol conduit à de meilleurs résultats après intégration énergie que les autres techniques de purification. Les techniques alternatives peuvent impliquer des risques technologiques supplémentaires et ne mènent à aucun avantage de consommation énergétique lorsque l’intégration interne ou externe avec une usine de pâte kraft est incorporée dans le modèle d’affaires.
Il est important de souligner que la méthodologie développée dans le cadre de cette maîtrise peut être étendue pour évaluer les performances énergétiques et économiques de l’ensemble d’un procédé de bio-raffinage.
ABSTRACT
Energy security and environmental concerns have been the main drivers for a historic shift to biofuel production in transportation fuel industry. Biofuels should not only offer environmental advantages over the petroleum fuels they replace but also should be economically sustainable and viable. The so-called second generation biofuels such as ethanol which is the most produced biofuel are mostly derived from lignocellulosic biomasses. These biofuels are more difficult to produce than the first generation ones mainly due to recalcitrance of the feedstocks in extracting their sugar contents. Costly pre-treatment and fractionation stages are required to break down lignocellulosic feedstocks into their constituent elements. On the other hand the mixture produced in fermentation step in a biorefinery contains very low amount of product which makes the subsequent separation step more difficult and more energy consuming.
In an ethanol biorefinery, the dilute fermentation broth requires huge operating cost in downstream separation for recovery of the product in a conventional distillation technique. Moreover, the non-ideal nature of ethanol-water mixture which forms an iseotrope at almost 95 wt%, hinders the attainment of the fuel grade ethanol (99.5 wt%). Therefore, an additional dehydration stage is necessary to purify the ethanol from its azeotropic composition to fuel-grade purity.
In order to overcome the constraint pertaining to vapor-liquid equilibrium of ethanol-water separation, several techniques have been investigated and proposed in the industry. These techniques such as membrane-based technologies, extraction and etc. have not only sought to produce a pure fuel-grade ethanol but have also aimed at decreasing the energy consumption of this energy-intensive separation. Decreasing the energy consumption of an ethanol biorefinery is of paramount importance in improving its overall economics and in facilitating the way to displacing petroleum transportation fuel and obtaining energy security.
On the other hand, Process Integration (PI) as defined by Natural Resource Canada as the combination of activities which aim at improving process systems, their unit operations and their interactions in order to maximize the efficiency of using water, energy and raw materials can also help biorefineries lower their energy consumptions and improve their economics. Energy integration techniques such as pinch analysis adopted by different industries over the years have
ensured using heat sources within a plant to supply the demand internally and decrease the external utility consumption.
Furthermore, from the stand-point of a pulp and paper mill and considering the declining demand, volatile price, high energy cost and fierce global competition, it looks as a promising option to integrate a biorefinery technology with the core business in order to diversify the product portfolio and enter new markets. Existing utility systems, engineering know-how and feedstock supply network as well as mass and energy integration potentials between mills and new processes foster competitive advantage for pulp and paper mills to adopt implementing biorefineries to improve their economic performances.
Therefore, adopting energy integration can be one of the ways biorefinery technology owners can consider in their process development as well as their business model in order to improve their overall economics.
The objective of this thesis is to propose a methodology for designing integrated downstream separation in a biorefinery. This methodology is tested in an ethanol biorefinery case study. Several alternative separation techniques are evaluated in their energy consumption and economics in three different scenarios; stand-alone without energy integration, stand-alone with internal energy integration and integrated-with Kraft. The energy consumptions and capital costs of separation techniques are assessed in each scenario and the cost and benefit of integration are determined and finally the best alternative is found through techno-economic metrics. Another advantage of this methodology is the use of a graphical tool which provides insights on decreasing energy consumption by modifying the process condition.
The pivot point of this work is the use of a novel energy integration method called Bridge analysis. This systematic method which originally is intended for retrofit situation is used here for integration with Kraft process. Integration potentials are identified through this method and savings are presented for each design. In stand-alone with internal integration scenario, the conventional pinch method is used for energy analysis.
The results reveal the importance of energy integration in reducing energy consumption. They also show that in an ethanol biorefinery, by adopting energy integration in the conventional distillation separation, we can achieve greater energy saving compared to other alternative techniques. This in turn suggests that new alternative technologies which imply big risks for the
company might not be an option for reducing the energy consumption as long as an internal and external integration is incorporated in the business model of an ethanol biorefinery. It is also noteworthy that the methodology developed in this work can be extended as a future work to include a whole biorefinery system.
TABLE OF CONTENTS
ACKNOWLEDGEMENTS ... III RÉSUMÉ ... IV ABSTRACT ... VI TABLE OF CONTENTS ... IX LIST OF TABLES ... XII LIST OF FIGURES ... XIII LIST OF ABBREVIATIONS ... XVI LIST OF APPENDICES ... XVII
INTRODUCTION ... 1
CHAPTER 1 LITERATURE REVIEW ... 5
1.1 Lignocellulosic Ethanol - drivers and demand ... 5
1.1.1 Ethanol production - history ... 7
1.1.2 Ethanol production process ... 7
1.1.3 Energy efficiency and downstream separation ... 9
1.2 Alternative separation techniques ... 14
1.3 Integration ... 21
1.3.1 Energy efficiency studies in downstream separation of lignocellulosic ethanol biorefineries ... 22
1.3.2 New opportunities for Kraft mills ... 23
1.4 Energy efficiency methods ... 24
1.5 Gaps in the body of knowledge ... 28
CHAPTER 2 METHODOLOGY ... 29
2.2 Pinch analysis ... 31
2.3 Energy transfer diagram (ETD) ... 31
2.4 Heat exchanger network design ... 32
2.5 Integration through Bridge method ... 32
2.6 Capital cost estimation (CAPEX) ... 33
2.7 Operating cost estimation (OPEX) ... 33
2.8 Economic analysis ... 33
CHAPTER 3 RESULTS ... 35
3.1 Results ... 35
3.1.1 Design cases ... 35
3.2 Stand-alone designs without integration ... 35
3.2.1 Double-effect extractive distillation ... 37
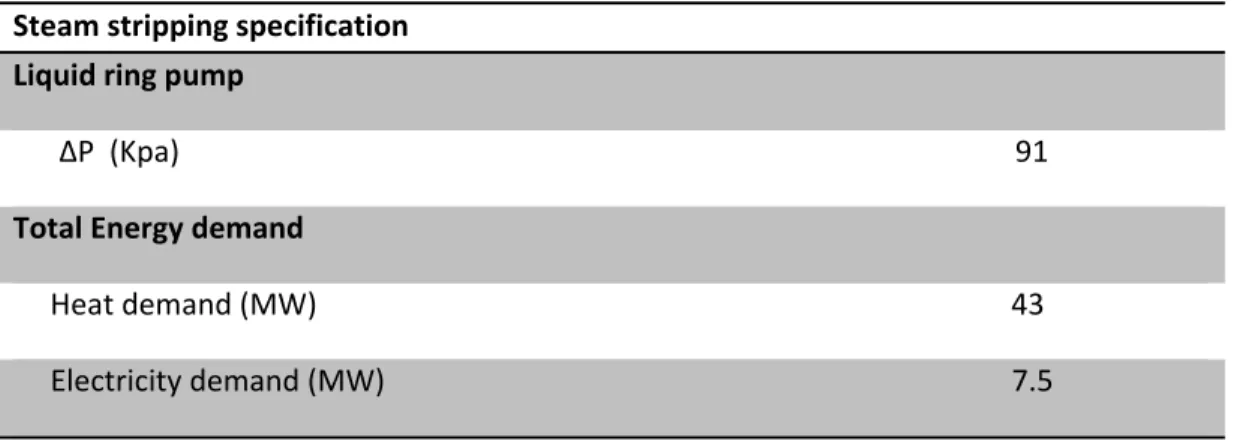
3.2.2 Steam stripping ... 40
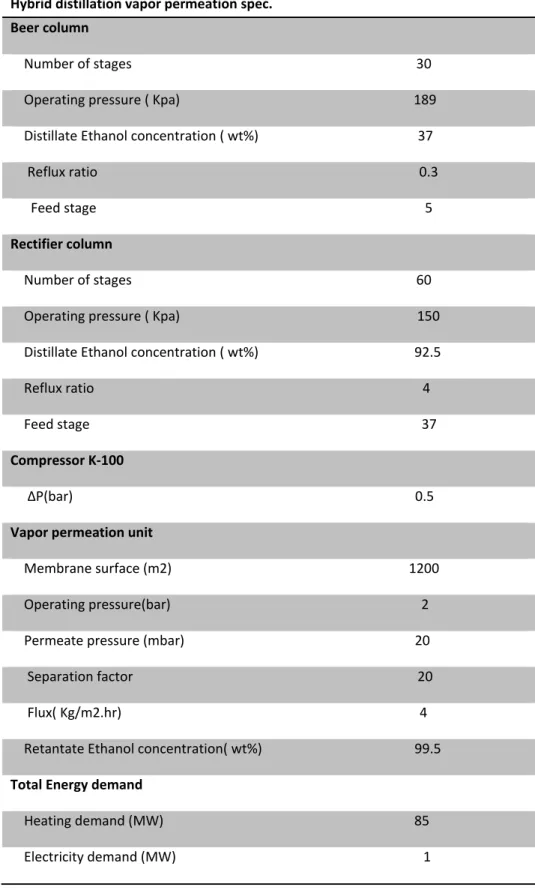
3.2.3 Hybrid distillation-vapor permeation ... 42
3.2.4 Energy analysis in stand-alone without integration ... 45
3.2.5 Economic analysis in stand-alone without integration ... 46
3.3 Stand-alone designs with internal integration ... 47
3.3.1 Base case ... 47
3.3.2 Double-effect extractive distillation ... 51
3.3.3 Steam stripping ... 55
3.3.4 Hybrid distillation-vapor permeation ... 59
3.3.5 Energy analysis in stand-alone with internal integration ... 62
3.3.6 Economic analysis in stand-alone with internal integration ... 63
3.4.1 The Kraft mill used in this study ... 65
3.4.2 Integration through Bridge analysis ... 66
3.4.3 Energy analysis in integrated-with-Kraft ... 68
3.4.4 Economic analysis in integration with Kraft ... 70
3.5 Final conclusion ... 70
3.6 Developed methodology ... 74
CHAPTER 4 GENERAL DISCUSSION AND RECOMMENDATION ... 77
4.1 General discussion ... 77 4.2 Recommendations ... 78 4.3 Concluding words ... 79 4.4 Future work ... 81 REFERENCES ... 82 APPENDICES... ... 89
LIST OF TABLES
Table 3.1 : The operating condition of the base case ... 37
Table 3.2 : Operating conditions of double-effect extractive distillation ... 39
Table 3.3 : Operating conditions of steam stripping ... 41
Table 3.4 : Operating conditions of hybrid distillation-vapor permeation design ... 44
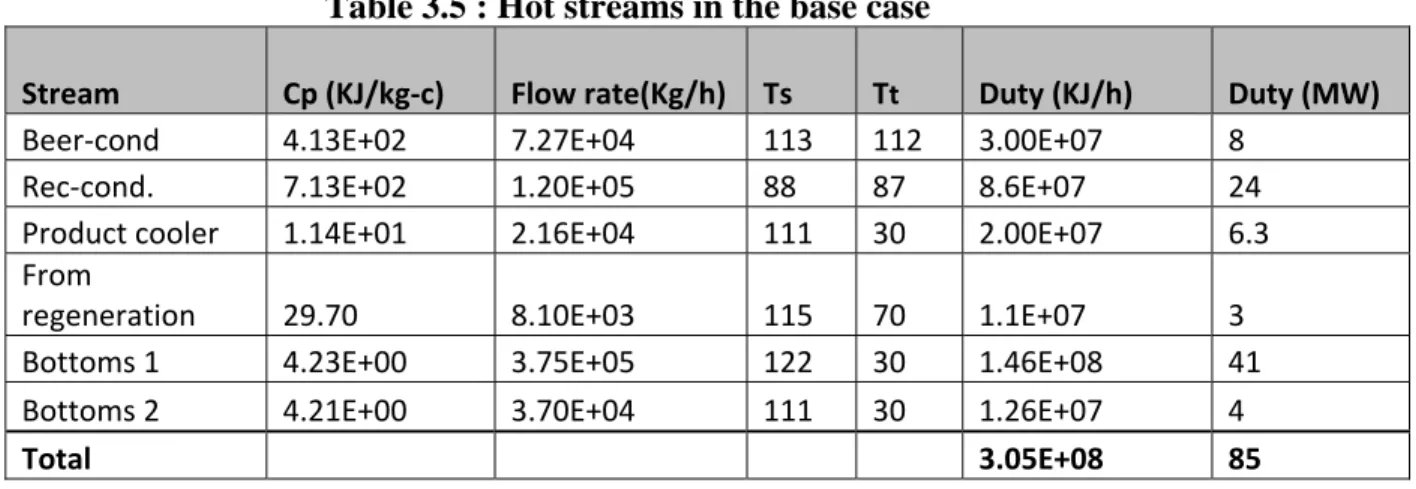
Table 3.5 : Hot streams in the base case ... 48
Table 3.6 : Cold streams in the base case ... 48
Table 3.7: Extractive distillation hot streams ... 52
Table 3.8 : Extractive distillation cold streams ... 52
Table 3.9 : Hot streams in the Steam stripping ... 56
Table 3.10 : Cold streams in the steam stripping ... 56
Table 3.11 : Hot streams in Hybrid distillation-vapor permeation ... 59
Table 3.12 : Cold streams in hybrid distillation-vapor permeation ... 60
LIST OF FIGURES
Figure 1-1 : Drivers for second-generation biofuel development (Eisentraut 2010) ... 6
Figure 1-2 : Block diagram of different lignocellulosic ethanol pathway ... 8
Figure 1-3 Cumulative emission reduction according to 4 mitigation models (Pachauri and Reisinger 2007) ... 10
Figure 1-4 : CO2 saving potential from energy efficiency measures (Jollands, Waide et al. 2010) ... 11
Figure 1-5 : Ethanol-Water equilibrium curve ... 12
Figure 1-6 : Schematic diagram of the downstream separation of an ethanol biorefinery ... 13
Figure 1-7 : Recovery mode in alcohol production from enzymatic pathway a) End-of-pipe b) Slip-stream ... 14
Figure 1-8 :Pressure swing distillation schematic in a low-boiling azeotrope (Mazzotti 2005) .... 15
Figure 1-9 Steam stripping process for recovering alcohol ... 17
Figure 1-10 : Membrane pervaporation and vapor permeation systems (Vane 2013) ... 19
Figure 1-11 : Liquid-Liquid extraction process ... 21
Figure 1-12 : Hot and composite curves (Dornfeld 2010) ... 26
Figure 1-13 : Energy transfer diagram concept a- Heat is conserved and degraded in process operations b- Heat saving in HEN is equal to maximum of process operation c- Situation after HEN retrofit (Bonhivers, Korbel et al. 2014) ... 27
Figure 2-1 : Step-wise project methodology ... 30
Figure 2-2: Process modification through ETD. Decreasing minimum heat consumption by altering the pressure of distillation column PO2 (Bonhivers, Korbel et al. 2014) ... 32
Figure 3-1 : Flow diagram of Ethanol-Water downstream separation (the base case) ... 36
Figure 3-2 Flow diagram of double-effect extractive distillation ... 38
Figure 3-4 : Flow diagram of hybrid distillation-vapor permeation ... 43
Figure 3-5: Energy consumption comparison diagram in stand-alone without integration ... 45
Figure 3-6 :Total annualized cost in stand-alone without integration ... 47
Figure 3-7 : Base case composite curves a- Actual temperature b- the grand composite curve .... 49
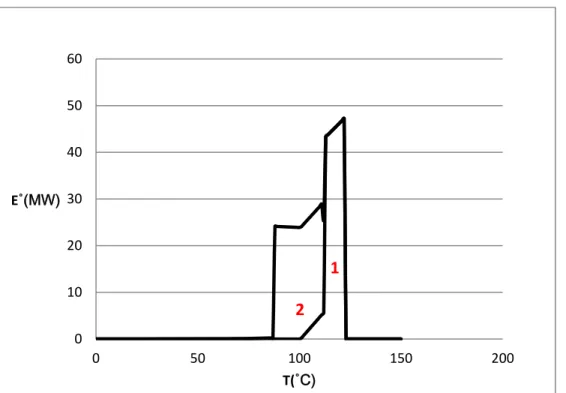
Figure 3-8: Energy transfer diagram of the base case; 1- Beer column 2- Rectifier column ... 50
Figure 3-9 : Heat exchanger network of the base case design ... 51
Figure 3-10 : Extractive distillation composite curves a- Actual temperature b- The grand composite curve ... 53
Figure 3-11 : Energy transfer diagram of the double-effect extractive distillation design, 1- Recovery column 2- Extractive column 3- Beer column2 4- Beer column 1 ... 54
Figure 3-12 : Heat exchanger network of the double-effect extractive distillation design ... 55
Figure 3-13 : Double-effect extractive distillation composite curves a- Actual temperature b- The grand composite curve ... 57
Figure 3-14 : Energy transfer diagram of steam stripping; 1- Rectifier column 2- Stripper ... 58
Figure 3-15 : Heat exchanger network of Steam stripping ... 59
Figure 3-16 : Energy transfer diagram of the hybrid distillation-vapor permeation 1- the beer column 2- the rectifier column ... 60
Figure 3-17 : Hybrid distillation-vapor permeation composite curves a- Actual temperature b- The grand composite curve ... 61
Figure 3-18 : Heat exchanger network of vapor permeation ... 62
Figure 3-19 : Energy consumption in Stand-alone with internal integration ... 63
Figure 3-20 : Total annualized cost in stand-alone with internal integration ... 64
Figure 3-21 : A typical Kraft process (Tran and Vakkilainnen 2008) ... 65
Figure 3-22 : Energy consumption in integrated-with-Kraft ... 69
Figure 3-24 : Grid diagram of the model mill ... 72
Figure 3-25 : Energy consumption in three scenarios ... 73
Figure 3-26 :Total annualized cost in three scenarios ... 73
LIST OF ABBREVIATIONS
A Annuity factor BC Beer column
CCC Cold composite curve
ET Enterprise transformation ETD Energy transfer diagram EG Ethylene glycol
FBR Forest biorefinery GCC Grand composite curve GHG Greenhouse gas
HCC Hot composite curve HEN Heat exchanger network
IFBR Integrated forest products biorefinery IRR Internal rate of return
MER Maximum energy recovery
MINLP Mixed integer linear programming P&P Pulp and paper
PI Process integration ROI Return on investment TAC Total annualized cost VLE Vapor-liquid equilibrium
LIST OF APPENDICES
APPENDIX A ECONOMIC DATA ... 89 APPENDIX B SIMULATION DETAILS ... 104
INTRODUCTION
Background
Despite the rapid growth of biofuel production all around the world, serious issues regarding the sustainability of this production has required the industry to rethink its pathway and seek new type of feedstocks. The concerns over sustainability enumerated by IEA(2010) as competition with food chain, effects on the environment and climate change which are mostly caused by using food crop feedstocks have led to the production of so-called second generation biofuels. Second-generation feedstocks such as forest biomass, forest residues, agricultural waste etc. contain sugar molecules which can be subsequently converted to transportation fuels and at the same time address the sustainability concerns. Programs such as RFS which was initially enacted in 2005 in the US, mandates production of 36 billion gallons of second-generation biofuels by 2022 which emit fewer greenhouse gases than the petroleum fuels they replace.
Research-and-development activities on second-generation biofuels so far have been mostly limited to a number of developed countries and in some large emerging economies like Brazil, China and India. Second-generation biofuels are not yet widely produced commercially, but a considerable number of pilot and demonstration plants have been set up in recent years, and research activities are being undertaken mainly in North America, Europe and a few emerging countries. Production of second generation ethanol from sugars contained in the lignocellulosic feedstocks has been investigated in many academic works. Different approaches have been sought to make this type of feedstock more amenable for ethanol production. Fractionation of lignocellulosic materials and separation of its sugar contents have proven a difficult and capital intensive procedure in contrast with the first-generation feedstocks. Moreover, the dilute nature of produced fermentation broth has made the purification stage of the second-generation ethanol an energy intensive step.
The aforementioned problems and in particular the energy intensity of purification of the second-generation bio ethanol requires new techniques as well as a comprehensive engineering approach to resolve the problems.
Problem statement
Recovering ethanol from fermentation broth and purifying it to fuel grade is difficult and energy intensive because of the dilute nature of the fermentation broth and the constrained water/ethanol vapor liquid equilibrium (VLE) with an azeotrope at about 95 wt% ethanol. Simple distillation is not able to recover ethanol above the azeotropic composition.
The ethanol concentration in the fermentation mixture ranges around 15 wt% ethanol from corn (Côté, Noël et al. 2010) compared to about 3 to 6 wt% for cellulosic ethanol. Recovering and purifying ethanol from fermentation broth in corn-ethanol requires about 70 % of the total steam generated in the dry milling plant. While the separation energy demand for corn-ethanol is high, the separation energy demand for cellulosic ethanol is even higher due to the huge increase in the distillation energy demand with the decrease in the concentration of ethanol in the fermentation broth. Consequently downstream separation could represent the whole energy consumption of a biorefinery.
In practice, the conventional technology used in the fuel ethanol industry to produce fuel ethanol is distillation close to the azeotropic composition followed by dehydration in a molecular sieve-based adsorption unit. Molecular sieves are not a popular separation choice due to their cyclic nature of sorption-regeneration process, inefficiency in high flow rates and additional energy requirement which they inflict to the system and high capital cost.
The difficulty and energy intensity of this separation has led to several R&D research and academic investigations in the hope of finding more cost-effective techniques to accomplish this task.
Among the researched techniques are found Azeotropic distillation, membrane, Pressure swing, Liquid-liquid extraction, etc. Technologies such as membrane, extractive distillation and steam stripping have been reported to achieve acceptable reduction in energy consumption as an alternative for ethanol-water conventional separation system.
On the other hand, second-generation biorefineries have a lot in common with pulp and paper industry. The type of feedstock, pre-treatment methods and supply chain similarities as well as synergies for energy integration offer an outstanding opportunity for a biorefinery to be built in proximity of a pulp and paper facility. From energy standpoint, there are several heat sources in a
biorefinery and pulp and paper facility which can potentially exchange heat and reduce the need for an external utility consumption.
Furthermore from economic perspective, integration with existing pulp and paper facilities could potentially generate competitive advantage for lignocellulosic ethanol production. This synergy is furthered by the growing interest from pulp and paper industry to expanding their product
portfolio in the face of recent economic crisis which has plagued this sector and the decline in demand of pulp and paper products(Moshkelani, Marinova et al. 2013).
Objective
The problem statement calls for the development of a systematic design methodology to reduce the energy consumption of a bio-ethanol downstream separation by identifying the potentials for energy integration and selecting the best alternative among the separation options.
This general objective could be divided into following sub-objectives:
To identify potential process modifications in process units by using energy transfer diagram (ETD)
To identify the opportunities for energy integration with Kraft process through sets of bridges identified in heat exchanger network
To conduct an overall techno-economic analysis and explore the trade-off between energy reduction savings and capital investment
Hypothesis
The energy consumption of the downstream separation system of an ethanol biorefinery could be significantly reduced by applying energy integration approaches and this will prove economical. This general hypothesis could be divided into following sub-hypotheses.
Using a new retrofit approach in integration with Kraft process will identify the heat recovery potentials and will reduce energy consumption
The energy reduction achieved in the conventional separation is superior to an alternative technology
A systematic approach in designing integrated downstream separation systems can identify heat recovery potentials and increase the integration opportunities
Thesis organization
This thesis is organized as follows: In chapter 1, the relevant literature is reviewed in order to identify the gaps in the body of knowledge. Chapter 2 presents the project methodology and the steps taken in order to achieve the objective of this thesis. Chapter 3 introduces the case studies and presents the results and final methodology developed in this work. In chapter 4, a general discussion and recommendations are presented. Appendices A and B present the economic and simulation data respectively.
CHAPTER 1
LITERATURE REVIEW
1.1 Lignocellulosic Ethanol - drivers and demand
The industry of converting abundant lignocellulosic biomass to biofuels as transportation fuel is undergoing a fast expansion driven by policy, environmental concerns, economic profit, and energy security. Over the past decades, governments have been seeking renewable energy technologies in order to reduce their dependency on volatile fossil fuel market. Converting biomass to biofuels is one of the most studied processes because of the necessity of finding alternative renewable fuels.
Developed regions such as United States, Canada, and the European Union have been pursuing support policies in biofuel development. Brazil, China, India, South Africa, Thailand, and others have also adopted support policies for biofuels (Eisentraut 2010).
According to Renewable Fuel Association (RFA) (2010), the U.S daily fuel ethanol demand has increased from 350 to 695 barrels from 2006 to 2009. The average monthly demand of fuel ethanol was approximately 900 million gallons in the US in 2009(2010) .
Another reason to use bioethanol is its contribution in the reduction of greenhouse gases (GHG). Reports from United Nations Environment Programme (UNEP) in 2009 and also IEA in 2010 indicate that more than 70% GHG reduction is estimated for bioethanol produced from
biomass(Eisentraut 2010), (Group and Management 2009).
The life cycle energy analysis report from different feedstocks were evaluated by the National Renewable Energy Laboratory (Spatari, Bagley et al. 2010) .Their results show that ethanol from forest residues can bring about 94% energy reduction in fossil and 72% in petroleum
consumption and also ethanol from corn can foster a 43% reduction in energy input in fossil and 88% in petroleum.
The first generation fuel ethanol is mainly produced from corn in the US ,sugar cane in Brazil and rapeseed in the EU (Eisentraut 2010) . Similar to corn ethanol, fermentation can be used to produce fuel ethanol from cellulosic feedstock (Cardona Alzate and Sánchez Toro 2006),(Meredith 2003).
The IEA developm developin Figure 1-A (2010) in ment (See Fi ng second ge -1 : Drivers their repor igure 2.1). A eneration bio s for second-rt summariz As can be se ofuels. -generation ed the main een in this F n biofuel dev n drivers for Figure, suppo velopment ( r second-ge ort policies a (Eisentraut eneration bio are at the co 2010) ofuels ore of
1.1.1 Ethanol production - history
Contrary to popular belief, ethanol is an old transportation fuel. In the beginning of automotive history certain type of cars could run on ethanol. During the First World War, demand for fuel increased thus ethanol production continued to grow. However after Second World War there was a shift towards gasoline as the main choice of transportation fuel. Ethanol was still used as octane booster in this era. After discovery of tetraethyl lead, this lead-enhanced gasoline was shown to be cheaper than ethanol to produce amid persistent concerns over its health impacts. When tetraethyl lead was phased out in the U.S in the mid-80, the use of MTBE as an octane booster and volume extender grew increasingly. In the early 21 century there was a boom in ethanol production in the U.S. due the ban of MTBE in several states and the requirement of Energy Policy Act (2006) in adding oxygenated molecules such as ethanol to gasoline (Solomon, Barnes et al. 2007).
In Brazil in almost the beginning of 20th century, a mandatory blend of 5% was enacted in order to reduce dependence on foreign imported fuels and also to use excess of ethanol production from sugar industry. In the 90’s the rate of blend which had enjoyed an increase in prior years fell from 20% to 10% as government withdrew its subsidy policies. In 2003 and after introduction of flex-fuel cars into Brazilian automotive market, Ethanol gained even more interest and the demand increased higher (Nogueira, Seabra et al. 2008).
In order to meet the expected demand of ethanol in the future, many new plants are needed and, in turn, new feedstocks are required. Almost 50% of the total biomass found on earth is lignocellulosic biomass and in order to meet the growing demand for sustainable ethanol, a shift from 1st generation feedstock to 2nd generation one is necessary. The main challenge identified in producing ethanol from 2nd generation feedstock is the difficulty of breaking down the lignocellulosic biomass to its constituting sugars (Galbe, Sassner et al. 2007).
1.1.2 Ethanol production process
As opposed to ethanol from first generation feedstocks which are rich in sugar, lignocellulosic feedstocks require more complex steps to turn into ethanol. At first step lignocellulosic biomass should be broken down and its polysaccharide contents should be liberated. Next these polymeric
sugars ar hydrolysi undergo hydrolysi Ethanol i P T co de te (W T lo ac an re hydrolyse is namely ac a pre-treatm is such step s subsequen Figure re-treatmen he common oncentration etrimental to emperatures Wooley 1999 he yield of ower temper cid, neutral nd Zacchi 20 d to monom cid or enzym ment step in is not nece ntly recovere e 1-2 : Block nt and hydr acid used in n. At low con o sugars wh could be ap 9) . sugars in e rature and p and alkaline 002). meric ones. T matic. If enz order to ma essary. Mon d and purifie k diagram o rolysis n hydrolysis ncentration, hile at highe pplied but re enzymatic hy performance e have been Two differen zymatic path ake polysac nomeric suga ed up to the of different is sulphuric higher temp er concentrat covering aci ydrolysis is of enzyme introduced nt pathways hway is ado charides rea ars are ferm desired puri lignocellulo c acid. Acid peratures wi ation which id and corro higher than s. Other pre and used fo s are shown opted, the fe ady for the mented to eth ity. osic ethanol could be us ill be needed results in h osion are the
n the acid h e-treatment or enzymatic in Figure 1 eedstock nee enzymes. In hanol afterw l pathway sed at high o d which cou high yields, l e main down hydrolysis d methods su c pathway (G .2 for eds to n acid wards. or low uld be lower nsides due to uch as Galbe
Fermentation
If the hydrolysis and fermentation are done separately, optimal conditions can be achieved for both of them; however the product inhibition is a big issue for enzymatic hydrolysis. This challenge could be partly alleviated in simultaneous fermentation and hydrolysis (SSF) but recycling the yeasts used in fermentation is a disadvantage. In second generation ethanol compared to 1st generation, the solid content is lower and this has a
negative impact on the purification step.(Wooley 1999) Ethanol purification
Ethanol and water forms an azeotrope at around 96 wt% ethanol at atmospheric pressure. There are different ways to break up an azeotropic mixture such as changing the pressure or adding a solvent to the mixture. The more common way in industry is to use a molecular sieve to dehydrate ethanol to the desired purity. After fermentation step a sequence of distillation columns are used to purify the ethanol up to azeotropic composition. This chain of distillation normally includes two or three columns. In the first which is called beer column, ethanol is removed from bulk water, solid residues and unfermented materials and in the following columns which is called rectifier is purified up to azeotropic concentration.(Vane 2008)
1.1.3 Energy efficiency and downstream separation
IEA (2010) defines energy efficiency as “delivering more services for the same energy input or the same services for less energy input”. Energy efficiency is a way of managing and limiting the growth in energy consumption which offers a powerful and cost-effective tool for achieving a sustainable energy future.
Improvements in energy efficiency can reduce the need for investment in energy infrastructure, cut energy bills, improve health, increase competitiveness and improve consumer welfare. Environmental benefits can also be achieved by the reduction of greenhouse gases emissions and local air pollution. Energy security can also profit from improved energy efficiency by decreasing the reliance on imported fossil fuels.
IPCC (20 greenhou 650 ppm Figure 1 Reisinge As can be greenhou IEA in a sectors w almost 1. efficiency 007) in their use gas emis (See Figure
-3 Cumulat r 2007)
e seen in Fig use gas emiss an update re which if imp .5 times curr y measures, r synthesis r ssions which 1.3). tive emissio gure 1.3, imp sions and ac eport (2010) plemented, c rent US ann up to 32% c report of 200 h aimed at s on reduction proving ener hieving sust , recommen ould save a nual CO2 em carbon dioxid 07, evaluate stabilizing c n according rgy efficienc tainability. nded 25 ene s much as 7 missions. As de saving co ed four diffe arbon dioxid g to 4 mitiga cy can play ergy policy r 7.6 gigatonn figure 1.4 s ould be achie erent measur de emission ation model an importan recommenda nes (Gt) CO2 suggests, by eved in indu
res for mitig n concentrati ls (Pachaur nt role in red ation in diff 2/year by 20 y applying en ustry sector. gating ion at ri and ducing fferent 030 – nergy
Figu al. 2 In an Eth grade is d the challe ethanol (s Simple d conventio close to adsorptio ure 1-4 : CO 2010) hanol bioref difficult and enging water see Figure 1 distillation c onal technol the azeotr on unit (Vane O2 saving p finery, recov d energy inte r-ethanol vap .5). cannot be u logy used in opic compo e 2008). potential fro vering ethan ensive becau por liquid eq used to dist n the fuel eth
osition follo
om energy e
nol from ferm use of the dil
quilibrium (V till ethanol hanol indust owed by de efficiency m mentation b lute nature o VLE) with a above the a try to produ ehydration measures (Jo broth and pu of the ferme an azeotrope azeotropic c uce fuel etha
in a molec ollands, Wai urifying it to entation brot e at about 96 composition anol is distill cular sieve-b ide et o fuel th and 6 wt% . The lation based
The ethan ethanol ( Alzate an Meredith case of c While th requirem energy de (Côté, No In practic from dist distillatio nature of system a nol concentr Côté, Noël nd Sánchez T h (2003) esti corn from et he separation
ent for cellu emand whic oël et al. 201 ce as mentio tillation is d on columns f sorption-re and high ca Figure 1 ration in the et al. 2010) Toro 2006),( imates that r thanol need n energy d ulosic ethan h in turn is 10). oned before, dried to fuel ,molecular generation p apital cost ( 1-5 : Ethan e fermentatio compared t (Meredith 20 recovering a s about 70 emand for nol is even the result of
for the prod ethanol by a sieves are n process , add (Vane 2008 nol-Water eq on mixture v to about 3 to 003) . and purifyin % of the st corn from higher due f low ethano duction of fu adsorption w not a popul ditional ener ). Figure 1 quilibrium c varies from o 6 wt% for ng ethanol fr team genera ethanol is to the huge ol concentrat fuel-grade et with hydroph lar separatio rgy requirem .6 schemati curve about 10 to r cellulosic from fermen ated in the d high, the s e increase i tion in the fe thanol, the a hilic molecu on choice du ment which t ically illustr 15 wt% for ethanol (Car ntation mixtu dry milling p eparation en in the distill ermentation azeotropic et ular sieve. U ue to their c they inflict t rates the ge r corn rdona ure in plant. nergy lation broth thanol Unlike cyclic to the eneral
configuration of ethanol-water separation system. In some cases an optional side stripper in rectifier can be added to the system (Summers 2006), (Kwiatkowski, McAloon et al. 2006)
Figure 1-6 : Schematic diagram of the downstream separation of an ethanol biorefinery
Distillation is a common separation technique in biofuel industry. Advantages such as high alcohol recovery, scalability, adequate energy efficiency at moderate concentration (i.e >10 wt%) make distillation an attractive option (Vane 2008).
On the other hand disadvantages such as Azeotrope formation which prevents the achievement of final desired dryness and high- energy requirement in alcohol concentration of less than 5 wt%, have pointed to the need for techniques that can overcome the azeotrope constraint and being simultaneously less energy-intensive. In lignocellulosic ethanol where ethanol concentration in the fermentation broth is low (<5 wt%), product inhibition is not an important issue thus end-of-pipe alcohol recovery techniques can be used to recover and dehydrate ethanol. If inhibition becomes an important issue like in the case of butanol or higher concentrated ethanol, an integrated fermentation and separation technique known as slip-stream recovery is required to remove the product before it reaches the inhibitory concentration which is lethal to micro-organism (Vane 2008). Figure 1.7 illustrates the recovery modes in enzymatic pathway.
Figure 1-7 : Recovery mode in alcohol production from enzymatic pathway a) End-of-pipe b) Slip-stream
1.2 Alternative separation techniques
The most often considered end-of-pipe alternative techniques to replace the conventional practice of ethanol-water separation generally fall into 4 general groups. These groups consists of techniques that include alteration to standard distillation, distillation-like techniques, membrane-based approaches and Liquid-Liquid extraction
Alteration to standard distillation
Several modifications can be made to a standard distillation unit to avoid azeotrope formation and improve VLE pattern of ethanol-water mixture. These include addition of solvents or salts to alter the VLE behavior of the mixture. Examples of solvents include ethylene glycol (EG), benzene and cyclohexane.
Heterogeneous azeotropic, extractive and pressure swing distillation fall into this group of alternatives. In Heterogeneous azeotropic distillation, an entrainer is added to the system which forms a low-boiling heterogeneous azeotrope allowing a relatively easy separation through two distillation columns and a decanter (Henley, Seader et al. 2011) .
In extra extractive compone et al. 201 In pressu different compone Figure 1. mixture. fresh feed high pres mole frac column 1 pressure D1 is sen D2 is rec Figure 1-Luyben separatio active distill e column w ents are reco
0).
ure swing dis pressures ar ents and the c
8 schematic The total fee d F and the r ssure curve. T ction at press 1 is at the mo (P1), but les nt to column ycled to Col -8 :Pressure et al. (201 n of an azeo ation, a hig which, alters vered in the stillation whi re used. Pres choice of co ally shows p ed F1 to colu recycled dist
The mole fra sure P1. The ole fraction x ss rich in A t 2. Almost p lumn 1. e swing dist 3) compare otropic mixt gh-boiling s the VLE a e overhead o
ich does not ssure selecti oling system pressure swin umn 1 which tillate D2 at action of the e bottoms of xD1 and is ri han the azeo pure B is obta tillation sche ed extractiv ture. Throug solvent is a and is later of extractive involve an e on for colum m in the cond ng distillatio h operates at mole fractio e total feed F column 1 is icher in A th otrope mole ained from b ematic in a ve distillatio gh a techno-added to the retrieved in and recover entrainer, tw mns depends denser (Henl on in a minim t lower press on close to az F1 (xF1) is ri s almost pure han the azeot fraction at h bottom of co low-boiling on and pres -economic a e azeotropic n the recove ry columns wo columns o s on VLE beh ley, Seader e mum-boiling sure (P1) is t zeotropic mo icher in A th e A. The dist tropic mole high pressure olumn 2, and g azeotrope ssure swing analysis extr c mixture in ery column. (Zaretskii, R operating at havior of the et al. 2011). g azeotropic the sum of th ole fraction han the azeot
tillate leavin fraction at lo e (P2). Distil d the distillat (Mazzotti 2 g distillation ractive distill n the . Key Rusak e he of tropic ng ow llate te 2005) n for lation
was identified as the superior option. However their analysis did not include the energy consumption and costs related to the beer column.
Marquardt et al. (2008) also evaluated several azeotropic distillation for the separation of ethanol and water in a systematic design framework. This framework proposes a three-step approach in which firstly different flow sheets are generated , next through shortcut methods which have been developed in their group, the flow sheets are evaluated and screened and in the final step and after a MINLP optimization the best alternative is identified. The proposed optimization program being the final step after two previous eliminatory steps has been reported to be quite straight-forward. Among several alternatives such as pressure swing, heterogeneous azeotropic distillation, pervaporation-distillation and extractive distillation, they found extractive distillation as the most energy-efficient option.
Bastidas et al.(2010) compared three dehydration techniques namely extractive distillation, heterogeneous azeotropic distillation and molecular sieve for the production of fuel-grade ethanol. Through an Aspen simulation and after calculating the operating and capital costs of each alternative, they identified extractive distillation to be the best option among all.
In other types of study, Errico et al. (2012) examined extractive distillation as the base case for dehydration of ethanol from fermentation and proposed a systematic method for the generation of new distillation sequences by employing the successful thermally coupling technique for ideal mixtures. They identified several variations of column sequences and concluded that operating and capital cost reductions are feasible through these new configurations.
In a similar study to the work of Errico, Van duc et al. (2013) retrofitted an extractive distillation to thermally coupled columns for an azeotropic mixture. Significant reduction in energy consumption was observed as a result of this modification.
Distillation-like techniques
Gas and steam stripping has been proposed for recovering alcohol from fermentation broth. Transferring the alcohol from a mixture to a gas stream is a relatively simple process.
In gas stripping, an inert gas or the carbon dioxide produced in the fermentor can be introduced to stripping column for removal of the alcohol. In a condensation stage after the stripper, the alcohol is recovered. It is obvious that stripping stage cannot remove the whole water and consequently
other separation steps are needed to fully dehydrate the alcohol. The advantage of gas or steam stripping is its ability to work at temperatures similar to those of fermentors. This finds importance in situations where toxicity inhibits higher yield like in butanol fermentation or ethanol at higher concentrations (> 10 wt%).
Taylor et al. (1995) after conducting a cost analysis has shown that the fermentor/stripper is possibly a lower-cost alternative to conventional fermentation and distillation for ethanol-water separation.
In another work Taylor et al.(2000) have reported a savings of $0.03 per gallon of ethanol produced by the stripping process. Steam stripping operates similar to gas stripping with the difference of feeding steam as the stripping agent. Figure 1.9 depicts the general configuration of steam stripping for recovering alcohol.
Figure 1-9 Steam stripping process for recovering alcohol
Vane (2008) breaks down the energy demand in a gas stripper and compares it with steam stripping for separation of fermentation broth. Due to non-existence of incondensable inert gas in steam stripping, the condensation of vapor stream can be done in higher temperatures resulting in lower condensation duty relative to gas stripping.
Membrane-based techniques
Membrane-based technologies have gained a substantial position in biofuel industry for recovery and dehydration of alcohol fuels from fermentation broth. The parameters based on which
membrane-based processes operate fall into two distinct categories; size and chemical potential. Processes which operate based on size include Ultra filtration, Micro filtration etc. Processes which function based on chemical differences between the components and membrane material includes Pervaporation and vapor permeation (Vane 2013).
The selective permeation of one of the key components in the mixture circumvents the vapor-liquid equilibrium (VLE) constraint. In pervaporation process, a vapor-liquid feed stream is brought to contact with one side of a non-porous membrane. A vacuum or a sweeping gas on the other side of the membrane creates the permeate vapor stream. Components of the feed due to difference in their sorption and diffusion behavior, selectively partition into the membrane, diffuse through it and evaporate into vapor permeate side. Vapor permeation follows the same principal with the exception that the feed to the membrane is a vapor (Henley, Seader et al. 2011). Figure 1.10 depicts pervaporation and vapor permeation processes and their differences. In vapor permeation process in contrast with Pervaporation, feed side temperature and pressure drop are insignificant since the feed is a pressurized vapor and goes through no phase change. This property of vapor permeation provided that the required driving force for separation is generated makes this process more energy efficient than other membrane systems like pervaporation (Fontalvo, Cuellar et al. 2005)
Organic and inorganic compounds are used to build membrane materials. Polymers such as PDMS (silicone rubber) are used to selectively pass inorganic material through the membrane in a water-inorganic solvent mixture. PDMS membranes are categorized as hydrophobic membranes. On the other hand polymers like PVA( polyvinyl alcohol) is used in dehydration step to selectively separates water from the mixture and are classified as hydrophilic membranes (Vane 2013).
Figure Many sci particular Yi He e biorefine applicatio the main membran past year Sander et azeotropi developm combined operation Sandet e processes to fuel-gr e 1-10 : Mem ientists have rly in downs et al. (2012 ning. They ons in a bior n advantage nes in dehyd s. t.al (1988) h ic mixture ment of a sp d in one co nal performa et al. (1991 s and molecu rade ethanol mbrane per e investigate stream separ ) have exa have iden refining cont es and disa dration step o have examine in a PVA pecial plate -ompact unit ance of the fi 1) in anoth ular sieve in l( ~99.5 wt% vaporation ed the role o ation. mined the ntified sever text. Low en advantages of fermentat ed the energ based mem -type memb t. They exa irst commerc er work co n dehydratio %) and repor and vapor of membran latest advan ral potentia nergy requir of membra tion broth ha gy consumpti mbrane syste brane modul amined the cial-scale pe ompared en on of ethanol rted a superio permeation ne-based tec ncements in als for usin
rement and m ane reported as received ion of produ em. In thei le and an in specific de ervaporation nergy consu l from azetr or performa n systems (V chnologies in n membrane ng membran membrane fo d by them. significant a ucing fuel-gr ir paper the ntegrated per sign criteria plant. umption of rope compos ance for mem
Vane 2013) n biorefining e technolog ne in variet fouling are am . Applicatio attention ove rade ethanol ey described rmeate cond a as well a membrane-b sition (~ 95 mbrane proce g and gy for ty of mong on of er the l from d the denser as the based wt%) esses.
However the molecular sieve in their study was regenerated by external steam supply rather being regenerated by purified ethanol.
Tsuyumoto et al. (1997) have reported a fuel-equivalent energy usage of 0.71 MJ per kilogram of ethanol in their hollow fiber-type membrane for dehydration of azeotropic mixture. However in their report they made no energy comparison with the conventional methods.
Kunnakorn et.al (2013) have compared azeotropic distillation of an ethanol-water mixture with a hybrid distillation-pervaporation process and shown that membrane option outperforms the azeotropic distillation in operating and capital costs.
Most energy and cost comparisons in alcohol dehydration have been made between hybrid distillation-membrane processes and ternary azeotropic distillation and in most of the cases membrane process have been reported to be more energy efficient.(Lipnizki, Field et al. 1999), (Humphrey and Siebert 1992), (Drioli and Romano 2001), (Noble and Stern 1995), (Kunnakorn, Rirksomboon et al. 2013).
Liquid-Liquid Extraction
Liquid-liquid extraction and perstraction have been investigated in several works mostly for in-situ removal of butanol from fermentation in order to decrease micro-organism inhibition (Groot, Van der Lans et al. 1992),(Ezeji, Qureshi et al. 2004), (Qureshi and Maddox 2005).
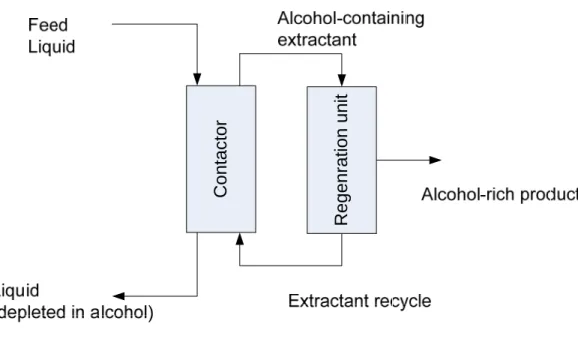
In liquid-liquid extraction, a liquid extractant is added to the fermentation broth and the alcohol as well as the water is transferred into the extractant. This contact could be done directly via a mixing device or through a packed-column contactor or indirectly via a porous membrane which the latter is often referred to as “Perstraction” (Henley, Seader et al. 2011).
In order to reuse the extractant, the absorbed compound should be removed in a following regeneration unit. Figure 1.11 schematically shows Liquid-Liquid extraction process.
Co
nta
c
tor
Regenration unit
Figure 1-11 : Liquid-Liquid extraction process
The choice of solvent selection has significant influence on the performance of liquid-liquid separation as well as on the energy efficiency of subsequent separation steps to recover the solvent and the product. The most commonly investigated extractants include long alkanes, long-chain alcohols, fatty acids and silicone oils. The concentration of alcohol after regeneration unit depends on the selectivity of the extractant for the alcohol. The alcohol after this step needs another purification level to reach fuel-grade purity (Vane 2008).
Ionic liquids have recently attracted attentions and shown superiority over solvent extraction (Fadeev and Meagher 2001).
1.3 Integration
In order to provide the energy demand of a new biorefinery, a new utility system including a cooling tower and a steam boiler must be built in a stand-alone design. From energy stand point it will be much more cost-effective if a biorefinery is set up in the proximity of a pulp and paper facility in order to use the existing equipment for satisfying its demand. Furthermore from economic perspective, the competitiveness of lignocellulosic ethanol production could potentially be improved if they were integrated with existing facilities. This synergy is furthered by the growing interest from pulp and paper industry to expanding their product portfolio (Moshkelani,
Marinova et al. 2013) . There are great opportunities in integrating a biorefinery with a pulp and paper facility which can provide a competitive advantage for the biorefinery. The examples of integration opportunities include using existing infrastructure and unit operations, recovering heat and employing existing skilled personnel (Moshkelani, Marinova et al. 2013), (Lundberg, Axelsson et al. 2012), (Fornell and Berntsson 2012).
1.3.1 Energy efficiency studies in downstream separation of lignocellulosic
ethanol biorefineries
Several studies over the past years have investigated the importance of energy efficiency in lignocellulosic ethanol production. Colura et al. (1988) investigated a few modified designs in evaporation and distillation of an ethanol facility to minimize energy consumption. Internal heat integration in distillation and in evaporation using heat pump and external heat integration between distillation and evaporation were considered. They concluded that heat pumping due to decreasing operating cost was a favorable option.
The energy efficiency of an ethanol production was reported to improve by using heat pump in distillation and evaporation units and also by optimizing the heat exchanger network of distillation train in the work of Ficarela et al (1999).
Several integration aspects were examined in the work of Galbe et al. (2002) including integration of distillation and multi-effect evaporation. They concluded that reducing energy demand creates opportunities for by-product sales and is vital for the economics of the process. The advantages of using a structured packing in the rectification column of an ethanol production facility was investigated in the work of Summers (2006). Lower pressure drop and thus lower temperature difference as the result of using this structure creates more opportunities for internal and external heat integration.
Integration with a district heating system which fostered more energy efficiency and reduced the operating cost was examined in the work of Sassner et al. (2007).
Haelssige et al. (2008) conducted a techno-economic analysis on 6 different fermentation-distillation strategies. One and 2-column fermentation-distillation series were considered with inclusion of heat pump in two of the schemes. They reported that 2 heat integrated columns and one column using a heat pump were the most favorable schemes.
1.3.2 New opportunities for Kraft mills
As mentioned earlier due to increasing competition in pulp and paper sector and simultaneous decline in the demand, a growing focus has been placed on utilizing different wood constituents to produce new products in order to diversify the product portfolio and improve the economics. In North American context, Van Heiningen (2006) stated the importance of producing bioenergy and biomaterial alongside the traditional pulp and paper products to remain competitive. He presented the concept of Integrated Forest Product Biorefinery (IFBR) which aims at producing value-added products such as biofuels, carbon fiber and biopolymers to generate more revenues for the core business.
The U.S Department of Energy (2007) published a report identifying building block chemicals which could be co-produced from wood constituents. They reported power, fuel and syngas production as the main potentials for lignin in near terms and micro-molecules and aromatics as longer-term applications of this substance.
Extracting hemi-cellulose prior to pulping and hydrolyzing in order to produce ethanol was investigated by Frederick et al. (2008). They concluded that their small scale process model resulted in high capital cost and that the price of raw material has a large impact on the economics of the process.
In another study retrofitting a pulp mill to produce ethanol instead of pulp was examined by Phillips et al. (2008). They concluded that this could be an interesting way to produce ethanol as they identified the potentials for using existing infrastructure and reducing capital cost.
In another study by U.S Department of Energy (2006), the possibility of producing biofuels from spent liquor in thermo-chemical pathway was investigated. The study identified a potential opportunity from this pathway if the technology is commercialized.
Chambost et al. (2008) identified several challenges such as key technological, financial, cultural and enterprise transformation (ET) risks related to implementation of forest biorefinery at existing pulp and paper mills. They proposed a three-phase implementation strategy which fosters cost reduction with fossil fuel replacement, revenue increase with production of new products and margin optimization through knowledge-based production. Product design and foundation concepts with regard to ET were also discussed in their study.
Wising et al. (2006) in their work highlighted the importance of process integration in identifying possible products which can be economically produced in a pulp and paper mill. They concluded that specifying possible products with regards to market demand, product margins, production flexibility and the supply chain in conjunction with examining and modelling the process and using cost accounting models for the mill should be strategically taken into account before embarking on a biorefinery pathway.
Another opportunity for pulp and paper facilities which is a corollary of integrating a biorefinery is reduction in energy consumption.
Axelsson et al. (2006) identified opportunities for saving 52-56 MW of steam through pinch analysis of a model mill. The same measures could be used in designing or retrofitting a biorefinery plant.
Schenck et al. (2007) evaluated the possibilities for heat integration in an ethanol process. The excess heat could be mutually used in a pulp and paper facility in an integrated plant or could decrease the utility consumption of the biorefinery in a stand-alone project.
Lundberg et al. in (2012) explored the integration of semi-neutral hemicellulose extraction in a Kraft pulp mill and have shown that it is possible to eliminate the need for additional steam through a rigorous heat integration with Kraft process. Finally they concluded that the success of biorefinery concepts is materialized by implementation of intensive energy integration and optimization measures.
Fornell et al. (2009) by applying conventional as well as process integration measures analyzed the energy efficiency of a pulp mill converted to an ethanol production plant and reported steam reduction of 36-42% as a result of integration.
1.4 Energy efficiency methods
The most common and widely-used method for energy integration in a plant is the famous pinch analysis developed by Linnhoff et al. (1982). Since its introduction until today, the pinch methodology has been used in a wide variety of processes and industries.
In this method hot and cold composite curves (HCC, CCC) which combine all the hot and cold streams of a plant are constructed, the potentials for heat saving are identified and minimum energy consumption is obtained. The heat saving is proportional to the minimum temperature difference between the hot and cold streams. Grand composite curve which is resulted from HCC and CCC represents the net heat flow in the system relative to temperature. GCC is used to determine the temperature level of utilities and also is used to evaluate the position of a process unit against the background process (Split GCC). The concept of pinch method has been schematically shown in Figure 1.12.
Pinch methodology over its lifetime has evolved into new areas of applications such as efficient use of water and hydrogen proposed by Klemes et al. (2011).
Hackle et al. (2011) and Klemes et al. (1997) studied the concept of “Total site heat integration” which examines the integration of several processes at an industrial site via pinch analysis.
A challenging issue which faces industrial processes in energy optimization projects is retrofitting their current heat exchanger network. Another application of pinch analysis in addressing retrofit cases is to solve pinch violation and proposes and identify a new topology after the modifications correcting pinch violations are applied (Tjoe and Linnhoff 1986).
Mathematical approaches have also been investigated and implemented in addressing the retrofit problem of existing heat exchanger networks. Ciric et al. (1989) proposed optimization-based approaches in addressing this issue. Asante et al. (1997) proposed an automated and interactive approach for a practical retrofitting of an existing heat exchanger network. Their proposed method has so far been the most used and implemented approach in retrofit issues.
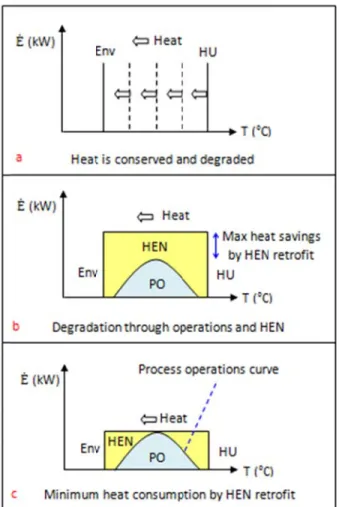
Although existing h approach Bonhiver addressin degraded called En operation These he transfer d outlets ar In this m operation Figure 1 hypotheti Figur h pinch-base heat exchan hes and use o rs et al. (20 ng retrofit si d from hot u nergy Trans n are identifi at saving m diagram the re linked to h method, the ns and heat e 1.13 shows t ical plant. re 1-12 : Ho ed methods nger network of heuristics 014) in their ituation are utility to en fer Diagram ed. The heat odifications se modifica hot utility so e flow rate exchangers a the actual fl ot and comp have been k but issues in others, ha r study disc due to lack vironment. m (ETD) wh t saving opp imply bridg ations are id ources. of heat tran are depicted b low rate of posite curves n successful like compl ave somewha cuss that th k of underst In his work hereby heat portunities re ging heat ou dentified via nsferred as by Energy tr heat in heat s (Dornfeld in address lexity and lo at hindered f he difficultie tanding on k he has int saving oppo equires modi utlets to hot u a a set of “b a function ransfer curve t exchanger 2010)
sing the ret ocal optima finding an o es of existin how heat is troduced a g ortunities in ification to t utility users bridges” thr of temperat es. and proces trofit proble a in mathem ptimal solut ng approach s transferred graphical m n a given pr the existing H . Through en rough which ture through ss operations em of matical ion. hes in d and method rocess HEN. nergy h heat h unit s in a
Figure 1 operation HEN retr The shap another f can be ac process c includes reduces t The mini maximum operation temperatu modify th 1-13 : Energ ns b- Heat s rofit (Bonhiv pe of a proce form. In this chieved by H curve lies b the heat exc the flow rate imum heat m of the glob n is obtaining ure. In that s he process co gy transfer d saving in HE ers, Korbel e ess diagram given syste HEN retrofit between the changers. In e of heat tran consumption bal process c g a global vi sense energy ondition in o diagram con EN is equal et al. 2014) is normally em as Figure is equal to t e process ar order to ac nsferred betw n after retro curve. Anoth iew of the en y transfer dia order to redu cept a- He to maximum in the form e 1.13 sugge the maximum rea includin hieve heat s ween the hea ofitting the
her implicati nergy transfe agram can p uce the energ
at is conserv m of process
of a rectang ests, the min m of the glob ng the opera savings, a se ating utility heat exchan ion of const erred in unit provide desig gy consumpt
ved and deg s operation gle if heat is nimum heat bal process c ations, and et of HEN m and environ nger network tructing the E t operation w gners with in tion. graded in pr c- Situation s not convert consumption curve. The g the HEN w modification nment is requ k is equal t ETD of a pr with respect t nsights on ho rocess n after ted to n that global which ns that uired. to the rocess to the ow to
1.5 Gaps in the body of knowledge
Based on the literature review the following gaps in the body of knowledge were identified: A systematic methodology: It is imperative to develop a systematic approach that can
analyze the downstream separation of a bio process for the purpose of energy reduction. Such methodology by employing systematic tools can identify process modifications and heat recovery potentials and also through techno-economic metrics can select the best separation alternative. This methodology in particular should :
o Employ novel insight-based method for identifying heat recovery
opportunities: Designing grass-root heat exchanger network with pinch analysis
results in maximum energy recovery network and is a straight-forward task. In retrofit situations, on the other hand, obtaining the maximum recovery is not as easy, which not always leads to optimum solution.. Thus employing a method that can easily identify the integration opportunities and enhance the recovery is much needed.
o Identify necessary modifications to process operation for energy reduction: Commonly, the main focus of energy reduction studies is placed on modifying existing heat exchanger network and potentials for energy reduction through systematic analysis of process modification has not systematically been addressed. Therefore, utilizing a tool that can map the underlying process units in a global energy-temperature curve, which shows the heat flows in the process operation, is necessary. This tool should identify the modifications which can potentially lead to energy reduction.
CHAPTER 2
METHODOLOGY
In order to put the hypotheses assumed in this work to the test and develop a methodology for early-stage design decision making, the following steps presented in Figure 2.1, have been employed. The major steps of this project methodology are as follows:
System definition
Dilute fermentation broth (5 wt%) is purified and dehydrated to fuel-grade ethanol (99.5 wt%) as the product.
Identification of separation strategies
Separation strategies are identified based on their separation performance to achieve the objective of the system definition step. Systematic frameworks have been proposed by different scientist such as Marquardt et al. (2008) to select the best choices of separation systems.
Stand-alone non-integrated design
The selected separation systems are simulated and designed to achieve the goal of the system definition step. After performing a mass and energy balance and data extraction, the designs are evaluated based on their operating and capital costs. The final metric of total annualized cost (TAC) is calculated for each design.
Stand-alone internally-integrated design
In order to design a heat-integrated flow sheet, the stream data extracted from mass and energy balance in stand-alone design is employed in order to be analyzed for energy targeting via pinch analysis. In order to further analyse the designed flow sheets, the energy transfer diagram (ETD) of each flow sheet is constructed and possible process modifications to improve energy efficiency are identified. After these steps, the heat exchanger network of the new designs is constructed according to pinch method. Finally the designs are evaluated in their operating and capital costs.
Integrated-with Kraft design
In order to design an integrated separation system, the data from energy analysis and the heat exchanger network of the internally-integrated design are used to identify possible heat integration with a Kraft pulp mill. The energy integration opportunities are identified through Bridge analysis.
After evalu identificatio uated. on of the brid Figure 2-1
dges, the ene
1 : Step-wise
ergy savings
e project m
s and their as
ethodology