UNIVERSITÉ DE MONTRÉAL
REMOVAL OF POTENTIAL INHIBITORS FROM HEMICELLULOSE
HYDROLYSATE BY MEMBRANE FILTRATION
SALOMEH CHEGINI
DÉPARTEMENT DE GÉNIE CHIMIQUE ÉCOLE POLYTECHNIQUE DE MONTRÉAL
MÉMOIRE PRÉSENTÉ EN VUE DE L’OBTENTION DU DIPLÔME DE MAÎTRISE ÈS SCIENCES APPLIQUÉES
(GÉNIE CHIMIQUE) JUILLET 2014
UNIVERSITÉ DE MONTRÉAL
ÉCOLE POLYTECHNIQUE DE MONTRÉAL
Ce mémoire intitulé:
REMOVAL OF POTENTIAL INHIBITORS FROM HEMICELLULOSE HYDROLYSATE BY MEMBRANE FILTRATION
présenté par : CHEGINI Salomeh
en vue de l’obtention du diplôme de : Maîtrise ès sciences appliquées a été dûment accepté par le jury d’examen constitué de :
M. PERRIER Michel, Ph. D., président
M. JOLICOEUR Mario, Ph. D., membre et directeur de recherche
Mme MARINOVA Mariya, Ph. D., membre et codirectrice de recherche M. LEGROS Robert, Ph. D., membre
DEDICATION
To my beloved dad and mom: Iraj and Derakhshandeh To my Love: Byandor To my darling brother and sister: Mehdi and Sormeh For their endless love and support
ACKNOWLEDGEMENTS
I owe sincere thankfulness to my research supervisors, Professor Jean Paris, Professor Mario Jolicoeur and Dr. Mariya Marinova for their understanding and encouragement. I am sure that this research would not have been possible without their supports and patience.
I would also like to show my gratitude to Dr. Hassan Chadjaa and Dr. Mohameh Rahni at CNETE , who made me believe in myself and guided me step by step through many discussions. This thesis would not have been possible without their advice.
Special thanks to my colleague and friends, Moye, Tatiana, Radia, Hana, Fatma, Samin, Mohammad, Sara, Ali, Miyuro and Maryam for their valuable friendship and inspiration.
I would like to thank Nicholas Berruard, Nancy Deziel and all of my colleagues at CNETE for their help.
I would express a deep sense of gratitude to my dearest darling parents, Iraj and Derakhshandeh, whom I owe my life for their constant love, moral support, blessing and encouragement.
I would like to thank my dear husband, Byandor, for his kindness, personal support, great patience, and his constant love.
Finally, special thanks are due to my kind brother Mehdi and my lovely sister Sormeh who always strengthened my moral by standing by me in all situations.
RÉSUMÉ
Au cours des dernières années, avec l'augmentation des préoccupations environnementales et des sources limitées de combustibles fossiles, la production des biocarburants a attiré une attention croissante. Le bio-butanol, en raison de ses nombreux avantages par rapport aux autres biocarburants, peut être considéré comme une alternative appropriée. Le bio- butanol peut être produit à partir des sucres pentoses et hexoses par la fermentation acétone-butanol-éthanol (ABE), un procédé anaérobie qui utilise généralement des bactéries à partir des souches de Clostridium, pour produire de l'acétone, de butanol et d'éthanol dans un rapport de 3-6-1 respectivement. Un inconvénient de ce procédé est le faible rendement et l'une des raisons est la présence d'une large gamme de composés tels que les furanes, les acides organiques faibles et des composés phénoliques qui sont toxiques et qui empêchent la fermentation efficace. Surmonter l'impact de ces inhibiteurs est l'un des principaux défis pour la production de butanol. À cet effet, l'élimination presque complète de ces groupes de produits chimiques est une nécessité. La détoxification est une étape très critique.
L'objectif principal de ce travail a été d'étudier l'efficacité de la filtration par membrane pour éliminer les inhibiteurs potentiels contenus dans l’hydrolysat hémicellulosique et améliorer le pouvoir fermentescible des sucres pour la production du bio -butanol.
Un mélange de pré-hydrolysat de l'érable-tremble a été utilisé comme solution initiale dans toutes les expériences. Cinq membranes couvrant une large gamme de seuils de coupures (MWCO) (entre 100 et 10000 daltons) ont été testées. Trois membranes sont de type nanofiltration (NF90, NF270 et XN45) et deux de type ultrafiltration (UA60 et UE10.
Dans ce travail, deux scénarios ont été étudiés: Le premier a consisté en l’évaluation des performances des étapes de concentration et détoxification après l’hydrolyse acide du pré - hydrolysat et le deuxième a été consacré à la concentration – détoxification avant l’étape de l’hydrolyse acide. Les variations de la concentration des sucres réducteurs et des composés inhibiteurs ont été déterminées dans les deux scénarios et l'efficacité des membranes testées a été comparée.
Chacun des deux scénarios a comporté deux étapes. La première a été consacrée à la sélection de la membrane la plus efficace (meilleur taux de rétention des sucres et meilleur taux de passage des inhibiteurs dans le perméat). Les essais ont été réalisés en boucle fermé (le concentré et le
perméat sont retournés dans la cuve d’alimentation) pour évaluer seulement les performances de séparation des membranes. La deuxième étape a été consacrée à la réalisation des essais de concentration et de détoxification avec la membrane sélectionnée lors de l’étape précédente. Dans les deux scénarios, les résultats des essais de sélection de la membrane la plus efficace ont monté que les meilleurs taux de conservation des sucres et les taux d’élimination des inhibiteurs les plus élevés ont été obtenus avec la membrane XN45. Aussi, la membrane XN45 a été sélectionnée pour les étapes subséquentes prévues dans les deux scénarios. Ces derniers ont consistés en une concentration – détoxification du pré-hydrolysat et de l’hydrolysat acide. Afin d’augmenter les taux de détoxification, la procédure de filtration a été complétée par une étape de dia-filtration.
Dans le cas de l’hydrolysat acide, l’expérience a consistée en l’extraction de 0.85L de perméat à partir de 1.7L de solution initiale (soit un facteur de concentration de 2 fois). Une fois le taux de concentration atteint, l’expérience a été complétée par une dia-filtration avec un volume d’eau déminéralisée de 2 fois le volume du concentré. Une expérience similaire a été réalisée avec le pré-hydrolysat (extraction de 1L de perméat à partir de 2L de pré-hydrolysat et dia-filtration avec 1L d’eau déminéralisée). La variation de la concentration de sucres réducteurs et les composés inhibiteurs a été déterminée dans les deux scénarios et l'efficacité des membranes testées a été comparée. Dans ces expériences, afin de retenir davantage de sucres et de retirer plusieurs inhibiteurs, dans les deux scénarios, la nano - membrane XN45 présentait de meilleures performances. Lors de l'étape suivante, pour la rétention des inhibiteurs et l'obtention de la concentration la plus élevée de sucres, le processus de concentration suivie d'une dia - filtration a été appliqué.
Cette étude a démontrée que la dia - nanofiltration est un procédé efficace qui permet l’élimination de l'acide acétique, le furfural et HMF, cependant la séparation membranaire, même en combinaison avec la dia - filtration ne permet pas de séparer les composés phénoliques. En outre, les résultats de notre étude ont démontré que le premier scénario
(concentration après hydrolyse) est une approche prometteuse afin d’obtenir une alimentation appropriée pour l'étape de fermentation (concentration en sucre plus élevée et moins d’inhibiteurs). La dernière étape consistait à étudier la fermentabilité de l’hydrolysat après la détoxification et mesurer l’efficacité des procédés de désintoxication sur la croissance microbienne et la bioconversion des sucres générés durant l’hydrolyse en bio-butanol. Lors de
cette étape, des voies d’optimisation et de validation de l’efficacité des procédés de détoxification de l’hyrolysat par voie membranaire ont été explorées.
ABSTRACT
In recent years, with rising environmental concerns and limited sources of fossil fuel, bio-fuel production has attracted growing attention. Bio-butanol is a bio-fuel that is an alternative to fossil fuels and can be produced by fermentation of pentose and hexose sugars through acetone-butanol-ethanol (ABE) anaerobic fermentation process, which uses bacteria from the clostridium strains to produce acetone, butanol and ethanol in a ratio of 3-6-1, respectively. A main drawback to this process is its relatively low yield, which results in part from the presence of a broad range of compounds such as furans, weak organic acids and phenolic components. These components are toxic and prevent efficient fermentation. Overcoming the impact of inhibitors is one of the main challenges for bio-butanol production, and since near complete removal of these groups of chemicals is a necessity detoxification is a critical step. The main objective of this project is to study the efficiency of membrane filtration for removing the potential inhibitors from hemicellulosic hydrolysates in order to improve its fermentability for bio-butanol production. In this work, a pre-hydrolysate of maple-aspen blend was used as an initial solution. A number of experiments were performed using five membranes, with broad range of molecular weight cut-off from 100 to 10,000 Daltons, including nano-filtration (NF) membranes and ultra-filtration (UF) membranes. Two scenarios also were conducted: the first one was concentration after hydrolysis and the second one was concentration before hydrolysis. The change in the concentrations of reducing sugars and inhibitory compounds were determined in both scenarios, and the efficiency of tested membranes was compared. In these experiments, in terms of retaining more sugar and removing more inhibitors, the nano-membrane XN45 exhibited better performance in both scenarios, and was selected as a suitable membrane in the subsequent steps.
Moreover, in order to get higher sugar concentration and remove more inhibitors, the concentration process followed by dia-filtration step(s) was applied.
In this study, dia-nanofiltration showed to be an efficient process to remove acetic acid, furfural and HMF. However, the performance of membrane separation, even in combination with dia-filtration process, was less effective in terms of phenolic elimination.
Furthermore, the results from our study demonstrated that the first scenario (concentration after hydrolysis) was a more promising approach to get a suitable feed for the fermentation step
(higher sugar concentration with lower inhibitor contents). In the final step, to investigate the effects of the applied detoxification process on the microbial growth, the detoxified samples were subjected to fermentation process.
TABLE OF CONTENTS
DEDICATION ... iii ACKNOWLEDGEMENTS ... iv RÉSUMÉ ... v ABSTRACT ... viii TABLE OF CONTENTS ... xLIST OF TABLES ... xiv
LIST OF FIGURES ... xvi
LIST OF SYMBOLS AND ABBREVIATIONS ... xviii
LIST OF APPENDICES ... xix
CHAPTER 1 INTRODUCTION ... 1
1.1 Background ... 1
CHAPTER 2 LITERATURE REVIEW ... 4
2.1 Lignocellulosic biomass ... 4
2.1.1 Cellulose ... 5
2.1.2 Hemicelluloses ... 6
2.1.3 Lignin ... 7
2.1.4 Extractives and ash ... 8
2.2 Hemicelluloses applications ... 8
2.3 Butanol ... 9
2.3.1 Fuel properties and butanol advantages as a fuel ... 10
2.3.2 Butanol market ... 13
2.3.3 Butanol production ... 13
2.5 Bio-butanol production from hemicelluloses: Process ... 15
2.5.1 Pre-treatment/ Pre-hydrolysis ... 16
2.5.2 Hydrolysis ... 18
2.5.3 Detoxification ... 20
2.5.4 Membrane filtration: Basic principles ... 28
2.5.5 Pressure driven membrane /Process ... 31
2.5.6 Dia-filtration ... 35
2.6 ABE Fermentation ... 36
2.6.1 Microorganism ... 37
2.6.2 Microbial growth ... 38
2.6.3 Media for fermentation ... 39
2.7 Product recovery ... 40
2.8 Summary of literature review ... 41
CHAPTER 3 OBJECTIVES & METHODOLOGICAL APPROACHES ... 43
3.1 Main Objective ... 43
3.2 Specific Objectives ... 43
3.3 Methodology ... 43
3.3.1 Concentration after hydrolysis (Scenario 1) ... 44
3.3.2 Concentration before hydrolysis (Scenario 2) ... 44
3.4 Contributions ... 44
CHAPTER 4 MATERIALS AND ANALYSIS METHODS ... 46
4.1 Raw Materials ... 46
4.1.1 Pre-hydrolysate ... 46
4.1.3 Growth medium (culture medium) ... 46
4.2 Experimental equipments ... 47
4.2.1 Membranes ... 47
4.2.2 Filtration experimental set up ... 48
4.3 Analysis methods ... 50
4.3.1 Total solids ... 50
4.3.2 Reducing sugar ... 50
4.3.3 Furfural, hydroxymethyl furfural (HMF) and organic acids ... 50
4.3.4 Total phenol content ... 51
4.3.5 The pH and conductivity ... 51
4.3.6 Membrane efficiency ... 51
4.3.7 Fouling ... 51
4.3.8 Cell concentration (fermentation step) ... 52
CHAPTER 5 EXPERIMENTAL WORK, RESULTS & DISCUSSION ... 53
5.1 Pre-hydrolysis/Hydrolysis ... 53
5.2 Detoxification: concentration after hydrolysis (scenario 1) ... 55
5.2.1 Membrane Selection: ... 55
5.2.2 Concentration and dia-filtration ... 62
5.2.3 Detoxification : concentration before hydrolysis (scenario 2) ... 65
5.3 Fermentation ... 71
5.3.1 Media and growth conditions ... 71
SUMMARY, CONCLUSION AND RECOMMENDATIONS ... 76
Summary and conclusion ... 76
REFERENCES ... 80 APPENDICES ... 90
LIST OF TABLES
Table 2–1 : The structure of common lignocellulosic materials ... 5
Table 2–2 : Specifications of butanol isomers ... 10
Table 2–3 : Fuel properties ... 11
Table 2–4 : Pre-treatment processes for lignocelluloses ... 17
Table 2–5 : Comparison between dilute-acid and concentrated acid hydrolysis ... 18
Table 2–6 : Average sugar profiles of hardwood hemicelluloses acidic hydrolysates; ... 20
Table 2–7 : The toxic effects of inhibitors on some microorganisms ... 22
Table 2–8 : Comparison of different detoxification methods to remove inhibitors ... 26
Table 2–9 : Different non-biological detoxification methods ... 27
Table 2–10 : Effectiveness of non-biological detoxification methods ... 28
Table 2–11 : The drawbacks and solutions for improving ABE fermentation ... 37
Table 4–1 : Main specification of tested membranes ... 48
Table 5–1 : Sugar concentration in pre-hydrolysate and hydrolysate ... 54
Table 5–2 : Specification of pre-hydrolysate and hydrolysate ... 54
Table 5–3 : The molecular weight of potential inhibitors and sugars ... 59
Table 5–4 : The results of concentration and dia-filtration of hydrolysate (Scenario 1) ... 64
Table 5–5 : The concentration and dia-filtration of pre-Hydrolysate (Scenario 2) ... 69
Table A-1 : The result of filtration of hydrolysaye by NF90 at pH 3 ... 90
Table A-2 : The results of filtration of hydrolysaye by XN45 at pH 3 ... 90
Table A-3 : The results of filtration of hydrolysaye by UE10 at pH 3 ... 91
Table A-4 : The results of filtration of hydrolysaye by NF270 at pH 3 ... 91
Table A-5 : The results of filtration of hydrolysaye by UA60 at pH 3 ... 92
Table A-7 : The results of filtration of hydrolysaye by NF270 at pH 6 ... 93
Table A-8 : The results of filtration of pre-hydrolysaye by XN45 at pH 3... 94
Table A-9 : The results of filtration of pre-hydrolysaye by UE10 at pH 3 ... 94
Table A-10 : The results of filtration of pre-hydrolysaye by UA60 at pH 3... 95
LIST OF FIGURES
Figure 1-1: Simplified diagram of the conventional Kraft pulping process ... 2
Figure 1-2: Bio-refinery concept ... 3
Figure 2-1 : The structure of lignocellulosic biomass ... 4
Figure 2-2 : Cellulose structure ... 6
Figure 2-3: Monomers of hemicelluloses ... 7
Figure 2-4: Monomers of lignin ... 7
Figure 2-5: The structure of lignin ... 8
Figure 2-6 : Hemicelluloses applications ... 9
Figure 2-7 : N-butanol consumption by regions, 2011 ... 13
Figure 2-8 : Trends in butanol product ... 14
Figure 2-9 : Bio-butanol production from biomass ... 16
Figure 2-10 : Schematic of effects of pre-treatment process ... 17
Figure 2-11 : The structural profile of fermentation inhibitors derived from lignocellulosic biomass with acidic treatment ... 21
Figure 2-12 : Schematic of membrane separation ... 28
Figure 2-13 : Types of filtration process ... 29
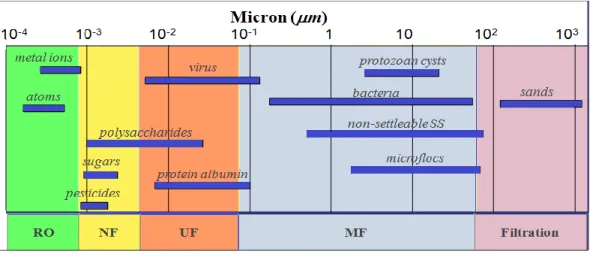
Figure 2-14 : Ranges of membrane based separation ... 32
Figure 2-15: Separation characteristics of pressure driven membranes; ... 32
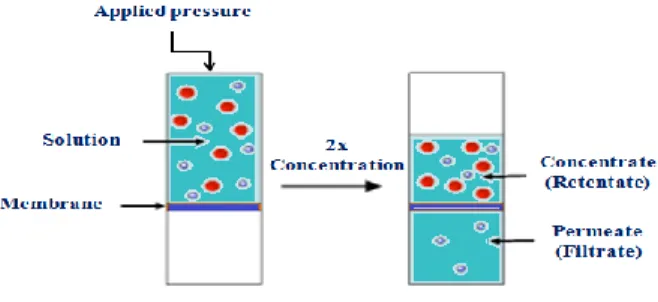
Figure 2-16 : 2x-concentration of a mixed sample; adopted from ... 36
Figure 2-17 : Schematic bacteria cell growth curve ... 38
Figure 2-18 : Integrated processes for fermentation and in situ product recovery: fermentation combined with (a) gas stripping, (b) liquid–liquid extraction and (c) pervaporation ... 41
Figure 4-2 : Experimental set up for membrane selection phase ... 49
Figure 4-3 : Set up used for detoxification (concentration and dia-filtration) phase ... 49
Figure 5-1 : The applied methodology in the first scenario (concentration after hydrolysis) ... 55
Figure 5-2 : Total sugars retention in hydrolysate by tested membranes ... 56
Figure 5-3 : Removal of inhibitors from hydrolysate ... 57
Figure 5-4 : Total sugars retention in hydrolysate by tested membranes ... 60
Figure 5-5 : Removal of inhibitors from hydrolysate ... 61
Figure 5-6 : The applied methodology in second scenario (concentration before hydrolysis) ... 65
Figure 5-7 : Total sugars retention in hydrolysate by tested membranes ... 66
Figure 5-8 : Removal of inhibitors from hydrolysate ... 67
Figure 5-9 : The growth of microorganism in control samples ... 72
LIST OF SYMBOLS AND ABBREVIATIONS
ABE Acetone-Butanol-Ethanol Ai Initial feed
ATCC American type culture collection C feed Solute concentration in feed (g/L) C permeate Solute concentration in permeate ( g/L) HMF Hydroxymethylfurfural
MWCO Molecular weight cut-off
P0 Permeate sample at beginning of filtration P30 Permeate sample after 30 minutes
P60 Permeate sample after 60 minutes P90 Permeate sample after 90 minutes RCM Reinforced Clostridial Medium SM Synthetic medium
LIST OF APPENDICES
APPENDIX A - MEMBRANE SELECTION (Scenario 1) ... 90 APPENDIX B –MEMBRANE SELECTION (Scenario 2) ... 94 APPENDIX C – THE CONTENTS OF FERMENTATION FEEDS ... 96
INTRODUCTION
Chapter 1
1.1 Background
The pulp and paper industry has always been considered as an important part of the Canadian economy. However, in the recent decades, due to the low price of paper, rising energy costs and a decrease in the demand for traditional P&P products, this industry has had to face some economic challenges (Montastruc et al., 2011). One strategy to overcome this situation and make it an advantage, is converting the exiting chemical pulp mills into the Integrated Forest Bio-refineries (IFBR), which by using renewable feedstock and applying innovative technologies can produce higher value-added products (Florbela Carvalheiro et al., 2008; Colodette et al.; Longue Júnior et al., 2013; Montastruc et al., 2011; Van Heiningen, 2006).
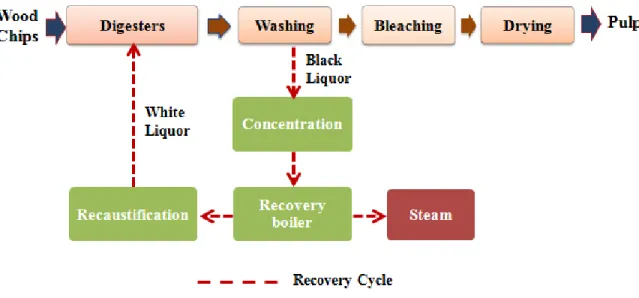
The most used process to produce pulp from woody biomass is the Kraft pulping process (Vena et al., 2010). The objective of the pulping process is to eliminate lignin and keep the polysaccharides, specifically the cellulose fibers to produce pulp and paper (Fengel et al., 1983). In a typical Kraft pulping process (Figure 1-1), the wood chips are firstly subjected to white liquor (a solution of NaOH and Na2S) for cooking. During the cooking step, several complex chemical reactions happen under high operational conditions and as a result, the major parts of lignin and hemicelluloses (almost 40-50% of the wood biomass) are dissolved and form black liquor. This black liquor, which contains degraded lignin, hemicelluloses and the spent cooking chemicals, is sent to the recovery boiler to be burned and generates steam and electricity (Vena et al., 2010). In the pulping process, although the wood chips lose majority of their lignin and around half of their total solid contents, they still can keep their physical construction. However, the structure is not strong enough and after performing several mechanical and chemical steps such as washing, bleaching and drying, they will degrade to the single fibers, which can be sold as market pulp (Yoon et al., 2011).
Figure 1-1: Simplified diagram of the conventional Kraft pulping process (Marinova et al., 2009)
Due to the low heating value of hemicelluloses (13.6 MJ/kg) compared to lignin (27.0 MJ/kg), the hemicelluloses underutilization in the existing pulping processes is evident, and burning of hemicellulose in the recovery boiler is not efficient (Longue Júnior et al., 2013; Van Heiningen, 2006; Vena et al., 2010). Moreover, hemicelluloses, as an inexpensive and abundant raw material, have potential for being suitable fermentation substrate to produce value added products such as bio-fuels. Therefore, the extraction of hemicelluloses, which would have been dissolved in the black liquor during pulping process, is an attractive alternative for pulp and paper mills, as they can increase their net revenue by producing bio-fuels, biopolymers, paper additives, and other chemicals in addition to their main products (Canilha et al., 2013; Saha, 2003).
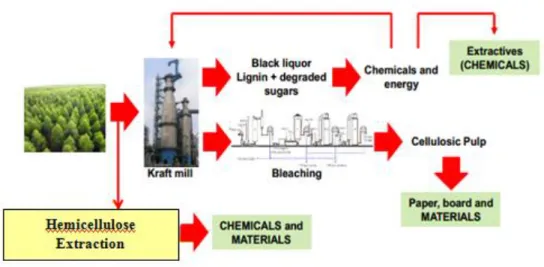
The sustainable conversion of biomass into energy and other valuable products is defined as bio-refinery, a facility or facilities network, which integrates biomass transformation processes and equipment to generate power, bio-fuels, heat, and marketable chemicals from biomass (Cherubini, 2010; Stöcker, 2008). Figure 1-2 illustrates the biorefinery concept.
Figure 1-2: Bio-refinery concept (Longue Júnior et al., 2013)
A main problem associated with the bio-fuel production from hemicelluloses is the formation of toxic compounds, which inhibit microorganism metabolism and prevent efficient fermentation (Larsson et al., 1999). Thus, to overcome the inhibitory effects of these compounds, the use of a proper detoxification step prior to fermentation, plays an important role to improve the yield of bio-fuel production (Florbela Carvalheiro et al., 2008; Anuj Kumar Chandel et al., 2007).
Over the years, different detoxification methods such as physical (evaporation, membrane mediated detoxification), chemical (neutralization, calcium hydroxide over liming, activated charcoal treatment and ion exchange resins), and biological (enzymatic) have been developed. Each method has its own specificity to eliminate particular inhibitors from hemicelluloses hydrolysates. In this study, detoxification by membrane filtration was used to partially or completely removal of some potential toxic compounds from hemicellulosic hydrolysates and pre-hydrolysates. Furthermore, the growth of Clostridium acetobutylicum, a butanol-producing microorganism, on the concentrated-detoxified solutions was studied.
The current study has been done in collaboration with Centre National en Électrochimie et en Technologies Environnementales (CNETE) and FPInnovations. The pre-hydrolysate solution was provided by FPInnovations; the required experimental facilities were kindly supplied by CNETE and all the experimental work was performed there.
LITERATURE REVIEW
Chapter 2
2.1 Lignocellulosic biomass
Over the last few years, the environmental issues, national security and long-term economic concerns have attracted the research interests into biomass feedstock as an abundant source of fuels and chemicals, which are mainly produced from petroleum sources. Biomass most often refers to the plant or plant-derived materials like agriculture crops, trees and other biological substances that are derived from living, or recently living organisms (Alriksson et al., 2011; Canilha et al., 2013; Florbela Carvalheiro et al., 2008). The biomass is a renewable energy source, which includes carbohydrates. One of the most important biomass resources are lignocellulosic materials (Canilha et al., 2013) such as agricultural residues (hulls, straws, stalks, and stems), wastes of pulp and paper industry, coniferous and deciduous woods, municipal solid wastes, and herbal crops (Canilha et al., 2013; Saha, 2003). The lignocellulosic biomass contains cellulose, hemicelluloses and lignin (Figure 2-1); which build up to 90% of its dry matter along with smaller quantities of protein, peptin, ash and extractives (dissolvable materials including nitrogenous substance, non-structural sugars and waxes).
Figure 2-1 : The structure of lignocellulosic biomass (Image: USDA Agricultural Research Service)
The composition of lignocellulosic biomass, based on some factors such as plant type and growing conditions, can differ in different plant species (Zhang et al., 2007, Saha, 2003). As an example, the composition and structure of hemicelluloses in hardwoods (e.g. aspen, oak and willow) and softwoods (e.g. pine and spruce) are different. The hardwood hemicelluloses contain
a higher portion of xylose (5-carbon sugar) than softwood hemicelluloses, which usually have higher glucose and mannose units (6-carbon sugars) (Kumar et al., 2009). Table 2-1 shows the composition of some lignocellulosic materials.
Table 2–1 : The structure of common lignocellulosic materials (Kumar et al., 2009,Dehkhoda, 2008)
Lignocellulosic biomass Cellulose (%wt.) Hemicelluloses (%wt.) Lignin (%wt.)
Hardwood 40-55 24-40 18-25 Softwood 45-50 25-35 25-35 Newspaper 40-55 25-40 18-30 Wheat straw 30 50 15 Switchgrass 45 31.4 12 Corn cobs 45 35 15 Grasses 25-40 35-50 10-30
The lignocelluloses materials account for almost 50% of the world biomass and has an estimated production of 10-50 billion t per year (Claassen et al., 1999). Generally, in the northern hemisphere, the dominant lignocellulosic materials are softwoods such as spruce and pine. In Canada, the commercial wood products are mainly made from softwoods; however, several value-added products are also delivered from hardwoods (Dehkhoda, 2008; Galbe et al., 2005).
2.1.1 Cellulose
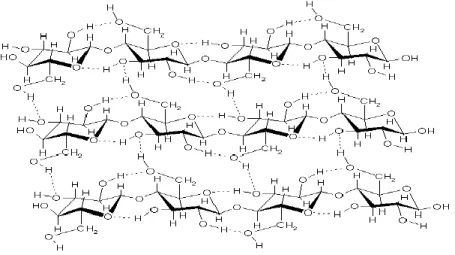
Cellulose is the main fraction in the living plant cell walls. The most evident task of cellulose is to provide rigidity to the plant structure. Cellulose is a linear homo-polymer with D – glucose molecules that are bound by β (1-4) glycoside linkages (Figure 2-2) (Stöcker, 2008). Based on the source of cellulose, the length of macromolecules and degree of polymerization (DP) of cellulose can be varied. As an example, cotton presents an average DP of about 10000, while newsprint is investigated to have a DP of about 1000 (Roehr et al., 2001).
Figure 2-2 : Cellulose structure (Stöcker, 2008)
Based on its crystallinity degree, cellulose can be specified into crystalline and paracrystalline or amorphous cellulose. Cellulose can be converted to glucose by using enzymes (cellulases) or through chemical ways by means of acids such as sulphuric acid (Zheng et al., 2009). For degradation, the difficult parts in cellulosic structure are crystalline parts, while the easy regions for breaking down are amorphous parts (Dehkhoda, 2008; Roehr et al., 2001).
2.1.2 Hemicelluloses
Hemicelluloses are highly branched heterogeneous and amorphous polymers, which contain hexose sugars (monosaccharides carrying 6 carbon atoms e.g. glucose, mannose, galactose) and pentose sugars (monosaccharides carrying 5 carbon atoms e.g. xylose, arabinose). The hemicelluloses bound through hydrogen bonds to cellulose and covalently to lignin (Saha, 2003; Stöcker, 2008), and same as cellulose, can be hydrolyzed enzymatically (by hemicellulase) or chemically (e.g. by acids), and converted to its constituent monomers xylose, arabinose, galactose, glucose and / or mannose (Stöcker, 2008; Zheng et al., 2009). In comparison to cellulose, hemicelluloses have more amorphous areas and lower crystalline degrees that make them more sensitive to hydrolysis than to the hard cellulose structure (Dehkhoda, 2008).
Figure 2-3: Monomers of hemicelluloses (Stöcker, 2008)
2.1.3 Lignin
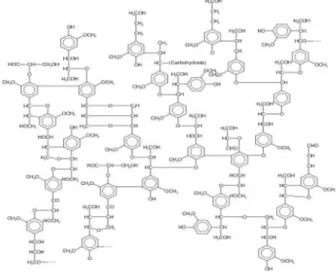
Lignin is a highly complex three-dimensional polymer of several phenylpropanoid units, which are linked together by a variety of ether and carbon-carbon bounds (Martinez et al., 2009; Stöcker, 2008).
The lignin is formed by removing water from sugars through non-reversible reactions. This molecule with phenolic characteristic results from dehydration of three alcoholic monomers including: trans-sinapyl alcohol, p-coumaryl alcohol and trans-coniferyl alcohol, which bond together with ether bonds (Dehkhoda, 2008; Fardim et al., 2004).
Figure 2-4: Monomers of lignin (Zubieta et al., 2002, Palmqvist, 2000 )
The lignin composition of different raw materials depends on their origin. As an example, the lignin content of softwoods (~30%) is higher than hardwoods (~20%) (Kumar et al., 2009).
Lignin, due to its complex molecular structure, is extremely recalcitrant towards biological and chemical degradation. The presence of lignin in lignocellulosic biomass, due to forming a protective wall, prevents the degradation of cell plants by bacteria and fungi (Kumar et al., 2009).
Figure 2-5: The structure of lignin (Kumar et al., 2009)
2.1.4 Extractives and ash
The extractives represent a low quantity (1-5%) of lignocellulosic biomass, which are non-cell wall materials and can be extracted by particular organic solvent. They include both lipophilic and hydrophilic constituents (Sjöström, 1993), and can be classified to phenolic extractives and wood resins (Dehkhoda, 2008; Sjöström, 1993). The resin can be observed in resin channel and pockets, whereas the phenolic extractives can be detected in the bark and inner section of woods. These compounds can be released during lignocellulosic pre-treatment, and despite their low amounts can have toxic effects on microorganisms (Dehkhoda, 2008).
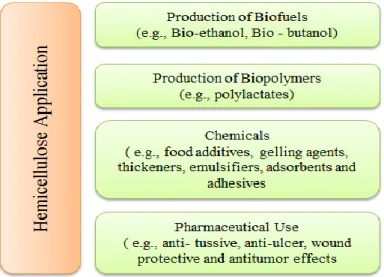
2.2 Hemicelluloses applications
Hemicelluloses have a broad variety of applications (Figure 2-6). They can be converted to valuable products such as bio-fuel (e.g. ethanol and butanol), different biopolymers (e.g. polylactates and polyhydroxyalkanoates), and other value-added products such as xylitol and butanediol (Canilha et al., 2013).
Hemicelluloses can be employed as food additives, gelling agents, thickeners, emulsifiers, adsorbents, and adhesives (Canilha et al., 2013; Spiridon et al., 2005). In addition, hemicelluloses have been considered for their possible applications in medical industry such as anti-ulcer, wound protective and antitumor effects (Cipriani et al., 2006; Kardošová et al., 2002; Peng et al., 2012).
Figure 2-6 : Hemicelluloses applications
Recently, with the annual rise of global fossil fuels consumption, climate change and environmental concerns, limitation of crude oil resources, and the fluctuate price of crude oil, the bio-fuel production has attracted more attention (Anish et al., 2009; Smith, 2007). However, biomass-based fuels can represent just a part of the required fuels worldwide. Nevertheless, this fraction (e.g. in case of Germany, 25% is predicted for 2020) will significantly contribute to decrease greenhouse (Dürre, 2007; Paul et al., 2006). Moreover, for the market share of bio-fuels by 2020, a 10% minimum goal has been suggested (Cascone, 2008; Dürre, 2007; Liu et al., 2013).
2.3 Butanol
Butanol or butyl alcohol, with a molecular formula of C4H9OH (MW 74.12), is a colorless and flammable alcohol with a banana-like odor. Butanol is an important chemical with a broad variety of applications. It can be applied as a solvent in drugs, vitamins, hormones, antibiotics,
cosmetics and household cleaners. Furthermore, butanol is traditionally used in polymer, paint and plastic industry as an industrial solvent.
Butanol has a structure with 4-carbons that the carbon atoms can form either a branched, chain or straight structure. Based on the carbon chain structure and OH location, different isomers with various properties can be formed. These isomers are n-Butanol, 2-Butanol, iso-Butanol and tert-Butanol (Dürre, 2007). Although the butanol isomers have different properties such as viscosity, boiling point and octane number, their basic applications are similar (industrial detergents, gasoline additives or solvents). The butanol isomers can be generated from fossil-based fuels by different techniques; however only n-butanol can be produced from biomass (Liu et al., 2013). The structure, applications and properties of butanol isomers are shown in Table 2-2.
Table 2–2 : Specifications of butanol isomers (Liu et al., 2013)
n-Butanol 2-Butanol Iso-Butanol Tert-Butanol Molecular structure Density (g/cm3) 0.81 0.806 0.802 0.789 Boiling point(°C) 118 99.5 108 82.4 Melting point(°C) -90 -115 -108 25-26 Octane number 78 32 94 89 Main applications
- Solvents for dye, paints, resins, etc. -Plasticizers, Cosmetics - Chemical intermediate for butyl esters or butyl ethers, etc. -Gasoline additive -Solvent -Industrial cleaners -paint remover -Perfumes or in artificial flavors -Solvent and additive for paint & Gasoline -Industrial cleaners -paint removers -Ink ingredient -Solvent -Industrial cleaners -Paint removers -Gasoline additive for octane booster -Oxygenate intermediate for ETBE, MTBE, TBHP, etc.
2.3.1 Fuel properties and butanol advantages as a fuel
Butanol, in addition to its common applications such as being an extraction agent, chemical intermediate and industrial solvent, can be used as an alternative fuel for transportation vehicles (Cascone, 2008; Dürre, 2007; Ramey et al., 2004) . Butanol, as compared to ethanol, which is the conventional gasoline substitute, has more advantages. However, the main butanol properties
mainly depend on the type of isomer. Since n-butanol is the only butanol isomer, which can be produced from biomass through fermentation process, in this work, the considered fuel properties are those of n-butanol. The properties of n- butanol, ethanol and gasoline are compared in table 2-3 (Freeman et al., 1988; GREET, 2010; Liu et al., 2013; Speight, 2005).
Table 2–3 : Fuel properties
Units Gasoline Ethanol n- Butanol
Oxygen Content % Close to 0 36 22
Octane Number1 - 85-94 112.5-114 87
Reid Vapor Pressure Bar 0.480-1.034 0.159 0.023
Higher heating value MJ / Kg 46.5 29.8 37.3
Lower heating value MJ / Kg 43.5 27 34.4
The standard vehicle engines are able to combust a fuel containing up to 15% ethanol (by volume) without any modifications of engines, while butanol with properties closer to those of gasoline can be mixed in any proportion. As an example, David Ramey travelled across the United States in a Buick with 100% butanol and without any engine modifications (Ramey et al., 2004).
Oxygen content is the second property of fuels that will be discussed. The concept is having more energy content in the fuel, which leads to decrease in carbon monoxide emissions and results in more complete combustion. Referring to the Table 2-3, the energy content of gasoline is almost zero, while ethanol and butanol contain 36% and 22% oxygen respectively, and can be employed as oxygenate agents and fuel additives (Liu et al., 2013; Szulczyk, 2010).
The next fuel property is the octane number, which is a measure of how much temperature and pressure is required to inflame the air-fuel blends. According to the Table 2-3, butanol has an octane level of 87, which is close to the octane number of gasoline. However, ethanol has a higher octane number that is an advantage. Thus, the petroleum distributors, in order to enhance the octane level, can blend a cheap and low-octane fuel with ethanol.
1 average of The Octane Number is the Antiknock Index, which is the the Research Octane Number (RON) and
Another property of fuel is the Reid vapor pressure (a common measure of the fuel volatility). A fuel requires a minimum vapor pressure to be able to start a cold engine. Based on Table 2-3, ethanol has a higher Reid vapor pressure than butanol (Ramey et al., 2004). Therefore, butanol cannot vaporize simply, which may make it harder to start a cold engine. However, the easy fuel vaporization results in higher levels of pollution, specifically in hot summers, when the ultraviolet radiation of sun transforms the organic volatile components along with nitrogen oxides gases (NOX) into ground ozone pollution (EPA, 2011; Wu et al., 2007).
The energy content of the fuel is the other fuel specification that should be discussed. Fuel combustion generates the heat energy, which is converted to motion by car engines. Researchers use two heating value measurements: higher heating value (HHV) and lower heating value (LHV). The HHV includes the heat energy delivered containing the vaporization of water, while the LHV excludes the wasted energy on water vaporization. Usually, the lower heating value is used, because the energy of vaporized water cannot be utilized by car engines (Ramey et al., 2004). The lower energy content decreases the mileage2. Therefore, in terms of energy content, butanol (86%) has superiority to ethanol (65%). In addition, as compared to ethanol, the energy content of butanol is more similar to gasoline.
The final fuel property is fuel contamination and moisture. Ethanol is hydroscopic and liquid phase separation may occur in presence of water, while the blends of gasoline-butanol do not separate. Furthermore, ethanol as fuel cannot be preserved easily and the process of allocation, storage and transition is more difficult than that of gasoline.
To answer the question “why is butanol a better alternative?” we may say because its energy content is higher and it has a lower vapor pressure. Moreover, the blends of butanol-gasoline do not separate in the water presence, and butanol can be mixed with gasoline at any concentration without any engine modifications. In addition, the octane level of butanol is more comparable to gasoline and finally the butanol is less corrosive than ethanol (Liu et al., 2013; Ramey et al., 2004; Szulczyk, 2010).
2.3.2 Butanol market
During recent years, the worldwide market of butanol has risen considerably, and mainly because of increasing demand in the Asia-pacific region.
As an example, in 2012 around 35% of the global butanol market belonged to China. However, the facilities of butanol production are mainly centralized in North America and Europe, which are the main butanol exporting areas in the world. In the near future, it is expected that the Middle East, due to the interests of their government in petrochemical and chemical companies, to be one of the main butanol global markets (Aster, 2012 ; Liu et al., 2013; Ramey et al., 2004; Szulczyk, 2010). The N-butanol consumption by different regions in 2012 has been shown in Figure 2-7.
Figure 2-7 : N-butanol consumption by regions, 2011 (Aster, 2012 )
The worldwide demand for n-butanol as a chemical is higher than 3.4 million tonnes per year, which is rising at over 4.4 percent each year. In addition, the market of butanol as a fuel blend stock has the possibility to grow to 122 million tonnes per year by 2020. Due to the unique potential of n-butanol to produce several value added products (e.g. butadiene, resins and 1-butene), it is anticipated that its total market opportunity will grow faster in the near future (greenbiologics, 2014).
2.3.3 Butanol production
Currently, butanol is mainly synthetic and is produced through a petrochemical route. Therefore, the production costs of synthetic butanol are mainly dependent on the market of crude oil. It can also be produced via ABE (acetone-butanol-ethanol) fermentation process. This biological process, due to use of renewable biomass including industrial and agricultural wastes as feedstock, is environmentally friendly. However, employing this bioprocess mainly depends on
the availability of abundant and cheap feedstock (Cascone, 2008; Dürre, 2007). As a result, if bio-butanol can be produced from renewable resources, and in an economically feasible way, it can be a replacement for bio-ethanol and bio-diesel in the bio-fuel market, assessed to be $247 billion by 2020 (Green, 2011).
2.4 Bio-butanol production: Brief history
To produce bio-butanol, usually ABE (acetone-butanol-ethanol) fermentation is involved. The ABE fermentation is one of the first large-scaled industrial processes, which can produce bio-butanol by fermentation of carbohydrates, and using solvents-producing strains of Clostridium (Kalil et al., 2003).
The ABE fermentation process was first used in the UK in 1912, in order to produce acetone for munitions. It was rapidly accepted for commercial production during World War I and II. After the end of World War II, due to the easier and cheaper petrochemical production of solvents, the bio-based solvent production was no longer cost effective, and this process became inefficient. Therefore, the fermentation process started to experience a decline, and by the 1960’s, it was almost stopped in the U.S (Marlatt et al., 1986).
Recently, research into the ABE fermentation process received much more interest and researchers hope to improve fermentation process and bring bio-butanol back to the bio-fuels market (Figure 2-8).
2.5 Bio-butanol production from hemicelluloses: Process
As discussed earlier, butanol, in addition to the chemical pathways, can be produced through biological methods under anaerobic conditions. The Clostridia spices are anaerobic microorganisms that was discovered by Haim Weizmann (Weizmann et al., 1937)and are well known for butanol production (Szulczyk, 2010). However, just a few types of Clostridium are able to use cellulose and hemicelluloses as a fermentation feedstock (Szulczyk, 2010).
As compared to the chemical methods of butanol production, the biological process has several advantages such as: ability to use the renewable resources (e.g. switch grass, wheat and corn core), higher product selectivity, and less formation of by-products. Furthermore, the operation conditions of butanol production through biological methods are milder than that of chemical processes, and the product separation is easier.
On the other hand, the pulp and paper industry is struggling with one of the toughest crises of its history. Therefore, to remain viable, the attempts should be focused on making the Canadian pulp and paper mills able to increase their revenue. The bio-refinery concept by production of large spectrum of value-added bio-fuels and chemicals from agricultural and forestry biomass, employing new technologies, and penetrating new markets can offer an opportunity to stimulate the Canadian pulp and paper industry and make it more competitive (Marinova et al., 2009). A hemicelluloses extraction step is usually integrated in Kraft mill with dissolving pulp production, prior to pulping. This extracted hemicelluloses can be used as a feedstock to produce promising and valuable products such as xylitol, furfural and fuels (e.g. butanol and bio-ethanol) (Hu et al., 2008).
Recently, several studies have focused on investigating the economic profitability, and technical feasibility of butanol production from extracted hemicelluloses (Tunc et al., 2008).
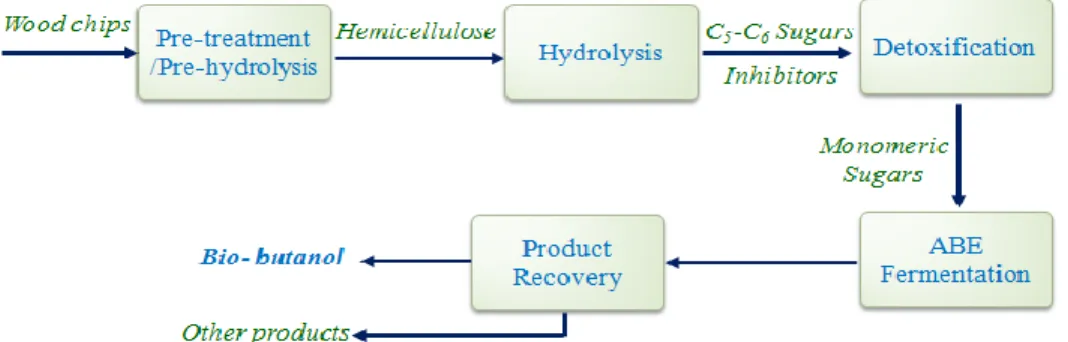
Basically, the conversion of lignocelluloses to bio-butanol (Figure 2-9) consists of the following steps (Chegini et al., 2013b; Lynd et al., 2002)
Pre-treatment / Pre-hydrolysis: To make the material more susceptible and accessible for degradation in order to release the hemicelluloses contained in the material (hemicelluloses extraction);
Hydrolysis: To transform the hemicelluloses to fermentable sugars (in some research, the pre-hydrolysis and hydrolysis processes are integrated, and these processes are performed in one stage, and presented as pre-treatment, pre-hydrolysis or hydrolysis step) (Liu et al., 2013);
Detoxification: To remove the fermenting toxic materials formed during pre-hydrolysis and hydrolysis;
Fermentation: To convert the fermentable sugars to bio-butanol;
Product recovery: To separate the butanol;
Figure 2-9 : Bio-butanol production from biomass (Chegini et al., 2013b)
2.5.1 Pre-treatment/ Pre-hydrolysis
The first step of butanol production from biomass is pre-treatment, which in some references is also known as pre-hydrolysis.
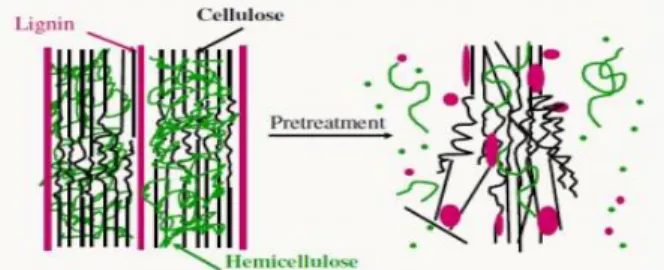
In this step, the complex structure of lignocellulosic biomass is broken down (Figure 2-10) and with changing/removing the obstructing composition, the hydrolysis rate in further steps can be improved (F. Carvalheiro et al., 2008; Lynd et al., 2002). During the pre-hydrolysis process, the chains of hemicelluloses can be broken into oligosaccharides.
An efficient and cost-effective pre-hydrolysis method should be able to: minimize the formation of possible inhibitors, prevent the sugar loss and increase the hemicelluloses recovery. In addition, it should has low energy requirements, as well as low demand of subsequent processes such as washing and detoxification (Kumar et al., 2009; Zheng et al., 2009).
Figure 2-10 : Schematic of effects of pre-treatment process on lignocellulosic biomass structure (Mosier et al., 2005)
There are several pre-treatment methods, which are divided into different categories including physical, chemical, biological or a combination of them (Kumar et al., 2009). These pre-treatment processes are summarized in Table 2-4.
Table 2–4 : Pre-treatment processes for lignocelluloses Adopted from (Szczodrak and Fiedurek 1996, Szulczyk 2010)
Pre-treatment Method
Operation resulting changes in the structure of substrate
Main changes
Physical
Milling and grinding (pressure, hammer, ball and ball), high temperature (steam explosion and pyrolysis), irradiation ( microwaves and electron beam), auto-hydrolysis;
Reduction in crystallinity and polymerization degree of cellulose, partial degradation of lignin and hydrolysis of
hemicelluloses;
Chemical Alkalis, acids, organic solvent, gases,
reducers, oxidizers;
Delignification, decrease of crystallinity and polymerization degree of cellulose;
Biological
White-rot fungi (Pycnoporus, Phlebia, Pleurotus, Ischnoderma, etc.)
Delignification and reduction in degree of polymerization of cellulose and hemicelluloses;
Combined
Grinding followed by acid or alkaline treatment, Alkali-pulping associated with steam explosion;
Degradation of hemicelluloses, delignification
Usually, the hot water pre-treatment, due to its advantages such as limited equipment corrosion, less operational and capital cost, and lower cellulose break down receives much more attention. In addition, water is the main reagent in this method, which makes this process more economical and environmentally friendly than other pre-treatment methods (Tunc et al., 2008).
Another often used technique for pre-hydrolysis of lignocellulosic biomass is steam explosion, during which the biomass is treated with vapor under high pressure and temperature, and a rapid decomposition is performed. This causes the explosion of the biomass structure and its degradation , which facilitates the hydrolysis process (Peng et al., 2012, Lu, 2013 ).
2.5.2 Hydrolysis
As discussed earlier, during pre-hydrolysis of lignocellulosic biomass, the chains of hemicelluloses polysaccharide can be broken down into oligosaccharides and then can be hydrolysed to monosaccharides (fermentable sugars).
In order to perform the biomass hydrolysis process, several technologies have been employed including acid, enzymatic and alkaline hydrolysis. The performance and process conditions of different hydrolysis processes are compared in Table 2-5.
Table 2–5 : Comparison between dilute-acid and concentrated acid hydrolysis (Mohammad, 2008; M. J. Taherzadeh et al., 2007)
Hydrolysis Process Conditions Advantages Disadvantages
Concentrated acid 30-70 % H2SO4 T = 40 ºC Time = 2-6 h - Operated at low temperature - Higher sugar yield - High reaction rate
-High acid consumption -High cost and energy
consumption for acid recovery -Longer reaction time
-Corrosion and environmental problem - Inhibitor formation Dilute acid 1-5 % H2SO4 T = 215 ºC Time = 3 min
- Low acid consumption - Short residence time - High sugar recovery - High reaction rate
-Operated at high temperature - Equipment corrosion
- Low sugar yield -Inhibitor formation
Alkaline 18 % NaOH
T = 100 ºC Time = 1 h
High reaction rate
-Low sugar yield
-Sugar decomposition by alkali attack
Enzymatic T = 100 ºC
Time = 1.5 day
-High yield of relatively pure sugar
-Mild operating conditions -No environmental
and corrosion problems
-Pre-treatment of biomass required
-High cost of cellulose enzymes - Low hydrolysis rate
In acid hydrolysis techniques, dilute acid hydrolysis and concentrated acid hydrolysis are used. Sulphuric acid is commonly employed, although other acids such as HCL have been applied as well (Dehkhoda, 2008; Kumar et al., 2009).
The dilute acid hydrolysis process can be operated at high operating conditions with relatively short reaction time. Generally, during this process, the degradation of lignocellulosic biomass into sugars occurs. In general, hemicelluloses, due to its lower degree of polymerization (DP) and its branched structure are more sensitive to hydrolysis than cellulose. Therefore, the degradation of hemicellulosic sugars (mainly pentose sugars) is faster than cellulose-based sugars (six carbon sugars). By applying hydrolysis process in two stages, the yields of sugar conversion can be improved. The first stage is operated under moderate operating conditions to obtain the pentose sugars, while the recovery of hexoses can be optimized in the second hydrolysis stage (Mohammad, 2008).
The concentrated acid process is performed in relatively moderate conditions, with a much longer reaction time (Anish et al., 2009; Kumar et al., 2009). Similar to the dilute acid hydrolysis, the hemicelluloses break down into monomeric sugars, and provide the carbon source in the fermentation process (Lee et al., 1999).
The main challenges of the acid hydrolysis are their negative environmental effects, corrosion problems and high operating costs. Furthermore, during acidic hydrolysis, in addition to the fermentable sugar formation, some other by-products can also be generated. These by-products can be acetic acid (derived from acetyl groups), sugar products (furfural or hydroxymethylfurfural), and lignin derived compounds (Larsson et al., 1999). They usually obstruct the further bioconversion of monomeric sugars into desired products, and decrease the yield of fermentation step. This inhibitor formation can be considered as one of the main drawbacks of acidic hydrolysis.
Besides acids, the enzymes can also be used to degrade the hemicellulosic polymers into simple sugars at low temperatures. The enzymes with this ability are mostly known as hemicellulase ( in general, the hemicellulase enzymes are classified under cellulase enzymes) (Smith, 2007). The moderate operating conditions, low by-product generation, and non-adverse reaction medium make the enzymatic hydrolysis a common process of lignocelluloses conversion to bio-fuels. However, compared to other hydrolysis techniques, some factors such as longer required
retention time, high cost of enzymes and low hydrolysis rate can limit the usage of the enzymatic hydrolysis process on industrial scale (Cardona Alzate et al., 2006; Kumar et al., 2009). The biomass hydrolysis can also be performed by employing an alkaline solution. Compared to other hydrolysis techniques, alkaline hydrolysis needs lower temperature and pressure, and can be performed at ambient conditions. However, the yield of sugar recovery is relatively low (Mohammad, 2008).
In this work, due to advantages of dilute acid hydrolysis this method was considered as hydrolysis method. The typical sugar profiles in acidic hydrolysates generated from hardwood are shown in Table 2-6.
Table 2–6 : Average sugar profiles of hardwood hemicelluloses acidic hydrolysates; (Nigam, 2001) Sugar Concentration (g/L) Xylose 26.7 ± 1.30 Glucose 3.0 ± 0.18 Galactose 1.7 ± 0.02 Arabinose 1.5 ± 0.03 Mannose 6.5 ± 0.22
2.5.3 Detoxification
2.5.3.1 Formation of inhibitorsThe dilute-acid treatment is a quick and inexpensive method to generate sugar from lignocelluloses (Larsson et al., 1999). However, the main disadvantage of this process is the formation of various by-products. Some of these compounds could have toxic effects on the cell growth, and decrease the yield and productivity of fermentation (Larsson et al., 1999; Zhuang et al., 2009). The formation of inhibitors is due to the following reasons:
Some inhibitors may exist in the raw materials that are simply released during the pre-hydrolysis/hydrolysis treatments. An example is the phenolics, which are originating from lignin.
Other inhibitors (e.g. acetic acid originating from acetylated hemicelluloses) can be found as side groups on the hetero–polymers, cut off during the pre-hydrolysis /hydrolysis steps.
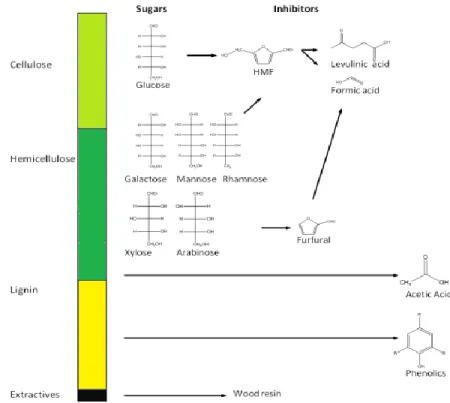
The pre-hydrolysis and hydrolysis treatments may result in further degradation of lignin and monomeric sugars to three major groups of compounds that may inhibit the fermentation step. The inhibitors can be divided into three main groups (Figure 2-11): furan compounds including furfural and HMF derived from sugars, phenolic components (e.g. p-hydroxybenzaldehyde and vanillin) that are lignin derivatives, and finally weak acids (e.g. acetic, formic and levulinic), which can be formed from degradation of sugars (Palmqvist et al., 2000).
Figure 2-11 : The structural profile of fermentation inhibitors derived from lignocellulosic biomass with acidic treatment (Almeida et al., 2007; David Lukas Grzenia, 2011)
The inhibition of microbial growth and fermentation yield is specific (Table 2-7) both for each inhibitor and each microorganism. It mainly depends upon the type of fermenting organism, inhibitor concentration, cultivation conditions (e.g. temperature and pH), and cultivation mode. As it can be seen in Table 2-7, for any given microorganism, the toxic concentration for different inhibitors may vary. However, in most cases for the clostridium genus (the applied organism in present study), the following inhibitors are reported in order of reducing toxicity.
Table 2–7 : The toxic effects of inhibitors on some microorganisms
Candida guilliermondii FTI 20037 Acetic acid in concentrations higher than 3g/L can inhibit xylose metabolism
(Felipe et al., 1995)
Clostridium. beijerinckii BA101 Furfural (2 g/L) and HMF (1 g/L) do not have inhibitory effects on microorganism. However the mixture of them affects the culture negatively.
Also C. beijerinckii BA101 is not inhibited by acetates; instead higher solvents are produced by the culture under high Concentrations of acetate in the medium.
(Ezeji, Qureshi, & Blaschek, 2007)
Clostridium beijerinckii NCIMB 8052
1 g/L of phenolic compound (e.g., p-coumaric acid, ferulic acid, 4-hydroxybenzoic acid, vanillin acid, syringaldehyde and vanillin) inhibited cell growth by 64 -74%, while entirely inhibiting the butanol production.
(Cho, Lee, Um, Sang, & Kim, 2009)
Clostridia acetobutylicum ATCC824
100 mg/L vanillin ( phenolic compound) decreased the butanol yield from 0.19 gg-1 xyloseto 0.046 gg-1.
(Sun & Liu, 2012)
Clostridium acetobutylicum
By addition of 3.7 ~ 9.7 g/L acetic acid, the ABE concentration increased slightly, while it drastically reduced in the presence of 11.7 g/L acetic acid. But, the solvent production of C. beijerinckii was not affected by addition of acetic acid in the range of 3.7 ~ 11.7 g/L.
(Cho, Shin, & Kim, 2012)
P. stipitis In the presence of 2 g/L furfural and 3 g/L acetic acid, no sugar
consumption was reported and cellular growth was completely inhibited.
(Chaud, Silva, Mattos, & Felipe, 2012; Díaz et al., 2009)
2.5.3.1.1 Organic acids
The most common existent weak acids in lignocelluloses hydrolysates are acetic acid, levulinic acid and formic acid. The levulinic and formic acids are derived from HMF breakdown, while acetic acid is mainly produced from acetyl groups in the hemicelluloses.
Formic acid can additionally be generated from furfural at high temperature and under acidic conditions. There are also various types of fatty acids including 9, 12-octadecadienoic and hexadecanoic. In addition, there are some branched aliphatic acids such as methyl botanedioic acid, methyl propanedionic acid and 2-methyl-2-hydroxybutanoic acid. These compounds, due to their low concentrations, do not have significant effects on the microorganism’s metabolism (Luo et al., 2002; Purwadi, 2006). It is well demonstrated that the acetic acid toxicity is dependent on pH (Gottschalk, 1986). Acetic acid is a weak acid and unlike strong acids, doesn't dissociate completely. The non-dissociated acids have negative effects on the cells and can hinder the cell growth. They are liposoluble compounds that can penetrate the cell membrane, and may dissociate inside the cell, where the pH is nearly neutral. In order to keep intracellular pH stable and take out the excess protons (H+ ions), the cell consumes energy (Luo et al., 2002; M. J. Taherzadeh et al., 2007). Hence, at a high concentration of un-dissociated acids ( higher than critical extracellular concentration), the transport rate of protons might exceed the diffusion capacity of membrane and intracellular acidification can happen, which results in cell death or cell growth hindering (Larsson et al., 1999; Palmqvist et al., 2000). The microorganism tolerance to acetic acid is case specific, and mainly depends on the microorganism and operating conditions. Taherzadeh represented the extracellular pH limit of yeast at several concentrations of acetic acid. It was observed that the yeast was able to grow in existence of 10 g/L acetic acid at its extracellular pH limit (higher than 4.7). Therefore, it was demonstrated that acetic acid is harmless if the cultivation is performed at a pH level not less than extracellular pH limit, or if its concentration is low (M. J. Taherzadeh et al., 1997). However, Maiorella observed the negative effects on microbial growth and an ethanol yield in as low as 0.25 g/ L of acetic acid (Maiorella et al., 1983).
2.5.3.1.2 Phenolic Compounds
The inhibitors derived from lignin are phenolics, polyaromatic compounds and aldehyides; it is considered that their toxicity is proportional to the molecular weight. It was found that phenolics
with lower molecular weight exhibit stronger toxic effects on microorganisms than those with higher molecular weight (Palmqvist et al., 2000). In lignocellulosic hydrolysates, there are several phenolic compounds, which have been detected such as ferulic acid, 3-methoxy-hydroxybenzaldehyde, vaniline, vanilic acid acetovanilone, hydroxyacetophenone, and 4-hydroxybenzoic acid (Luo et al., 2002); the type of generated phenolics mainly depends on the applied biomass (Klinke et al., 2003).
The phenolic compounds, are one of the inhibitors with high toxic effects (Larsson et al., 1999). It has been observed that low molecular weight phenolics can limit the cell growth of S. cereviseae in the fermentation process (Larsson et al., 1999). In addition, it has been shown that about 1 g/L of 4-hydroxybenzoic acid caused about 30% reduction in the ethanol yield in comparison with the control fermentation. It has also been reported that inhibition of fermentation was reduced, when phenolic compounds were specially eliminated from a willow hydrolysate (Jönsson et al., 1998 ).
The phenolic components break up the biological cell membrane and cause integrity damage. Therefore, the membrane ability to act as a selective barrier can be disturbed (Luo et al., 2002; Parawira et al., 2011). However, their inhibition mechanism has not been clarified yet (Luo et al., 2002; Parawira et al., 2011).
2.5.3.1.3 Furan compounds
Furans, including furfural and 5-hydoxymethyl furfural, are a major group of inhibitors. The level of furans compounds based on the source of substrate and the applied pre-hydrolysis/ hydrolysis methods can differ. For example, the concentration of HMF in spruce hydrolysate may vary from 2.0 g/L to 5.9 g/L related on, whether the dilute acid hydrolysis is carried out in one step or two steps (Almeida et al., 2007).
Furfural has been reported to have a strong inhibitory effect on S. Cerevisiae. Concentrations above 1 g/L of furfural significantly reduce the cell multiplication, the rate of CO2 evolution, and the total number of viable cells in the preliminary fermentation phase (Boyer et al., 1992; Parawira et al., 2011; Sanchez et al., 1988; M. J. Taherzadeh et al., 1997). During aerobic fermentation, furfural is oxidized to furoic acid, while during an anaerobic cultivation; furfuryl alcohol can be generated from furfural reduction. It is believed that alcohol dehydrogenase is
responsible for furfural transformation in both cases (Luo et al., 2002; Palmqvist et al., 2000; M. J. Taherzadeh et al., 1997).
Due to the structural similarity of HMF and furfural, their inhibitory effects are similar. However, the experimental results showed that in comparison to HMF, furfural has stronger toxic effect on fermentation and growth of S. cerevisiae. It was also shown that adding 4 g/L of HMF reduced the specific growth rate with 70%, the CO2 evolution rate with 32%, and the ethanol production rate with 40% (M. Taherzadeh et al., 2000), while the same amount of furfural showed a stronger inhibitory effect. (M. Taherzadeh et al., 2000).
2.5.3.2 Detoxification Methods
As discussed earlier, biomass hydrolysis produces not only monomeric sugars but also different compounds, which may have inhibitory effects on the microbial metabolism and sugar conversion to the bio-fuels. In some cases, the existence of one compound can increase the inhibition of other compounds on the microorganism’s metabolism. As an example, this synergetic toxicity demonstrated that the formation of acetic acid and furfural can cause an undesirable effect on cell mass production, growth rate and ethanol production yield of S.cerevisiae (Palmqvist et al., 2000). Thus, it is necessary to eliminate inhibitors to a minimal level. Moreover, it should be considered that the composition of inhibitor components depends on the source of lignocellulosic biomass, the employed pre-hydrolysis/ hydrolysis methods, and the applied operational conditions (e.g. pressure, time, pH and temperature). This variety resulted in development of different detoxification methods, which can be chemical, physical or biological (David Lukas Grzenia, 2011). In table 2-8, several detoxification techniques that have been reported in literature to remove toxic components from biomass hydrolysates are compared. However, due to the different toxicity tolerance levels of various microorganisms, comparing the efficiency of the detoxification methods is not easy. Essentially, each method is efficient in removing specific inhibitors. Some methods reduce the sugar contents, which results in lower bio-fuel yield. In some cases (e.g. poplar hydrolysate) the combination of two or more detoxification processes may increase the ethanol production (Cantarella et al., 2004). However, an economic evaluation had not been carried to show if the combination of two detoxification process is practical on an industrial scale (David Lukas Grzenia, 2011).
Table 2–8 : Comparison of different detoxification methods to remove inhibitors from lignocellulosic hydrolysates
Process Advantages Disadvantages References
Physical Methods
Evaporation/ Concentration
Removing inhibitors by evaporation in a vacuum concentrator based on the volatility
Reduces volatile compounds such as acetic acid, furfural, and vanillin -Increasing the non-volatile inhibitors as extractives (Anish et al., 2009) (Mussatto et al., 2004) Membrane
Membranes have surface functional groups attached to their internal pores, which may eliminate metabolic inhibitors
Avoids the need to disperse one phase and minimize the entrainment of small amounts of organic phase - High cost - Selective removal of inhibitors (Anuj K Chandel et al., 2011; David L Grzenia et al., 2012)
Chemical/ Physiochemical Methods
Activated Charcoal
Adsorption of toxic compounds by charcoal, which is activated to increase the contact surface
-Low cost
- Remove phenolics and furans
- Low sugar loss
Filtration complexity
(Mussatto et al., 2004)
(Canilha et al., 2004)
Overlimming -Increase of the pH followed by reduction - Precipitate toxic compounds
- High sugars loss - Filtration complexity
(Palmqvist et al., 2000)
Ion Exchange Resin
Resins change undesirable ions of the liquid phase to be purified by saturating of functional groups of resins
- Remove lignin-derived inhibitors, acetic acid and furfural
- Low sugars loss - can be regenerated and reused - High pressure - Long processing time - Possible degradation of fragile biological product molecules - hard to scale-up (Canilha et al., 2004) (Anuj K Chandel et al., 2011) (Carvalho et al., 2004) (Nilvebrant et al., 2001) Extraction with Organic Solvents
Mix of liquid phase to be purified with an organic solvent. The liquid phase is recovered by separation of two phases (organic and aqueous) -Recycling of solvents for consequent cycles - Remove acetic acid, furfurall ,vanillin and low molecular weight phenolics -High cost - Long processing time (Wilson et al., 1989) (Cantarella et al., 2004) Biological Methods Microorganism Specific enzymes or microorganisms that act on the inhibitors compounds present in hydrolysates and change their composition
- Low waste generation - Environmentally friendly - Less energy requirements Long processing time (Anish et al., 2009), (Anuj K Chandel et al., 2011), (Hou-Rui et al., 2009),(Yang et al., 2008)
In Table 2-9, non-biological detoxification methods, which have been applied to different lignocellulosic hydrolysates, are summarized. As it can be observed, each method represents its