UNIVERSITÉ DE MONTRÉAL
THE EFFECTS OF INTRACORTICAL MICROSTIMULATION PARAMETERS ON NEURAL RESPONSES
MEGHAN CHELSEA WATSON INSTITUT DE GÉNIE BIOMÉDICAL ÉCOLE POLYTECHNIQUE DE MONTRÉAL
THÈSE PRÉSENTÉE EN VUE DE L’OBTENTION DU DIPLÔME DE PHILOSOPHIAE DOCTOR
(GÉNIE BIOMÉDICAL) SEPTEMBRE 2015
UNIVERSITÉ DE MONTRÉAL
ÉCOLE POLYTECHNIQUE DE MONTRÉAL
Cette thèse intitulée :
THE EFFECTS OF INTRACORTICAL MICROSTIMULATION PARAMETERS ON NEURAL RESPONSES
présentée par : WATSON Meghan Chelsea
en vue de l’obtention du diplôme de : Philosophiae Doctor a été dûment acceptée par le jury d’examen constitué de : M. SAVARD Pierre, Ph. D., président
M. SAWAN Mohamad, Ph. D., membre et directeur de recherche M. DANCAUSE Numa, Ph. D., membre et codirecteur de recherche M. MATHIEU Pierre-A., D.Sc.A., membre
ACKNOWLEDGEMENTS
I would like to thank my supervisor Mohamad Sawan and co-supervisor Numa Dancause for their guidance and support during this PhD program, and Dr. Mathieu, Dr. Savard and Dr. Chapman for evaluating this thesis.
I would also like to express my gratitude to all the individuals who facilitated my research and training and contributed to my experience as a graduate student. I am especially grateful to those individuals who helped teach me the skills I have learned in this position which I will carry with me for a lifetime. In particular, I would like to thank Boris Touvykine for helping me with my surgeries, Eleonore Serrano, Ian Moreau Debord and Stephan Quessy for their support during my training, Kelsey Dancause and Guillaume Elgbeilli for consulting on statistical analysis, Philippe Drapeau for his assistance programming the stimulation equipment, and my family and friends for supporting me in my efforts.
This work was supported by the Canada Research Chair in Smart Medical Devices to Mohamad Sawan, and the National Sciences and Engineering Research Council of Canada Discovery grant to Numa Dancause. Additionally, I held a doctoral research scholarship from the Fonds de Recherche du Québec - Nature et Technologies (FRQNT) (2013-2014).
RÉSUMÉ
Les microstimulations de tissues nerveux du cerveau sont utilisés dans un grand nombre de prothèses sensorielles, de thérapies cliniques et autres activités de recherche se servant de la stimulation électrique. Actuellement, les paramètres de stimulation sont adaptés à chaque application via des tests itératifs. Les méthodes d'optimisation cherchent à améliorer les stimuli développés pour des objectifs spécifiques de stimulation, mais la compréhension fondamentale de la façon dont les paramètres de stimulation influencent les circuits neuronaux qu’ils activent reste largement incomplète. Ce déficit retarde l'optimisation de protocoles existants et rend le développement de nouvelles applications de stimulation difficile. À ce jour, un certain nombre de dispositifs prothétiques validés dès les années 1970 restent en développement, principalement en raison de l'incapacité de ces dispositifs à communiquer efficacement avec le cerveau. Pour utiliser la stimulation électrique afin de transmettre des messages au système nerveux central, une meilleure conception du patron du signal de stimulation est nécessaire. Dans cette thèse, nous étudions l'influence que chaque paramètre du signal (un courant constant, symétrique carré biphasique) exerce sur les réponses qu'il évoquées au travers des microstimulations de la zone intracorticale caudale du membre antérieur dans le cortex moteur chez le rat. Les paramètres de ce signal sont l'amplitude du courant, la fréquence et la durée d'impulsion, l’intervalle d'interphase et la durée du train. Leurs effets ont été évalués par un examen des réponses électromyographiques évoquées dans les muscles des membres antérieurs du rat en réponse à chaque stimulus. Les principaux résultats décrivent comment chaque paramètre de stimulation influence l'amplitude, la latence d’apparition et la durée de la réponse. Une composante jusque-là inexplorée du signal de la réponse (que nous appelons 'activation résiduelle') est aussi analysée pour la première fois. Les théories quant à l'origine et le mécanisme neuronal sous-jacent de ce phénomène sont proposés et les paramètres de stimulation touchant son apparition, la prévalence et la durée sont décrits. La fiabilité des signaux de stimulation pour évoquer des réponses cohérentes est également évaluée par rapport aux variations de paramètres. Une méthodologie pour la conception optimisée des signaux de stimulation est proposée en utilisant un modèle de calcul simple, représentant les relations d'entrée-sortie entre les paramètres de stimulation et les réponses qu'ils évoquent. Ce modèle utilise une approche de réseau neuronal artificiel et peut être utilisé pour prédire les propriétés de la réponse lorsque les paramètres du stimulus sont connus. Compte tenu de la prévalence de la stimulation cérébrale dans les applications cliniques, de
recherche et thérapeutiques, les procédures méthodologiques et de modélisation proposées ont des implications importantes dans l'optimisation des paradigmes de stimulation actuels et le développement de protocoles de stimulation pour de nouvelles applications.
ABSTRACT
Microstimulation of brain tissue plays a key role in a variety of sensory prosthetics, clinical therapies and research applications. At present, stimulus parameters are tailored to each application via iterative testing. Computational optimization methods seek to improve tried and tested waveforms developed for specific purposes, however the fundamental understanding of how stimulation parameters influence the neural circuits they activate remains widely unknown. This deficit hinders both the optimization of existing protocols and the development of new stimulation applications. To date, a number of prosthetic devices validated as early as the 1970’s linger in the development stages largely due to the inability to effectively interface these devices with the brain. In order to use electrical stimulation to convey messages to the central nervous system, a better understanding of stimulus signal design is required. In this thesis, I investigate the influence that each parameter of the constant-current, symmetric, biphasic square waveform exerts on the responses it evokes through intracortical microstimulation of the caudal forelimb area of the rat motor cortex. The parameters under investigation include the current amplitude, pulse frequency, pulse duration, interphase interval and train duration of the stimulus and effects were assessed by examining the electromyographic responses evoked in the rat forelimb muscles in response to each stimulus. The major findings describe how each parameter of the stimulus signal influences the magnitude, onset latency, and duration of the response. A previously unexplored component of the response signal (which we called ‘residual activation’) is analyzed for the first time. Hypotheses as to the origin and underlying neural mechanism of this phenomenon are proposed and the stimulus parameters affecting its occurrence, prevalence and duration are described. The reliability of stimulation signals for evoking consistent responses is also assessed with respect to parameter variations. A methodology for the informed design of stimulation signals is proposed and aided by the development of a simple computational model representing the input-output relationships between stimulation parameters and the responses they evoke. This model uses an artificial neural network approach and can be used to predict the properties of the response when the parameters of the stimulus are known. Given the prevalence of brain stimulation in clinical, research and therapeutic applications the proposed methodological and modeling procedures have important implications in the optimization of current stimulation paradigms and the development of stimulation protocols for new applications.
TABLE OF CONTENTS
ACKNOWLEDGEMENTS ... III RÉSUMÉ……… ... IV ABSTRACT…… ... VI TABLE OF CONTENTS ...VII LIST OF TABLES ...XII LIST OF FIGURES ... XIII LIST OF SYMBOLS AND ABBREVIATIONS... XV LIST OF APPENDICES ... XVII
CHAPTER 1 INTRODUCTION ... 1
1.1 Objectives ... 2
1.2 Synthesis of content ... 3
1.3 Contributions ... 4
CHAPTER 2 LITERATURE REVIEW ... 6
2.1 Rat motor cortex system ... 6
2.2 Stimulation signals ... 7
2.2.1 Current vs. voltage controlled waveforms ... 9
2.2.2 Pulse polarity ... 10
2.2.3 Monophasic vs. biphasic waveforms ... 10
2.2.4 Alternative waveforms ... 11
2.2.5 Signal selected for present study ... 12
2.3 Technical considerations of stimulus design ... 13
2.3.1 Stimulation induced tissue damage ... 13
2.3.3 Electrode configuration ... 15
2.3.4 Current spread ... 16
2.4 Known effects of intracortical microstimulation parameters ... 18
2.4.1 Visual cortex ... 18
2.4.2 Auditory cortex ... 20
2.4.3 Somatosensory cortex ... 21
2.4.4 Motor cortex ... 22
CHAPTER 3 ARTICLE 1: INTRACORTICAL MICROSTIMULATION PARAMETERS DICTATE THE AMPLITUDE AND LATENCY OF EVOKED RESPONSES ... 24
3.1 Presentation of the article ... 24
3.2 Abstract ... 24 3.3 Introduction ... 25 3.4 Methods ... 28 3.4.1 Experimental design ... 28 3.4.2 Stimulation protocol ... 29 3.4.3 Surgical procedures ... 31 3.4.4 Statistical analysis ... 32 3.5 Results ... 34
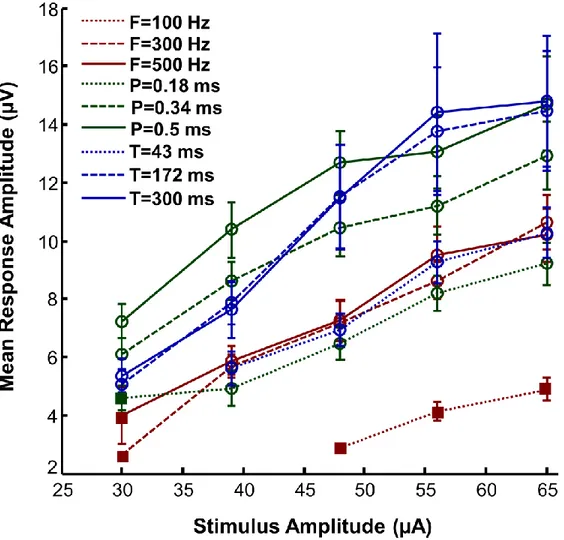
3.5.1 MEP response amplitude ... 34
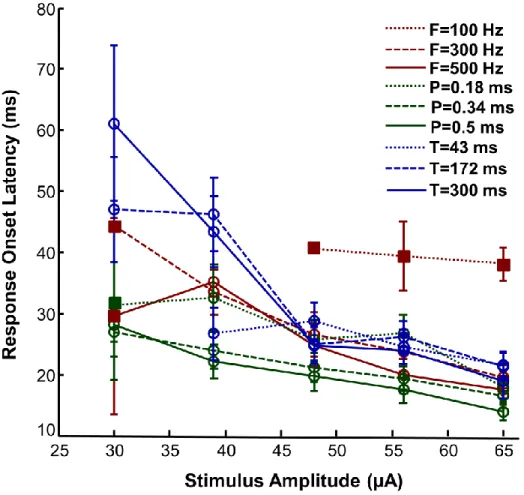
3.5.2 MEP onset latency ... 37
3.6 Discussion ... 40
3.7 Conclusion ... 43
3.8 Acknowledgements ... 43
CHAPTER 4 ARTICLE 2: INTRACORTICAL MICROSTIMULATION PARAMETERS DICTATE THE DURATION OF EVOKED RESPONSES ... 44
4.1 Presentation of the article ... 44
4.2 Abstract ... 44
4.3 Introduction ... 45
4.4 Methods ... 47
4.4.1 Surgical procedures and data collection ... 47
4.4.2 Stimulation protocol ... 48
4.4.3 Classification of MEP response components ... 51
4.4.4 Statistical analysis ... 52
4.5 Results ... 54
4.5.1 MEP main response duration ... 54
4.5.2 MEP residual activation occurrence and duration ... 57
4.5.3 Correlation between durations and other MEP parameters ... 59
4.6 Discussion ... 59
4.7 Conclusion ... 62
4.8 Acknowledgements ... 62
CHAPTER 5 ARTICLE 3: EFFICIENT MICROSTIMULATION OF THE BRAIN: A PARAMETRIC APPROACH ... 63
5.1 Presentation of the article ... 63
5.2 Abstract ... 63 5.3 Introduction ... 64 5.4 Methods ... 65 5.4.1 Experimental design ... 65 5.4.2 Stimulation protocol ... 65 5.4.3 Surgical procedures ... 67 5.5 Results ... 67
5.5.1 Ineffective stimuli ... 68
5.5.2 Inconsistent stimuli ... 69
5.5.3 Reliable stimuli ... 70
5.5.4 Improving reliability in restrictive paradigms ... 70
5.5.5 Functional limits ... 70
5.5.6 Parameters which cause neural adaptation ... 71
5.6 Conclusion ... 72
5.7 Acknowledgements ... 72
CHAPTER 6 ARTICLE 4: PREDICTION OF RESPONSES EVOKED BY INTRACORTICAL MICROSTIMULATION USING AN ARTIFICIAL NEURAL NETWORK MODEL……….. ... 73
6.1 Presentation of the article ... 73
6.2 Abstract ... 73
6.3 Introduction ... 74
6.4 Materials and methods ... 76
6.4.1 Surgical procedures and data collection ... 76
6.4.2 Stimulation protocol ... 78
6.4.3 Response metrics ... 79
6.4.4 Artificial neural networks ... 80
6.4.5 ANN simulation in MATLAB ... 82
6.5 Results ... 84
6.5.1 Network performance ... 84
6.5.2 Goodness of fit ... 85
6.6 Discussion ... 87
6.6.2 Improving ANN performance ... 88
6.6.3 Implications of the model ... 88
6.6.4 Using the model ... 90
6.6.5 Extending the model principles to other applications ... 91
6.7 Conclusions ... 91
6.8 Acknowledgements ... 91
CHAPTER 7 GENERAL DISCUSSION ... 92
CHAPTER 8 CONCLUSION AND RECOMMENDATIONS ... 97
PUBLICATIONS ... 98
BIBLIOGRAPHY ... 99
LIST OF TABLES
Table 2-1: List of parameter ranges used in a common brain stimulation applications. ... 22
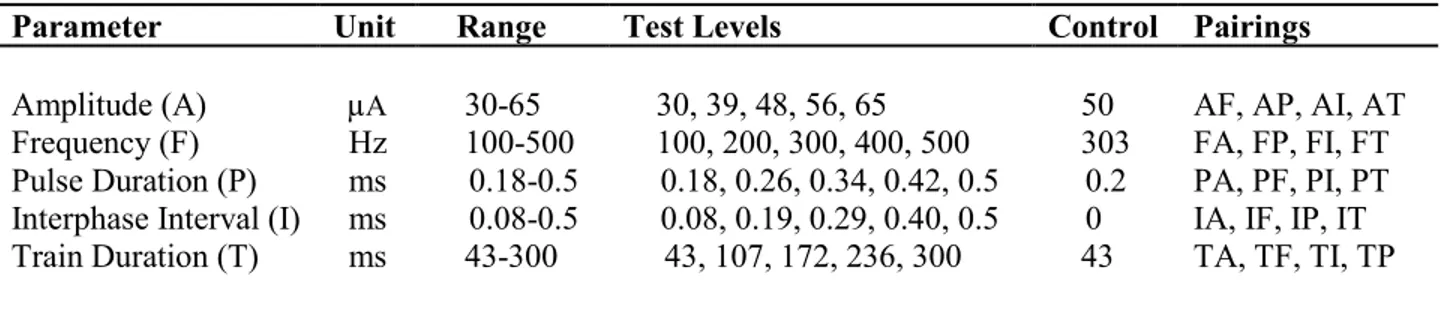
Table 3-1: Parameter test values ... 31
Table 4-1: Parameter test values. ... 49
Table 5-1: Parameter test values ... 66
LIST OF FIGURES
Figure 2-1: Experimental design: rat motor cortex circuitry, system inputs and outputs.. ... 8
Figure 2-2: Common stimulation signals.. ... 9
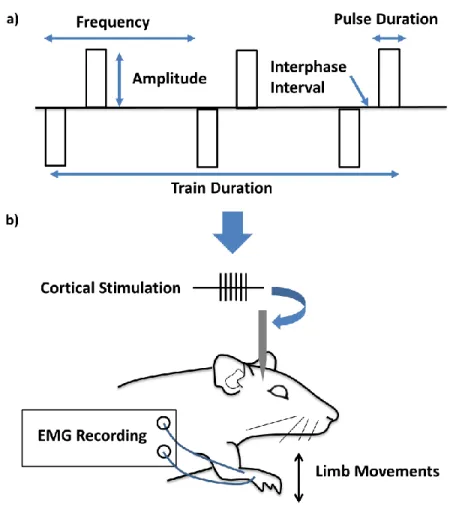
Figure 3-1: Parameters of the constant-current, biphasic square waveform (a), and a schematic representation of the experimental task (b). ... 29
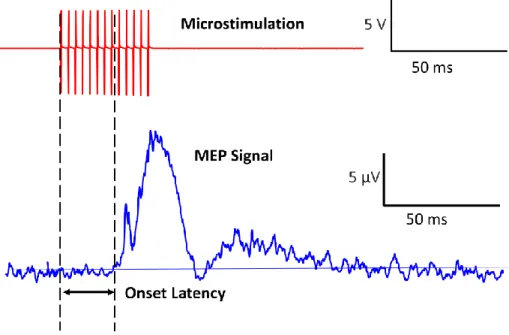
Figure 3-2: Illustration of performance measurements of the MEP signal.. ... 33
Figure 3-3: Representation of the MEP amplitude (mean ± SE) as a function of stimulus amplitude for all parameter pairings.. ... 35
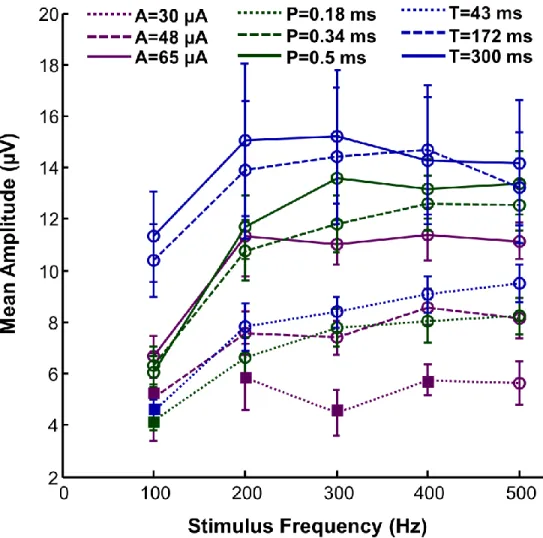
Figure 3-4: Representation of the MEP amplitude (mean ± SE) as a function of stimulus frequency for all parameter pairings. . ... 36
Figure 3-5: Representation of the MEP onset latency (mean ± SE) as a function of stimulus amplitude for all parameter pairings.. ... 38
Figure 3-6: Representation of the MEP onset latency (mean ± SE) as a function of stimulus frequency for all parameter pairings.. ... 39
Figure 3-7: Representation of the MEP onset latency (mean ± SE) as a function of interphase interval.. ... 40
Figure 4-1: Parameters of the constant-current, biphasic square waveform. ... 49
Figure 4-2: Classification of MEP Signal Components.. ... 53
Figure 4-3: Representation of the MEP main response duration (mean ± SE) as a function of stimulus amplitude. ... 55
Figure 4-4: Representation of the MEP main response duration (mean ± SE) as a function of stimulus train duration. ... 56
Figure 4-5: Comparison of MEP residual activation duration occurrence, mean and range as a function of stimulus amplitude. . ... 58
Figure 5-1: Parameters of the constant-current, biphasic square waveform. ... 66
Figure 5-2: Influence of stimulus frequency and amplitude on signal reliability.. ... 68
Figure 5-3: Influence of stimulus pulse duration and amplitude on signal reliability.. ... 69
Figure 5-4: Influence of stimulus train duration and amplitude on signal reliability. ... 71
Figure 6-1: ANN model design. ... 82
Figure 6-2: Computational implementation of ANN model. ... 83
Figure 6-4: Network fit-correlation analysis.. ... 86 Figure 6-5: Network fit-error analysis. ... 87
LIST OF SYMBOLS AND ABBREVIATIONS
AF Amplitude and frequency pairing
AI Amplitude and interphase interval pairing ANN Artificial neural network
AP Amplitude and pulse duration pairing AT Amplitude and train duration pairing
CFA Caudal forelimb area
DBS Deep brain stimulation
EEG Electroencephalography
EMG electromyography
FA Frequency and amplitude pairing
FFN Feed forward neural network
FI Frequency and interphase interval pairing fMRI Functional magnetic resonance imaging FP Frequency and pulse duration pairing FT Frequency and train duration pairing
GPi Globus pallidus interna
HFLD-ICMS High frequency long duration intracortical microstimulation HFSD-ICMS High frequency short duration intracortical microstimulation ICMS Intracortical microstimulation
IW Input weights
LW Layer weights
M1 Primary motor cortex
MDS-UPDRS Movement disorder society unified Parkinson’s disorder rating scale
MEP Motor evoked potential
MSE Mean square error
MT Middle temporal area of visual cortex PA Pulse duration and amplitude pairing PF Pulse duration and frequency pairing
PI Pulse duration and interphase interval pairing PT Pulse duration and train duration pairing IA Interphase interval and amplitude pairing IF Interphase interval and frequency pairing IP Interphase interval and pulse duration pairing IT Interphase interval and train duration pairing
RNN Recurrent neural network
SE Standard error
SPSS Statistical package for the social sciences (software)
STN Subthalamic nucleus
TA Train duration and amplitude pairing TF Train duration and frequency pairing
TI Train duration and interphase interval pairing TP Train duration and pulse duration pairing
LIST OF APPENDICES
Appendix A: Input output data ANN model ... 120 Appendix B: ANN MATLAB tutorial. ... 127
CHAPTER 1
INTRODUCTION
Electrical stimulation of the brain serves as the foundation for a variety of clinical therapies, sensory prosthetics and research applications. In the clinical setting, brain stimulation is used to alleviate symptoms of Parkinson’s disease (Bronstein et al., 2011) and epilepsy (Fisher, 2012) and applications for the treatment of Huntington’s disease, cluster headaches, Tourette’s syndrome, chronic pain, major depression, schizophrenia, obsessive compulsive disorder, multiple sclerosis, and Alzheimer’s disease are currently being explored (Lyons, 2011; Sironi, 2011).
Recently, sensory prosthetics have been developed to restore lost functioning or augment normal perception. Electrical stimulation of the somatosensory cortex produces tactile sensations which can restore a sense of touch to a prosthetic limb user (Berg et al., 2013; Kim, Callier, Tabot, Tenore, & Bensmaia, 2015; Tabot et al., 2013), and it has been postulated that this stimulation could also serve to extend the normal range of perception (Thomson, Carra, & Nicolelis, 2013). Similar efforts have been made to restore sight to the blind by applying electrical stimulation to the visual cortex (Bartlett et al., 2005; Brindley, 1973; Brindley, 1982; Brindley & Lewin, 1968; Dobelle & Mladejovsky, 1974; Penfield & Perot, 1963; Schmidt et al., 1996; Tehovnik, Slocum, Smirnakis, & Tolias, 2009). Stimulation of the visual cortex produces punctate visual percepts which can be activated in patterns to form a representation of the visual field similar to a scoreboard or highly pixelated image.
Countless research applications involving many different regions of the brain use electrical stimulation to explore the function and connectivity of neural circuits or attempt to disrupt or augment normal brain processes. Stimulation delivered to middle temporal area (MT) of the visual cortex can be used to bias motion correlation detection (Murasugi, Salzman, & Newsome, 1993; Salzman, Britten, & Newsome, 1990; Salzman, Murasugi, Britten, & Newsome, 1992) and stimulating the superior colliculus can bias or induce saccadic eye movements (Horwitz & Newsome, 2001; Schiller & Stryker, 1972). Electrical stimulation of the auditory cortex can induce the perception of tones (Otto, Rousche, & Kipke, 2005; Penfield & Perot, 1963), visual cortex stimulation produces visual percepts (Dobelle & Mladejovsky, 1974; Penfield & Perot, 1963; Schmidt et al., 1996), and motor cortex stimulation can evoke muscle contractions or movements (Donoghue & Wise, 1982; Gioanni & Lamarche, 1985; Penfield & Boldrey, 1937).
Despite the prevalence and inherent value of brain stimulation as both a therapeutic method and research tool, little is known about how the electrical stimulus shapes the responses it evokes. Most applications are developed through trial and error and rely heavily on stimulation signals which have proved successful in previous experiments. The work contained in this thesis sought to address this knowledge deficit by exploring the manner in which the parameters of the electrical stimulation signal affect the responses they evoke. The research conducted in this thesis was part of a larger ongoing project of the Polystim Neurotechnologies research group at Ecole Polytechnique de Montreal led by Dr. Mohamad Sawan which seeks to develop an intracortical visual prosthetic device to restore functional vision to the blind. My work aimed to address the issue of interfacing a prosthetic device with the brain by determining how stimulation signals should be designed in order to support effective communication between the device and the brain. The expertise in neural systems and brain stimulation was provided through a collaborative effort with the laboratory of Dr. Numa Dancause of the Universite de Montreal’s Department of Neuroscience. The Dancause laboratory focuses in part on the study of primary motor control of movements in the rat model. This collaboration allowed me to study the influence that each parameter of an electrical stimulus exerts on the responses they evoke while working within a well-documented cortical circuit of moderate complexity.
1.1 Objectives
The main objectives of this thesis were to determine how a stimulation signal shapes the responses it evokes and to uncover the general relationships between stimulation inputs and response outputs for neural systems. This problem was approached by addressing the following specific objectives:
a) Review past stimulation experiments to determine the most prevalent type of stimulus signals, the functional ranges of each signal parameter and previously identified parameter effects.
b) Design experiments to systematically test the effects of each parameter of a stimulus signal on the evoked responses.
c) Propose a stimulus design methodology based on the parameter effects to aid in the optimization of existing stimulation paradigms and facilitate the development of new paradigms.
d) Model the input-output relationship between stimulation parameters (input) and evoked responses (output) to provide a tool for the informed design of stimulation signals.
1.2 Synthesis of content
Chapter 2 of this thesis addresses objectives (a) and (b) through extensive review of past stimulation experiments conducted in a wide variety of species and brain areas for many different applications. Initially, the rat motor cortex system is discussed in terms of its suitability for conducting systematic tests of parameter effects. Once the choice of system and species has been justified, the most prevalent stimulation signals and choice of signal type are described. Following this, the broader technical considerations which must be taken into account when designing a stimulus are covered, then the known effects of stimulation parameters discovered in past studies involving intracortical microstimulation and macrostimulation are reviewed. To conclude chapter 2, a brief summary of the findings is presented to set the stage for the experimental work of the following chapters.
Chapters 3-5 address objectives (b) and (c) through the experimental study of stimulus parameter influence on evoked response properties. Each parameter of the stimulation signal is described in terms of its ability to influence the evoked response’s magnitude, onset latency, duration, and reliability. In these chapters, the beginnings of a design methodology are proposed.
Chapter 6 addresses objectives (c) and (d) through the development of a computational model describing the input-output relationship between stimulus parameters and the responses they evoke. The model describes the general relationships between the stimulus parameters and the evoked response metrics and can be used for both the optimization of existing paradigms and the development of new ones. The model serves to consolidate the work of chapters 3-5 and proposes an official methodology for the design of stimulation signals.
1.3 Contributions
The main contributions of this thesis are reported in three articles submitted to peer-reviewed journals and one conference paper. A summary of the major contributions is as follows:
1) Identification of the most commonly used brain stimulation signal parameters in a multitude of clinical and research applications. These parameter ranges were obtained from a comprehensive review of the literature and a subset of these values was selected for testing in the experimental work.
2) Thorough documentation of the specific effects of stimulus parameters on the amplitude, onset latency, duration and reliability of the responses evoked by intracortical microstimulation of the rat motor cortex. This contribution required original research involving systematic experimental testing conducted in animal models and provided specific information about the effects of intracortical microstimulation in the rat motor cortex. These findings were also interpreted generally to describe the effect each stimulus parameter exerted on neural activation in general in order to be extended to other applications.
3) Improved optimization of the standard motor cortex stimulus in the rat model. In the course of our studies we discovered that the commonly accepted signal for movement generation in the caudal forelimb region of the rat could be further optimized.
4) Quantification and assessment of a previously undocumented component of the evoked response signal. We observed that certain stimuli produced responses with activity that persists after the termination of the main response component. We named this persistent activity “residual activation”, and to our knowledge, this component has not been systematically analyzed previously. We documented its characteristics and occurrence with respect to the stimulus parameters that induce it and provided possible interpretations of its origin and neural underpinnings.
5) Methodology for stimulus design. We proposed a shift in the approach to stimulus design in which we seek to avoid conventional trial and error approaches and instead employ a two step process based on insights gained during experimentation pertaining to the general effects of stimulus parameters on neural activation. In this process we first consider the neural
activation required to achieve a specific goal of stimulation and then determine the stimulation parameters required to induce the necessary neural activation.
6) Artificial neural network (ANN) model of the input-output relationships between stimulation parameters and the responses they evoke. We provide a model for predicting the effects of stimulation parameters on evoked responses as a tool for designing stimulation signals. This model can be used directly in the rat motor cortex system and we also detail its extension to a number of applications. To our knowledge this is the first application of ANN modeling applied to the input-output relationships of brain stimulation.
CHAPTER 2
LITERATURE REVIEW
This review contains a theoretical study of past brain stimulation experiments and was conducted for the purposes of developing a series of experiments to systematically test the effects of stimulus parameters on the responses they evoke. This survey led to the discovery of a number of discrepancies and knowledge deficits to be addressed in order to develop a methodology for stimulation design. To overcome these knowledge deficits it was deemed prudent to first establish the general effects of stimulation parameters using a neural circuit of moderate complexity in as low of a mammal species as possible. In this chapter, the neural system, species and stimulus signal selected for the series of experiments are described and their selection is justified. Following this, the broader technical considerations for stimulus signal design are outlined and the known effects of stimulation parameters in a variety of different applications, species and brain regions are reviewed. The outcomes of this survey are the identification of prevalent stimulation signals and the definition of ranges for each stimulus parameter encompassing the values used for a wide variety of stimulation applications.
2.1 Rat motor cortex system
One of the earliest and most documented uses of brain stimulation involves the activation of motor cortex regions to evoke muscle contractions or movements (Penfield & Boldrey, 1937; Penfield & Welch, 1951; Sironi, 2011). Stimulation applied to specific regions of the motor cortex has been shown to evoke movements in humans (Penfield & Welch, 1951), primates (Asanuma, Arnold, & Zarzecki, 1976), cats (Armstrong & Drew, 1984) and rodents (Donoghue & Wise, 1982; Sanderson, Welker, & Shambes, 1984). The motor cortex exhibits a somatotopic organization in which a specific cortical region corresponds to a specific area of the body. Much study has been devoted to mapping the correlation between regions of the motor cortex and the areas of the body they control (Gioanni & Lamarche, 1985; Neafsey et al., 1986; Penfield & Boldrey, 1937; Rouiller, Moret, & Liang, 1993; Schieber, 2001). Of the systems described, the rodent motor system has the simplest structure and the rat forelimb region in particular has been studied extensively to probe function, connectivity and motor deficits.
For the purposes of our study, a system was required that produced clearly defined and measurable outputs in response to stimulation in an extensively documented neural circuit that was responsive to the parameter ranges most commonly used in clinical and research applications. The rat forelimb system proved to be a system which met all of these requirements. When electrical stimulation is applied to the forelimb region of the rat motor cortex, it activates corticospinal neurons which project from the cortex to the spinal cord. Within the spinal cord these efferent neurons are indirectly connected to the motor neurons which innervate the forelimb muscle fibers. When these fibers are activated they produces muscle contractions or limb movements and the corresponding electromyographic (EMG) responses can be recorded directly from the muscles of the forelimb (Figure 2-1 parts (a) and (b)). Working within this system allowed me to deliver a variety of stimulation signals to the cortex and record the evoked EMG responses. Analysis of the properties of the EMG signals provided quantitative measurements of the influence that stimulation parameters exert on the responses they evoke. Figure 2-1c depicts basic examples of the EMG response variations that occurred for different stimulation signals.
2.2 Stimulation signals
Historically, two basic types of stimulation signal have been proven to stimulate the brain in a safe and efficacious manner (Hill, 1936; Lilly, 1961; Lilly, Hughes, Alvord, & Galkin, 1955; Merrill, Bikson, & Jefferys, 2005). These signals are all variations of the square pulse waveform and are depicted in Figure 2-2. The biphasic waveforms depicted in parts (a) and (b) are the most commonly used in clinical and therapeutic applications of intracortical microstimulation because they employ charge balancing to avoid damaging the tissues. The monophasic waveforms depicted in parts (c) and (d) are more prevalently used in research applications (particularly terminal acute experiments) in which tissue damage is not a primary concern since these signals are more effective at evoking responses (Merrill et al., 2005). The parameters of interest in these signals include pulse polarity (anodic, cathodic, anode-leading, cathode-leading), amplitude, frequency, duration and train duration, as well as the duration of the delay between pulses of opposite phases (interphase interval) in the case of biphasic stimulation.
Figure 2-1: Experimental design: rat motor cortex circuitry, system inputs and outputs. Part (a) depicts the experimental paradigm in which stimulation is applied to the forelimb region of the motor cortex producing muscle contractions from which the EMG responses are recorded. Part (b) details the transmission of the electrical stimulus from the cortex to the forelimb. Part (c) shows the variability in EMG responses that occur when the stimulation parameters are varied by
(i), increasing the pulse duration (ii), increasing the amplitude (iii) increasing the train duration, or (iv) reducing the frequency of the stimulus.
Figure 2-2: Common stimulation signals. The four most common types of stimulation signals are depicted in parts (a)-(d) and their respective parameters are displayed. These signals can be employed with either current or voltage control.
2.2.1 Current vs. voltage controlled waveforms
The choice between current-controlled and voltage-controlled stimulation has long plagued microstimulation experiments and continues to be an issue in prosthetic devices currently undergoing clinical trials such as the retinal and deep brain stimulation (DBS) prosthetics. Current controlled stimulation is more commonly used in microstimulation experiments since it is less sensitive to variations in impedance and allows for greater control over the number of neurons activated. However it also produces long discharge transients after each pulse which exacerbates stimulus artifacts (Gerdle, Karlsson, Day, & Djupsjobacka, 1999). These artifacts prevent recording from the tissues surrounding the stimulating electrode, and most likely produce interference between electrodes in the case of multi-electrode stimulation. Provided that our goal is to optimize the stimulation signal, the issue of stimulation artifacts may not be crucial;
however the artifact implies some degree of abnormal neuronal activation. Current clinical trials in DBS have failed to find any appreciable difference between the two modes of stimulation (Del Rio-Oliva et al., 2012) although some believe current-controlled stimulation minimizes the effects of impedance changes (Lempka, Johnson, Miocinovic, Vitek, & McIntyre, 2010). A study conducted in dissociated cultures found cathode-leading biphasic voltage controlled pulses to be the most effective stimuli (Wagenaar, Pine, & Potter, 2004), however the applicability of these findings to in-vivo experiments remains uncertain. A number of modeling studies have recently been conducted to evaluate the performance differences between the two types of stimulation (Savage & Halpern, 2011; Stecker, 2004) however this remains an unresolved issue. In order to avoid sensitivity to the impedance variations which occur during repetitive stimulation and to ensure highly localized activation I chose to use current controlled waveforms.
2.2.2 Pulse polarity
Cathodal pulses have significantly lower thresholds for nerve excitation (Reilly, 2011b). They have been shown to be more effective than anodal pulses for producing phosphenes with microstimulation (Ranck, 1975; Schmidt et al., 1996), and are more effective for evoking forelimb movements in the rat (Nudo, Jenkins, & Merzenich, 1990). When negative current is injected into the tissue, the negative internal charge of the neuronal cell becomes positive in relation to its surroundings. This shift in membrane potential, known as depolarization, induces action potentials and allows for signal transmission. Anodal pulses are thought to be more effective for delivering surface stimulation (Ranck, 1975), despite inconclusive results (Dobelle & Mladejovsky, 1974). When positive current is injected into the tissue, the negative internal charge of the neuronal cell becomes more negative in relation to its surroundings. This shift in membrane potential, known as hyperpolarization, inhibits action potentials. Cathodal pulses however are known to produce a larger volume of exited tissue which is not always desirable (Reilly, 2011b). For the purposes of this study cathodal or cathode-leading signals were chosen due to their greater ability to evoke neural excitation at cortical depths.
2.2.3 Monophasic vs. biphasic waveforms
Monophasic stimulation (stimulation of only one pulse polarity) has been shown to produce a charge buildup at the electrode/tissue interface leading to electrode corrosion, tissue damage and
eventually cortical lesions (Hanson, Fitzsimmons, & O’Doherty, 2008; Merrill et al., 2005). These effects can be avoided by using biphasic stimulation to prevent electrode polarization through charge balancing in order to avoid electrochemical reactions (Reilly, 2011a; Tehovnik, Slocum, Carvey, & Schiller, 2005). While the alternating polarity of the biphasic signal does avoid tissue and electrode damage it also impairs tissue excitation making stimulation less effective and tends to activate a greater volume of tissue (Kombos et al., 1999; Reilly, 2011a). Reduced excitation and larger current spread are both undesirable properties of biphasic stimulation; however these effects are preferable to the induction of tissue damage which occurs in the monophasic case. The most effective biphasic waveforms tend to use a cathodal pulse to evoke the desired excitation followed by an anodal pulse designed to reverse any Faradic processes occurring at the electrode tip by providing and equal and opposite charge (Lilly et al., 1955; Merrill et al., 2005). Leading with the more efficacious cathodal pulse helps to achieve the desired activation with lower amplitudes of stimulation, and the anodal counterpart serves to implement charge reversal. As our study was designed to explore the effects of stimulation parameters commonly used in clinical and therapeutic applications which require the use of biphasic waveforms to avoid tissue damage, the cathode-leading biphasic square waveform was chosen.
2.2.4 Alternative waveforms
Several studies have been conducted that explore modifications to the biphasic square waveform structure. The chopped pulse is a biphasic waveform which splits each phase into a series of smaller pulses. This waveform was previously investigated for stimulation of the auditory nerve (Shepherd & Javel, 1999) revealing much lower thresholds for chopped waveforms than their biphasic equivalents. Similarly, the triphasic pulse waveform is designed to have an extra phase which serves to produce an overall charge balance while reducing the negative effect of phase reversal. This approach has been examined for stimulation of the auditory nerve within a cochlear implant system (Bahmer & Baumann, 2012; Bahmer, Peter, & Baumann, 2010; Schoesser, H., Zierhofer, C., & Hochmair, E.S., 2001; Shepherd & Javel, 1999) and this configuration was shown to effectively reduce the stimulus artifact typically generated after electrical stimulation with a biphasic waveform. Asymmetric pulse waveforms maintain the biphasic shape while varying the duration and amplitude of each phase. The principal of operation is similar to the
triphasic in that the overall charge balance is maintained while mitigating the effect of phase reversal. Neural stimulation models (McIntyre & Grill, 2000, 2002), and cochlear implant research (Macherey, van Wieringen, Carlyon, Deeks, & Wouters, 2006; van Wieringen, Macherey, Carlyon, Deeks, & Wouters, 2008) have shown that asymmetric waveforms might serve to lower detection threshold levels. The effect of waveform asymmetry has also been explored in auditory cortex by varying the lead phase direction, level of asymmetry and phase duration while maintaining charge balance (Koivuniemi & Otto, 2011). Cathode phase duration was found to be the most important factor in predicting threshold level, and phase asymmetry did not have a significant effect.
Several alternatives to the standard square waveform have been suggested in the literature but have not yet been thoroughly explored. These include triangular, sinusoidal, exponential, and energy efficient waveforms. A computer model of both intracellular and extracellular stimulation was developed to evaluate different types of waveforms for use in deep brain stimulation (Foutz & McIntyre, 2010). They compared a range of charge balanced biphasic waveforms with rectangular, exponential, triangular, Gaussian and sinusoidal stimulus pulse shapes and discovered that in some cases the triangular pulse decreases energy consumption, and pointed to the necessity of optimizing non-rectangular pulses. A similar study (Wongsarnpigoon & Grill, 2010) used a genetic algorithm coupled to a computational model of extracellular stimulation of a mammalian myelinated axon to determine the energy-optimal waveform shape for neural stimulation. With no constraints, the algorithm produced waveforms resembling truncated Gaussian curves. When evaluating the best shape of a monophasic cathodic waveform the algorithm suggested waves that were symmetric. When considering rectangular charge-balanced biphasic pulses, the order of occurrence of the pulses (cathode first/anode first) and sharpness of the cathodic peak varied according to the duration and timing of the anodic phase. While these alternative stimulation waveforms are valid and deserve further study, they are not suitable to the present study whose goals are to explore the general parameter effects of commonly used stimulation signals.
2.2.5 Signal selected for present study
Since very little work has been conducted to define the input-output relationships between stimulus parameters and the responses they evoke it was important to keep the complexity of the
signal to a minimum. For the purposes of this study the parameters of the cathode-leading, constant-current, symmetric biphasic square pulse waveform were examined. This signal is the most commonly used waveform in therapeutic and clinical applications and it is effective in the rat motor cortex system as well. The choice of current control avoids impedance variation sensitivity and ensures highly localized activation at the electrode site. The biphasic structure avoids tissue damage through charge balancing as is required for clinical applications, while the cathode-leading design ensures adequate activation and serves to lower the threshold levels.
2.3 Technical considerations of stimulus design
This section details a number of issues related to stimulation of the cortex which deserve special consideration during the process of stimulus design. These issues include: stimulation induced tissue damage, electrode interactions, electrode configuration and current spread. The various parameters which influence these factors are described.
2.3.1 Stimulation induced tissue damage
For a stimulation device to function properly we must preserve the integrity of the interfacing surfaces. The electrode and its surrounding cortical tissue can be damaged by the reactions that occur at the electrode-electrolyte interface. The saline environment of the brain has a corrosive effect on the electrode surface and the stimulation current can subject the electrode to further degradation through oxidation (Crist & Lebedev, 2008; McCarthy, Otto, & Rao, 2011). These processes can increase the concentration of ions in the surrounding tissue which can be toxic to the tissue or affect the functional properties of the electrode in addition to shortening its lifespan (Neuman, 1998). These reactions can exacerbate the immune response and promote the formation of a glial scar encapsulating the electrode (Polikov, Tresco, & Reichert, 2005). As such, we seek to use non-reactive materials such as noble metals, stainless steel, silicon and polymers as electrode materials to minimize these reactions and employ biocompatible/neurotrophic coatings (Crist & Lebedev, 2008; Hanson et al., 2008). Bio-coatings and insulation in general serve to reduce the immune response and avoid encapsulation.
A change of material is not always sufficient to avoid reactions that can lead to tissue damage. At the electrode tip, high current density can result in electrolysis which produces hydrogen or oxygen gas in the tissue environment inflicting damage by altering the pH (Neuman, 1998;
Tehovnik et al., 2005). Sharp tips easily puncture the cortex and reduce cortical depression during insertion (Hanson et al., 2008), however they reduce surface area at the tip. Reducing tip area reduces the amount of current needed to activate the tissue but also increases the current density at the tip which can lead to tissue damage. However, current density at the electrode tip is responsible for the activation of the neural elements we seek to stimulate and unexcitable neurons require fairly high densities for activation (Tehovnik et al., 2005), thus the effects of current density cannot be mediated by material and shape selection alone.
Stimulation parameters heavily influence the effectiveness and longevity of an implanted electrode. The current threshold for detectable nerve damage was determined to depend on a number of stimulus factors Continuous stimulation of peroneal nerves in cats using 400 µA pulses delivered at 50 Hz caused irreversible neural damage after 48 hours of stimulation. The endoneurial edema resulting from the stimulation progressed to early axonal degeneration 1 week after stimulation. Neural damage could however be mitigated by reducing the duration of stimulation, the frequency of stimulation or using an intermittent duty cycle (Agnew, McCreery, Yuen, & Bullara, 1989).
The threshold for neural injury was determined to result from the combined effects of charge density and charge per phase and work done in the cat parietal cortex determined these parameters interact over the range of 10 to 800 µC/cm2 and 0.05 to 5.0 µC respectively (McCreery, Agnew, Yuen, & Bullara, 1990). The threshold for nerve damage in the sciatic nerve of cats was found to be higher for stimuli with short pulse durations (50 µs) and interphase intervals (0 ms), than those with longer pulse durations (100 µs) and interphase intervals (400 µs) (McCreery, Agnew, Yuen, & Bullara, 1992). Further studies in the cat sciatic nerve demonstrated when stimulus frequency is raised from 50 Hz to 100 Hz, the relationship between early axonal degeneration and stimulus amplitude is exaggerated, and the threshold at which degeneration occurs is reduced. At low frequencies (20 Hz) there was no relationship between axonal degeneration which suggests that low frequencies may not induce damage even at high amplitudes (McCreery, Agnew, Yuen, & Bullara, 1995).
Additionally, the length of stimulation time must be considered. Levels which do not produce damage in a single trial can begin to have effects with repeated stimulation at the same site. Despite careful design, parameters commonly used in neurophysiology and neuroprosthetics
research can still cause histological damage after many hours of stimulation, and can lead to cell death in as little as 250 trials of a stimulation experiment (Murasugi et al., 1993). If an implanted array is to survive the environment of the brain and effectively stimulate the tissue, both the physical electrode and stimulation it delivers must be designed in such a way as to reduce or avoid all sources of tissue damage.
2.3.2 Electrode interactions
Electrodes for cortical implants are typically arranged in an array format with equal spacing between electrodes. Standard commercially available devices can contain up to 96 electrodes with standard lengths varying from 0.5-1.5 mm and a standard electrode spacing of 400 µm (Rousche & Normann, 1999). Many applications require highly localized activation focused around the electrode site and spread of the stimulation signal is undesirable. In the case of visual prosthetic devices, each electrode is responsible for eliciting one phosphene, and separations greater than 0.5 mm evoke separate phosphenes when stimulating area V1 with currents less than 30 µA (Schmidt et al., 1996). Stimulation must be designed to ensure a phosphene is separate and distinct from those produced at neighbouring electrodes at close separations. The intention is to activate the neurons in a small area of cortex, particularly the dimensions of the V1 hypercolumn (1 mm x 0.7 mm) which is thought to be the functional unit of phosphene induction (Tehovnik & Slocum, 2007). If the stimulation is stronger than dictated by electrode spacing and hypercolumn width, it will produce phosphenes which overlap causing the percepts to blend into one larger representation. In the case of motor cortex stimulation to evoke movements, if the stimulus signal causes significant spread of activation it can induce movements in multiple muscle groups, particularly if the signal spreads across the borders in the somatotopic representation. Stimulation signals can be designed to activate single muscles with highly localized stimulation (single forelimb muscle), groups of muscles with larger spreading activation (multiple forelimb muscles), and unrelated muscle groups if the stimulus spreads across representations (for example, simultaneous forelimb and whisker movements).
2.3.3 Electrode configuration
The spread of activation can also be controlled by the configuration of the electrodes delivering stimulation. Standard neural stimulation equipment employs monopolar or bipolar electrode
arrangements. The monopolar arrangement uses a stimulating electrode (of either polarity) and a distant reference electrode, whereas the bipolar configuration consists of two electrodes in close proximity of opposite polarity in an attempt to restrict the electric field produced by stimulation (Dokos, Suaning, & Lovell, 2005; Joarder, Dokos, Suaning, & Lovell, 2007). The arrangement focuses the electric field between the electrodes to limit the spatial extent of the activation; however the area of activation is effectively increased since the neurons contacting the return electrode are also stimulated (Lovell, Dokos, Cloherty, Preston, & Suaning, 2005). Auditory physiologists have found the field of activation around the electrode to be more focused going from monopolar to bipolar to tripolar stimulation (Bierer & Middlebrooks, 2002, 2004; Kral, Hartmann, Mortazavi, & Klinke, 1998; Snyder, Bierer, & Middlebrooks, 2004) however the lowest current threshold for neural excitation occurs with monopolar stimulation (Tehovnik & Slocum, 2007).
Recent literature has proposed alternative electrode configurations. The hexpolar configuration surrounds the stimulating electrode with six “guard” electrodes arranged in a hexagonal shape which act as a combined return and localize the tissue activation by “guarding” the spread of current (Habib, Cameron, Suaning, Lovell, & Morley, 2012). The same lab has developed a quasi-monopolar stimulation strategy using this configuration to activate the hex-guard electrodes and the monopolar electrode simultaneously which serves to lower the activation threshold (Matteucci et al., 2012). They have also modeled the response of a retinal ganglion cell to stimulation in this configuration (Abramian, Lovell, Morley, Suaning, & Dokos, 2012). This configuration and its associated stimulation strategies deserve further investigation but will not be addressed here.
2.3.4 Current spread
Confining microstimulation to a specific region helps to focus its effects and limits disruptions to nearby cortical circuitry. When areas outside the region of interest are activated, the effect of the stimulation can be reduced or altered in an often unpredictable manner. Extensive study in motor cortex has led to an equation to describe the relationship between the current required to activate a neuron (I) and the distance (r) between the neuron and the electrode: I=Kr2 , where K is a constant (Ranck, 1975; Stoney, Thompson, & Asanuma, 1968). This relationship can be used to predict the area activated by a specific current level, and suggests that confining activity to one
hypercolumn requires current amplitudes less than 100 µA (Hubel & Wiesel, 1977; LeVay, Connolly, Houde, & Van Essen, 1985).
Neurophysiology experiments frequently design a microstimulation stimulus to match a visual stimulus. For example, the electrical stimulus equivalent of a random dot patch visual stimulus is the activation of a middle temporal area (MT) neuron whose preferred direction matches the direction of visual motion (Salzman et al., 1992). The parameters of stimulation are designed so that the behavioral response obtained with the electrical stimulation matches the behavioral response obtained with the visual stimulation. Despite this careful design, neurorecording experiments have shown that the activity produced by microstimulation is very different from that produced by an equivalent visual stimulus (Masse & Cook, 2009). The behavioural results of these experiments have revealed that microstimulation effects are longer lasting with the ability to affect perception for several hundred milliseconds after it stops.
Multiple fMRI studies have shown the calculation of current spread to underestimate the volume of activated tissue for both visual and electrical stimulation; however the discrepancy is much greater for electrical stimulation (Logothetis et al., 2010; Sultan, Augath, & Logothetis, 2007; Tolias et al., 2005). The difference between the calculated and experimental values may be due to the difference in stimulation parameters used defining each, which further emphasizes the need for a common methodology. However, the discrepancy between visual and electrical stimulation is thought to be partially due to the spatiotemporal properties of the stimulus.
The greater variability consistent with visual stimuli is thought to result in asynchronous neural activation, whereas the uniformity of electrical stimulation leads to neural synchrony capable of producing larger responses (Sultan et al., 2007). Current spread may be in part due to the synchrony of activation provided by stimulation, however it is also likely to result from the interconnectivity of cortical tissue which allows for transynaptic activation of neurons nearby those directly stimulated (Tolias et al., 2005). Effective stimulation parameters are necessary to limit these effects and control both the spatial and temporal interference microstimulation imposes on the natural function of cortical circuitry.
2.4 Known effects of intracortical microstimulation parameters
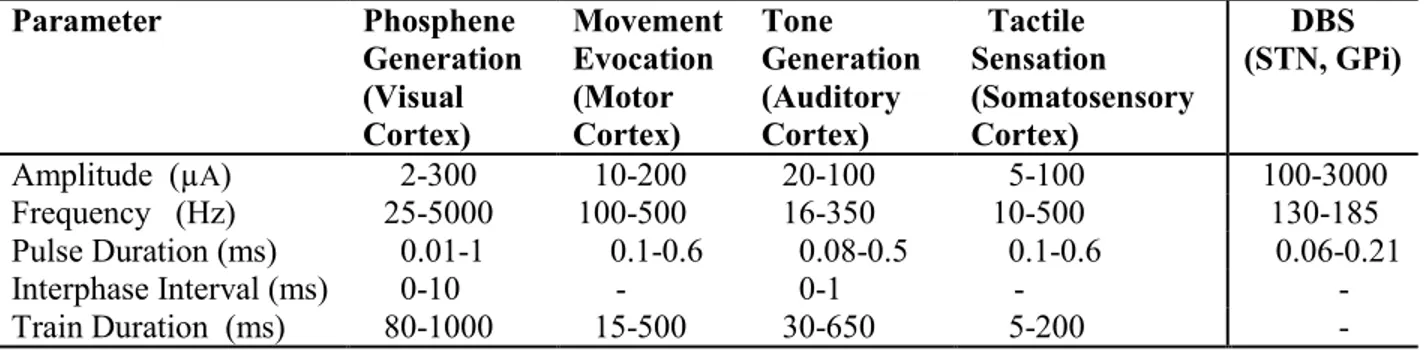
This section details the known effects of intracortical microstimulation parameters documented in past studies in order to gain insight on the general effects of stimulus parameters. To our knowledge, no studies exist which have systematically explored the general effects of stimulation parameters on the responses they evoke; however some efforts have been made to optimize the parameters of stimulation signals for their specific purposes. In the absence of systematic studies, it becomes necessary to review stimulation experiments designed for a variety of different species, systems and applications in order to gain insight pertaining to parameter effects. This review focuses on intracortical microstimulation (ICMS) experiments which use a small electrode (microelectrode) for stimulation of visual, auditory, somatosensory and motor cortical areas. The most commonly used signal is the constant-current, biphasic square waveform. The findings are discussed in terms of the parameters of this signal which include the pulse amplitude, frequency, and duration as well as the interphase interval and train duration. This section concludes with a table (Table 2-1) summarizing the ranges of stimulus parameters used in different regions of the brain for various applications.2.4.1 Visual cortex
Very few studies have been conducted using intracortical microstimulation of the visual cortex in human subjects. During a brief experiment performed while three awake human subjects were undergoing surgery, the ICMS thresholds for phosphene induction were tested (Bak et al., 1990). Due to time constraints of the surgery, parameters were not examined systematically and these results pertain to a mixture of cathode-leading and anode-leading stimulations. Stimulation was delivered as a constant current, capacitor-coupled waveform of biphasic pulses with 0.2 ms phase duration, delivered at 100 pulses/second, for duration of 1s. Phosphene threshold current amplitudes ranged between 35-300 µA and phosphenes tended to become brighter and smaller as current amplitude increased.
In one of the only long-term studies conducted in the visual cortex of a human subject, 38 microelectrodes were implanted near the pole of the right occipital cortex of a blind woman with no light perception (Schmidt et al., 1996). Visually robust phosphenes were produced using cathodic-first, constant current, biphasic pulses of 200 µs duration delivered at 200 Hz for a total
duration of 125 ms. In accordance with the subject’s feedback on the quality of the phosphene, these parameters were adjusted to 500 µs duration pulses delivered at 150 Hz for a total duration of 250 ms. Amplitude: Of the 38 electrodes, 25 had thresholds <25 µA (lowest was 1.9 µA) while the other electrodes didn’t respond to currents up to 30 µA. Nine of these electrodes had a threshold of 40-77 µA with anode first stimulation. Increasing the current amplitude had mixed effects on size as it could produce no changes, an increase, a decrease or first increase then decreased in size. Current amplitude also affected phosphene colour. Near threshold stimulation typically produced coloured phosphenes, whereas phosphenes at amplitudes >12.5 µA were typically white, yellowish, or grayish. Frequency: Increasing the pulse frequency reduced the reaction time for both phosphene onset and offset which plateaued at 150 Hz and 250 Hz respectively. Increases in frequency were also found to increase phosphene brightness. Threshold currents were constant for frequencies between 150-200 Hz however increased by half when frequency was lowered to 75 Hz. Pulse Duration: Increasing pulse duration from 200 to 800 µs reduced the threshold from 19.4 µA to 11.7 µA and produced more substantial phosphenes. Increases in pulse duration were found to increase phosphene brightness. Interpulse Interval: Long interpulse intervals with short pulse durations reduced thresholds, and increasing the interval from 0 to 100 µs decreased the threshold by 5.4%. Train Duration: The thresholds for 250 ms duration trains were 20% lower than those of 125 ms trains, and longer durations produced more easily recognizable phosphenes. Longer train durations produced brighter phosphenes and increasing the train duration from 200-500 ms increased phosphene size. Multiple trains produced separate phosphenes if separated by more than 25 ms. Train durations longer than 250 ms produced an elongated sense of phosphene duration, whereas trains longer than 1000 ms caused the phosphene to extinguish before the stimulation ended.
More extensive work has been conducted in the visual cortex of non-human primates using ICMS threshold detection experiments. In these studies the monkeys indicate the detection of visual percepts in a lever-press task (Bartlett et al., 2005). The stimulus waveform consisted of constant-current, monophasic, cathodal pulses with durations of 0.2 ms delivered at a frequency of 100 Hz in 1s trains. Amplitude: The average current threshold for detection ranged from 35-149 µA suggesting large variability among sites. Frequency: Fast reaction times were observed for 50-100 Hz stimuli whereas reaction times for 1-10 Hz signals were slow. The detection threshold was found to decrease as frequency increased and these effects were more pronounced in the
range of 10-20 Hz. Pulse Duration: Detection threshold was found to decrease as pulse duration increases with the chronaxie (shortest duration of effective stimulation) determined to be 247 µs. In a similar study, monkeys were trained to perform a 2 choice direction discrimination task in response to stimulation of area MT (Murasugi et al., 1993; Salzman et al., 1990, 1992). The stimulation targeted neurons whose preferred direction was opposite to that of a presented visual motion stimulus with the goal of biasing the monkey’s choice of direction. The stimulus waveform consisted of biphasic, cathodal-leading, pulses of 0.2 ms duration with a 0.1 ms interphase interval between the cathodal and anodal pulses. Amplitude: While testing the effects of amplitude, the frequency was fixed at 200 Hz and the current values tested were 0, 5,10,20,40 and 80 µA with the threshold identified as 5 µA. The ability to bias behavior improved as current amplitude increased up to 40 µA with large effects seen at 20 and 40 µA. At 80 µA, the monkey could no longer determine the direction of motion. The authors described these effects by stating that lower intensity stimulation added “signal” to the cortex, while higher intensities added “noise”. This noise was thought to be caused by the activation of many columns encoding different directions. Frequency: While testing the effects of frequency, the amplitude was fixed at 10 µA and the frequency values tested were 0, 25, 50, 100, 200, 500 Hz, with the threshold identified at 25 Hz although weak effects were observed at 12.5 Hz. Variations in the frequency had very little effect on performance.
2.4.2 Auditory cortex
To assess the safety of the Utah Array and the stimulation it provides, a 100 electrode array was implanted into the auditory cortex of three cats (Rousche & Normann, 1999). A two-alternative forced choice task was used to indicate the detection of the stimulus and general trends for parameter variations were examined. The standard stimulus used was a cathodic-leading, constant current signal of 100 µA biphasic pulses with a width of 150 µs and an interphase interval of 100 µs. The stimulation lasted 0.6 s and the pulse pairs were delivered at 250 Hz. Charge/phase: With these parameters the charge/phase thresholds varied from 1.5-26 nC/ph. Frequency: Stimulus detection was reduced as stimulus frequency decreased. When the charge/phase was less than 1.5 times the threshold, frequencies ranging from 50-2000 Hz produced nearly 100% detection; however 25 Hz stimuli did not produce the same effect even with stimulation an order of magnitude higher than 1.5 times the threshold. Train Duration: When the charge per phase
was fixed at 1.5 times the threshold, stimulus detection was reduced to 50% for 0.1 s duration stimuli, whereas durations greater than 0.2 s produced nearly 100% detection.
The effects of interpulse interval and frequency on threshold detection have also been examined in the rat auditory cortex (Koivuniemi, Regele, Brenner, & Otto, 2011). The stimulus waveform was a constant current, biphasic square wave with 205 µs pulses delivered at 150 pulses per second with both cathode-leading and anode-leading stimulation. Interphase Interval: Threshold values were found to decrease as the interphase interval increased and anode-leading stimulation had higher thresholds than cathode-leading stimulation for interphase intervals less than 1 ms in duration. Frequency: The detection threshold amplitude decreased logarithmically as frequency increased from 16-84 pulses per second; however this trend plateaued between 84-338 pulses per second.
2.4.3 Somatosensory cortex
The effect of stimulus intensity, frequency and duration on detection thresholds has also been explored in the somatosensory cortex of a head-restrained rat (Butovas & Schwarz, 2007). This study focused on the difference between single and repetitive stimuli. A biphasic cathode-leading, constant current square waveform was used in both single pulse and repetitive stimulation trials. Stimulation Intensity (amplitude x duration): Using single pulses, at intensities as low as 2 nC, detection probability rose above chance levels, and plateaued at ~80% detection at 4 nC. Frequency: Detection threshold levels could be lowered by increasing the stimulus frequency. Pulse Duration: Repetitive pulses were found to decrease the detection threshold even when comparing only 2 pulses to a single pulse. Using just 2 pulses, the stimulation threshold could be significantly reduced by increasing the pulse frequency. This effect was more pronounced for short inter-pulse intervals and for stimulations with 5-15 pulses. Additionally, repetitive stimuli boosted performance levels approaching 100% detection, and 2 pulses were found to perform as well as longer trains of stimuli.
In a similar experiment, the effects of stimulus amplitude, frequency and train duration were examined in the somatosensory cortex of an unrestrained rat (Semprini, Bennicelli, & Vato, 2012). The standard stimulus waveform stimulus was 40 current-controlled, biphasic, cathode-leading square pulses with a duration of 160 µs delivered at 200 Hz with an amplitude of 100 µA.
revealed that the ability to detect stimulation at low amplitudes was at chance levels however performance improved greatly (>70% correctly detected) for amplitudes above 60 µA.
Frequency: Varying the frequency between 10-200 Hz with amplitude fixed at 80 µA revealed
that performance above chance levels was achieved with frequencies as low as 25-50 Hz. After this point performance plateaued at ~70% correct performance. Train Duration: Train duration was varied between 5-200 ms with amplitude fixed at 80 µA, and frequency fixed at 200 Hz. Under these conditions performance was above chance levels when duration was greater than 10 ms after which point performance plateaued at ~70% correct.
2.4.4 Motor cortex
An experiment conducted in the rat and mouse motor cortex examined the effects of frequency and train duration on the threshold for producing forelimb movements (Young, Vuong, Flynn, & Teskey, 2011). The standard stimulation signal consisted of 13 monophasic cathodal pulses of 0.2 ms duration delivered at 333 Hz, with trains repeating every second. Frequency: In rats, the lowest movement thresholds were found to occur for stimulus frequencies of 181-400 Hz and no difference in threshold was observed between 142- 400 Hz frequencies. In mice, no movements could be evoked using stimulus frequencies of 111, 125 and 500 Hz, however, 333 Hz was effective. Train Duration: In rats, movements could be evoked for all train durations longer than 15 ms, and thresholds were not significantly different between durations of 15-60 ms. In mice, movements could be evoked for all train durations longer than 9 ms. Movement thresholds tended to decrease as train duration increased however there were no significant differences between thresholds of 12-39 ms trains.
Table 2-1. List of parameter ranges used in a common brain stimulation applications.
Parameter Phosphene Generation (Visual Cortex) Movement Evocation (Motor Cortex) Tone Generation (Auditory Cortex) Tactile Sensation (Somatosensory Cortex) DBS (STN, GPi) Amplitude (µA) 2-300 10-200 20-100 5-100 100-3000 Frequency (Hz) 25-5000 100-500 16-350 10-500 130-185 Pulse Duration (ms) 0.01-1 0.1-0.6 0.08-0.5 0.1-0.6 0.06-0.21 Interphase Interval (ms) 0-10 - 0-1 - - Train Duration (ms) 80-1000 15-500 30-650 5-200 -