A park typology in the QUALITY cohort: Implications for physical activity
and truncal fat among youth at risk of obesity
Madeleine Bird
a,b,c, Geetanjali D. Datta
a,c, Andraea van Hulst
b,d, Marie-Soleil Cloutier
e,
Mélanie Henderson
b,g, Tracie A. Barnett
b,f,⁎
a
L'École de santé publique de l'Université de Montréal, Département de médecine sociale et préventive, Université de Montréal, Montreal, Quebec, Canada
bResearch Centre of the Sainte-Justine University Hospital, Montreal, Quebec, Canada
cCentre de recherche du Centre hospitalier de l'Université de Montréal (CRCHUM), Montreal, Quebec, Canada d
Department of Epidemiology Biostatistics and Occupational Health, McGill University, Montreal, Quebec, Canada
eInstitut National de la Recherche Scientifique (INRS) — Centre Urbanisation Culture Société, Montreal, Quebec, Canada fInstitut National de la Recherche Scientifique (INRS) — Institut Armand Frappier, Laval, Quebec, Canada
g
Department of Pediatrics, Université de Montréal, Montreal, Quebec, Canada
a b s t r a c t
a r t i c l e i n f o
Article history: Received 4 February 2016
Received in revised form 31 May 2016 Accepted 27 June 2016
Available online 30 June 2016
Background. The operationalization of opportunities for physical activity (PA) in parks has not been studied extensively.
Objectives. To explore associations between park types, PA and adiposity in youth.
Methods. Data were from an ongoing cohort study in children at risk of obesity. Data were collected in 512 participants (2005–2008). Analyses were restricted to 380 participants living within ≥1000 m of ≥1 park (n parks = 576). Park types were identified using principal component and cluster analyses. Linear and logistic re-gressions were used to explore associations between park types, and PA and adiposity. The reference category was children living near smaller-sized parks with no team PA features.
Results. Nine park types were identified. Compared to the reference group, children living near esthetically pleasing parks with few team sports installations reported more 15-minute bouts of PA/week (bouts of PA) (β = 5.2 [90% CI: 2.3; 8.1]) and variety of PA (1.6 [0.1; 3.1]), and had less % truncal fat (−3.4 [−6.4; −0.5]). Chil-dren living near parks that were low on safety items with cycling infrastructure reported more bouts of PA (2.2 [0; 4.3]) and variety of PA (0; 2.2]). Children living near parks with a variety of PA installations reported more bouts of PA (2.5 [0.2; 4.7]) and variety of PA (1.4 [0.2; 2.5]). Children living near parks that had team sports and pool features reported more bouts of PA (2.5 [0.4; 4.7]). No significant associations were found for objective-ly-measured PA.
Conclusion. Parks that emphasize unstructured activities may increase self-reported PA and be associated with less % truncal fat among youth at risk of obesity.
© 2016 The Authors. Published by Elsevier Inc. This is an open access article under the CC BY-NC-ND license (http://creativecommons.org/licenses/by-nc-nd/4.0/). Keywords: Neighborhood/place Obesity Pediatric Physical activity QUALITY cohort 1. Introduction
Childhood overweight and obesity are recognized public health con-cerns (Ng et al., 2014). Their associated health risks have been well doc-umented (Hoey, 2014). Increasing levels of physical activity (PA) among children at risk of obesity may be one important factor in obesity prevention and management (Brown et al., 2015). Currently, only 14% offive to 11 year-old, and 5% of 12 to 17-year old Canadians are meeting the Canadian youth guidelines of 60 min daily of moderate to vigorous PA (MVPA) (ParticipACTION, 2015).
Parks are essential aspects of the built environment that can be opti-mized for health benefits. They provide a widely accessible opportunity for PA, yet little is known about how to operationalize these opportuni-ties or the extent to which they influence PA and adiposity outcomes among youth at risk of obesity. Some park characteristics have been as-sociated with PA among a general youth population including play-grounds (Potwarka et al., 2008; Besenyi et al., 2013; Rung et al., 2011; Cohen et al., 2006), basketball courts (Rung et al., 2011; Cohen et al., 2006; Floyd et al., 2011), trails (Kaczynski et al., 2008; Shores and
West, 2008), and walking paths and running tracks among girls
(Cohen et al., 2006). One study in children using accelerometers and geographic positioning systems (GPS) found that although park use was low overall, children were more likely to use parks with a high density of green vegetation (Dunton et al., 2014). Although the presence of parks has been correlated with a lower risk of obesity among youth
⁎ Corresponding author at: INRS—Institut Armand Frappier, 531 boul. des Prairies, Laval, Québec H7V 1B7, poste 4384, Canada.
E-mail address:[email protected](T.A. Barnett).
http://dx.doi.org/10.1016/j.ypmed.2016.06.042
0091-7435/© 2016 The Authors. Published by Elsevier Inc. This is an open access article under the CC BY-NC-ND license (http://creativecommons.org/licenses/by-nc-nd/4.0/).
Contents lists available atScienceDirect
Preventive Medicine
(van Hulst et al., 2015; Nesbit et al., 2014), recent literature reviews have found inconsistentfindings in the overall relationship between parks, obesity and PA (Casey et al., 2014; Ding and Gebel, 2012). This discrepancy may be because the majority of studies only assess the presence or absence of parks without considering specific park types, features and amenities.
There remains much to learn about how parks differ and which types of parks are most likely to promote PA among youth. An illustra-tion of the installaillustra-tions and amenities that are likely to promote PA and help reduce adiposity among youth may help guide investments in park design. The aims of this study are to 1) distinguish park types in a Canadian city according to their salient features identified in com-prehensive in situ audits and 2) explore whether distinct parks types are associated with PA and adiposity outcomes among children living nearby.
2. Methods 2.1. Study design 2.1.1. Participants
Data collected during the baseline assessment of the Quebec Adipose and Lifestyle Investigation in Youth (QUALITY) Cohort Study (Lambert et al., 2011) were used. Youth were considered to be at high risk for obesity because one or both biological parents were obese, a prerequisite to participate in the QUAL-ITY study. A detailed description of the study design and methods is available elsewhere (details can be found inLambert et al., 2011). Briefly, families were recruited using a school-based recruitment strategy. Among those eligible, 630 families (one child, aged 8–10 years, and both biological parents) complet-ed baseline data collection (September 2005–December 2008), including a clin-ic visit during whclin-ich questionnaires were completed and biologclin-ical and physiological measurements taken. Written informed consent was obtained from the parents, and assent was provided by the children. The Ethics Review Boards of CHU Sainte-Justine and Laval University approved the study. A de-tailed audit of the parks around the homes (n = 512) of the participants located in the Montreal Census Metropolitan Area (MCMA) was conducted.
2.1.2. Park identification and audits
Park identification was conducted using a two-stage process. First, land use information from CanMap (Digital Mapping Technologies, Inc., 2007) were inte-grated in a geographic information system to extract‘parks and open spaces’ polygons. The three closest parks within a 500 m walking network buffer around the exact addresses of the participants were identified. Second, addi-tional parks were identified on-site using a ‘seek and assess’ procedure when observers walked all the street segments in the 500 m buffer zone. If no parks were found within 500 m, the walking buffer was increased to 1000 m, with the closest park being included in the sample. When observers found a park not in the CanMap dataset, they would draw its spatial boundaries on the map provided. A detailed description of the park identification process can be found in Bird et al. (Bird et al., 2015).
All parks were evaluated by two of 9 trained independent observer pairs, using the Parks, Activity and Recreation Among Kids (PARK) Tool, a 92-item di-rect observation park evaluation tool (Bird et al., 2015). The observers walked through the entire park to make sure they did not miss any sports installations or other park amenities. The PARK tool has demonstrated reliability and was de-veloped specifically for youth PA in parks (Bird et al., 2015). An extensive ob-server training (detailed inBird et al., 2015) was conducted to try to achieve high inter-rater reliability. Inter-rater reliability was generally high, with 86% of items across all parks having good to excellent overall agreement (≥75% agreement). Observers assessed a total of 576 unique parks, 345 of which were pre-identified using CanMap and 231 of which were identified on site dur-ing mild weather between the hours of 8:00 and 17:00 in 2008 (76%), 2009 (21%), and 2010 (3%), from June to December inclusively.
2.2. Measures
2.2.1. Self-reported physical activity
Child participants responded to a questionnaire on PA administered by a trained interviewer instructed to query participants about the physical activities they did over the past week for at least 15 min outside regular gym class. The response scale was yes or no for each of 28 different activities, for every day of
the week, and included a,“Not in the last week” response option. The 3-day test-retest reliability of the original instrument was 0.74 (Sallis et al., 1993) and, in a different sample of adolescents, this version of the PA recall showed ev-idence of convergent validity with energy intake (Johnson-Down et al., 1997). Two subsequent recalls were conducted by phone with the participants during different seasons. The three recalls were averaged to create two variables: 1) mean sum of self-reported 15-min bouts of PA over one week (hereinafter re-ferred to as bouts of PA), and 2) mean variety of different self-reported PA (i.e. the average number of different types of physical activities practiced and report-ed by the child over the three recalls).
2.2.2. Objective physical activity
Objective PA was measured using a calibrated accelerometer (Actigraph, model 7184, Pensacola, Florida, USA)fitted to the child during the clinic visit and instructed to be worn for the following 7 consecutive days. Only data of chil-dren with a minimum of 4 days with≥10 h of wear time were retained, based on established guidelines (Colley et al., 2011). The accelerometer data were partitioned into six variables based on established cut-offs of counts-per-minute (Evenson et al., 2008): mean sedentary PA, mean light PA, mean vigorous PA, mean MVPA, and a dichotomized variable of meets the current guidelines of 60 min of daily MVPA or not.
2.2.3. Body composition
Total lean mass, total fat mass and central fat mass were measured in grams during a clinic visit using Dual Energy X-ray Absorptiometry (DXA). We defined child's truncal fat as the percentage of central-to-total body fat. It was calculated as ((central fat mass in grams) / (total fat mass in grams))∗ 100.
2.2.4. Anthropometric measurements
Weight, height and waist circumference were measured according to stan-dard protocols (Lambert et al., 2011). BMI was analyzed using two cut-off points: 1)≥85th percentile for overweight and obese versus not, and 2) ≥95th percentile versus not for obese children versus all others using the CDC refer-ence curves (Centers for Disease Control and Prevention. Recommended BMI-for-age Cutoffs Atlanta, 2014).
2.2.5. Control variables
Child's age was analyzed as a continuous variable. The child's sexual matu-rity (Tanner stage) was evaluated by a trained nurse using Tanner stages (Marshall and Tanner, 1969; Marshall and Tanner, 1970). Puberty was consid-ered either initiated (Tanner stageN 1) or not (Tanner stage = 1). Household in-come was self-reported by the participating child's biological parents on a 12-point response scale ranging fromb $10,000 to ≥ $140,000. Household income was dichotomized asb $80,000 or ≥ $80,000.
2.3. Analyses 2.3.1. Park typology
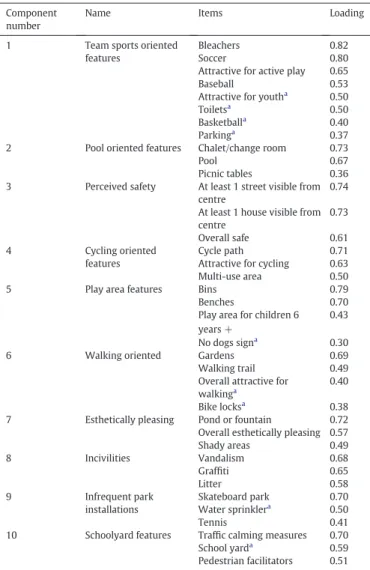
The park typology (PT) was identified using a two-step approach. First, 41 variables from the park audit tool were selected using two criteria: variables with frequencies of≥5%, and those that applied to the entire park. A principal component analysis (PCA) was performed using a varimax rotation and princi-pal components extraction. A ten-factor solution was retained based on eigen-values≥0.95, for exploratory purposes. The minimum eigenvalue retained was 0.99. Internal consistency of factors was examined. Variables (37/41) were retained if they loaded onto a factor at 0.3 or higher; at this point, 9% of the variance in the variable is explained by the factor, a proportion generally agreed to be the lowest limit for which a component loading should be consid-ered for inclusion (Tabachnick and Fidell, 2007) (seeTable 1).
The second step applied a hierarchical cluster analysis using Ward's mini-mum-variance to the components created in step 1, with the addition of park area (in m2), in order to identify distinct park types. Hierarchical cluster analysis begins with each multidimensional observation (park) as a single cluster and then repeatedly merges the next two closest until a single cluster encompassing all the data remains (Tan et al., 2005; van Hulst et al., 2012). This method results in a typology wherein substantively comparable parks are grouped together in-dependent of geographical location (van Hulst et al., 2012). We examined re-sults for N = 6 to N = 9 clusters, attempting to identify substantively distinct park types based on the dendogram, pseudo F, pseudo t2and the cubic cluster-ing criterion plots.
2.3.2. Regression models
We performed linear and logistic regression in order to explore associations between the park types and PA and adiposity measures. Confidence intervals are reported at 90% in line with recent recommendations made in the context of critiques of significance testing (Sterne and Smith, 2001), and due to the ex-ploratory nature of the study. The reference category was children living near park type I, i.e., parks that are characterized by being smaller in size, with no team sports features and no play area features for children ages 6 years and over. Each of the other park types was entered into the model as an indicator variable. As the study is exploratory, we chose not to adjust for multiple testing (Bender and Lange, 2001). SAS version 9.4, SAS Institute Inc., Cary, NC, USA, was used for all analyses. Analyses are restricted to participants living in the MCMA with at least one park within 1000 m of their home and with complete data (data were missing for less than 1% of the sample).
3. Results
3.1. Principal components
Principal component analysis was performed on 570 parks. The PCA created ten components (seeTable 1) that were easily interpretable based on variable loadings. For example, the three incivilities items from the PARK tool–vandalism, graffiti and litter – loaded highly and uniquely onto one component.
3.2. Cluster analysis
Results are for a 9-cluster solution, representing 39.4% of the total variance in the components. Each park type is summarized according to its dominant characteristics and listed inTable 2.
Table 3shows a matrix of the principal components and park types, categorizing each principal component as high, low, or non-distinguishing for each park type. For example, park type IV (n = 122) is high on team sports related installations, while park type V (n = 56), is low on team sports and perceived safety features, and high on cy-cling infrastructure. Notably, park type V also comprised the second largest parks in the dataset. Because the items designed to assess safety (visibility of surrounding houses from centre of park, visibility of streets from centre of park and lighting throughout the park) are necessarily in-fluenced by the expanse of the park, these parks may not be unsafe, but simply larger than the others.
3.3. Regression analyses
There were 217 (57%), 133 (35%), and 30 (8%) participants with 1, 2, and 3 parks within the maximum 1000 m walking network buffer, re-spectively, for a total of 570 observations. There were no participants withN3 parks within equidistance from their residence.Table 4 de-scribes individual, familial, and PA characteristics of the 380 participants included in the study, and compares them to the 124 participants ex-cluded because they did not live within 1000 m of a park. Participants who were excluded from this study were slightly younger (p-value = 0.014), had slightly more minutes of moderate PA per day (p-value = 0.043), and a greater proportion were from higher income households (p-value = 0.012).
Table 5shows the results from the linear regression of the mean sum of bouts of PA, the mean sum of variety of PA and truncal fat. All models were adjusted for household income, sex, age, and puberty initiated. Compared to children living near parks that are small with no team sports features and no play area features for children ages 6 years and over (type I), children living near parks that were very esthetically pleasing with few team sports installations (type VIII) reported 5.2 (90% C·I.: 2.3; 8.1) more bouts of PA, an additional 1.6 (90% C·I: 0.1; 3.1) different types of PA, and had 3.4% (90% C.I.:−6.4; −0.5) less truncal fat. Children living near parks that were low on safety items and high on cycling infrastructure (type V) reported 2.2 (90% C.I.: 0.0; 4.3) more bouts of PA, and 1.1 (90% C.I.: 0.0; 2.2) greater variety of PA. Children living near parks with a variety of PA installations (type VI) re-ported 2.5 (90% C.I.: 0.2; 4.7) more bouts of PA, and 1.4 (90% C.I.: 0.2; 2.5) more variety of PA. Finally, children living near parks that had team sports and pool features (type VII) reported 2.5 (90% C.I.: 0.4; 4.7) more bouts of PA.
Table 1
Interpretation of the principal components, items, and their loadings. Component
number
Name Items Loading
1 Team sports oriented features
Bleachers 0.82 Soccer 0.80 Attractive for active play 0.65 Baseball 0.53 Attractive for youtha
0.50 Toiletsa 0.50 Basketballa 0.40 Parkinga 0.37 2 Pool oriented features Chalet/change room 0.73
Pool 0.67
Picnic tables 0.36 3 Perceived safety At least 1 street visible from
centre
0.74 At least 1 house visible from centre 0.73 Overall safe 0.61 4 Cycling oriented features Cycle path 0.71 Attractive for cycling 0.63 Multi-use area 0.50 5 Play area features Bins 0.79 Benches 0.70 Play area for children 6 years +
0.43 No dogs signa 0.30
6 Walking oriented Gardens 0.69 Walking trail 0.49 Overall attractive for
walkinga
0.40 Bike locksa
0.38 7 Esthetically pleasing Pond or fountain 0.72 Overall esthetically pleasing 0.57 Shady areas 0.49 8 Incivilities Vandalism 0.68 Graffiti 0.65 Litter 0.58 9 Infrequent park installations Skateboard park 0.70 Water sprinklera 0.50 Tennis 0.41 10 Schoolyard features Traffic calming measures 0.70
School yarda
0.59 Pedestrian facilitators 0.51
aDenotes that the item crossloaded at 0.3 or higher onto more than one component.
Table 2
Summary of 9 park types. Park type Mean area (m2 ) N Description
I 18,000 25 No team sports features; no play area II 9000 180 No team sports features; no walking paths III 17,000 64 No team sports features; high on incivilities IV 30,000 122 Many team sports features
V 53,000 56 No team sports features; not safe; cycling infrastructure
VI 43,000 46 Variety of physical activity installations; skate parks; high on incivilities
VII 29,000 58 Many team sports features; pool
VIII 44,000 15 No team sports features; very esthetically pleasing IX 1,300,000 4 No team sports features; cycling infrastructure; very
No statistically significant associations were found for the objective-ly measured PA variables or anthropometric measures (results for these logistic and linear regressions not shown).
4. Discussion
This study developed a park typology, then explored which types were associated with PA and adiposity-related outcomes among a co-hort of youth at risk of obesity. It adds to the literature by using directly observed park measures to identify conceptually distinct park types using a cluster analysis. We found that parks types that provided oppor-tunities for active play were associated with greater self-reported bouts of PA, variety of self-reported PA and less truncal fat.
Previous research used categories from administrative park associa-tions (Cohen et al., 2006) or desktop methods (Taylor et al., 2011) to identify park types. In our study, we were able to capture important
user-oriented aspects (e.g. esthetics) of parks because they were audited directly with a tool designed to capture features potentially as-sociated with youth PA (Bird et al., 2015). In addition, cluster analysis allowed the development of a park typology that identified distinguishing clusters of park features, rather than to partition parks into distinct activity areas for further study, as has been done elsewhere (Rung et al., 2011).
Little has been published on the relation between overall park con-text and PA or adiposity among youth. Among the literature focusing on team sports and park context, ourfindings run contrary to studies demonstrating an increase in PA in parks where there are competitive sports activities (Cohen et al., 2010) and team sports installations (Rung et al., 2011). However, ourfindings concord with studies that found an association between non-team sports oriented features of parks such as playgrounds, trails and‘green’ parks and PA among a pe-diatric population (Potwarka et al., 2008; Dunton et al., 2014). This may be because the overall context of where the PA takes place may be just as important as the kinds of opportunities for PA found in parks for a pe-diatric population at risk of obesity. Weight criticism during PA can be significantly higher for overweight children than normal weight chil-dren (Faith et al., 2002), which can negatively impact the PA behaviors and enjoyment of team sports activities of overweight children. Most team sports provide a context in which teasing may be present. It may be that overweight youth are more comfortable being physically active in areas that provide opportunities for active, unstructured play, rather than through organized activities perceived to be more‘sport’ than ‘play’ (Janssen, 2014). Opportunities for a variety of active play in parks may be important in addition to a small or negligible presence of team sports oriented activities.
This study did notfind any significant associations between park types and directly measured PA. These results are consistent with other studies that report a lower likelihood offinding beneficial associ-ations between the built environment and PA when PA is objectively measured (Oakes et al., 2007; Ferdinand et al., 2012). Several studies have reported a low correlation between self-reported and directly measured PA (Prince et al., 2008), with the present study being no ex-ception (mean bouts of PA correlated with mean counts per minute at r = 0.24 and mean variety of PA correlated with mean counts per min-ute at r = 0.18). Self-reported questionnaires tend to overestimate PA, although among children, PA questionnaires administered by an inter-viewer, as was done here, tend to be more reliable than independent self-report (Sallis and Saelens, 2000). The low correlation may indicate that these variables are measuring different constructs. Self-reported PA is a better measure of the context and type of PA (Sallis and Saelens, 2000), than the intensity and duration of PA captured by accel-erometer. It remains important to attempt to capture lifestyle behaviors among youth, for these may initiate long-lasting trends that are favor-ably influenced by the built environment and that reduce risk of adipos-ity over time.
The majority of studies assessing the built environment and adipos-ity use BMI as a measure of adiposadipos-ity, and we are unaware of any studies assessing the relationship between parks and truncal fat among youth. Surprisingly, ourfindings were not consistent across anthropometric measures. This study did notfind significant associations between BMI and park type. BMI is strongly associated with body fat, however chil-dren and adolescents can have a wide range of body fat % for a given BMI value (Pietrobelli et al., 1998) and variations in BMI in general pe-diatric populations are largely attributed to differences in lean body mass (Freedman and Sherry, 2009). Visceral adipose tissue tends to demonstrate a stronger relationship with cardiometabolic risk factors than total body fat or subcutaneous adipose tissue, and DXA measures of visceral adipose tissue were found to correlate highly with the gold standard measure of single slice computed tomography (Bosch et al., 2015). Access to esthetically pleasing parks may be beneficial in reduc-ing potentially dangerous visceral adipose deposits in youth via an in-crease in PA, however further studies will need to examine these
Table 3
Matrix of components on park type. Principal component label Park type
I II III IV V VI VII VIII IX 1. Team sports features − − − ++ − + + − − 2. Pool features ○ ○ ○ ○ ○ ○ ++ ○ ○ 3. Perceived safety ○ ○ ○ ○ − ○ ○ ○ ○ 4. Cycling infrastructure ○ ○ ○ ○ + ○ ○ ○ ++ 5. 6+ play area features −− ○ ○ ○ ○ ○ ○ ○ ○ 6. Walking features ○ − ○ ○ ○ ○ ○ ○ ○ 7. Esthetically pleasing ○ ○ ○ ○ ○ ○ ○ ++ + 8. Incivilities ○ ○ ++ ○ ○ + ○ ○ ○ 9. Infrequent installations ○ ○ ○ ○ ○ ++ ○ ○ ○ 10. School yard features ○ ○ ○ ○ ○ ○ ○ ○ ○ Park area ○ ○ ○ ○ ○ ○ ○ ○ +++ + indicates the park type is high on the principal component.
− indicates the park type is low on the principal component.
○ indicates the park type is non-distinguishing on the principal component.
Table 4
Comparison of the distribution of individual, familial, and PA characteristics between QUALITY study participants with at least one park and no park at baseline (2005–2008) (n = 570).
Have no parks (n = 124)
Have at least one park (n = 380)
p-Value
Individual characteristics
Age, years, mean (SD) 9.4 (0.96) 9.7 (0.89) 0.014 Sex, % (n) 60.5 (75) 52.4 (199) 0.115 Puberty initiated at baseline, %
(n)
20.2 (25) 25.1 (95) 0.266 Sum of bouts of weekly PA, mean
(SD)
10.7 (4.8) 11.2 (5.4) 0.381 Variety of weekly PA, mean (SD) 5.6 (2.6) 5.8 (2.8) 0.545 Truncal fat, mean %, (SD) 40.9 (5.5) 40.9 (5.4) 0.969 Overweight and obese (BMI
percentile≥85), % (n)
43.6 (54) 41.3 (157) 0.662 Obese (BMI percentile≥95), %(n) 24.2 (30) 22.1 (84) 0.629 Family characteristics
Household income,≥$80,000, % (n)
65.6 (80) 52.7 (199) 0.012
Accelerometer-measured PA Minutes of sedentary activity per
day, mean (SD)
359.7 (76.5) 369.1 (71.2) 0.244 Minutes of light PA per day, mean
(SD)
409.7 (53.8) 403.0 (56.6) 0.282 Minutes of moderate PA per day,
mean (SD)
40.1 (18.5) 36.4 (16.2) 0.043 Minutes of vigorous PA per day,
mean (SD)
15.4 (14.4) 13.5 (11.2) 0.172 Minutes of moderate-to-vigorous
PA per day, mean (SD)
55.5 (29.6) 49.9 (25.2) 0.055 Meeting PA guidelines, % (N) 33.1 (41) 27.2 (103) 0.202 Bold values indicate significance at p ≤ 0.05.
associations more closely to better understand why the relationship holds for some types of adiposity measures and not others. While this study found a statistically significant decrease in truncal fat %, we are unable to assess whether this represents a clinically significant weight loss as there are no established thresholds for what constitutes a clini-cally significant weight loss in children.
This study has both strengths and limitations. Strengths include: highly reliable and direct measures of park characteristics, adiposity, tanner stage, and accelerometer-measured PA, access to an at-risk pop-ulation and a sample that is more overweight and obese than the gener-al population. This study is limited by its cross-sectiongener-al design and it may be affected by issues of endogeneity. It may be that families who are more active choose to live close to certain types of parks versus others. Also, because we did not use GPS on the youth, our study was unable to specifically locate where the PA was taking place. Neverthe-less, the pathways between park type and PA and adiposity outcomes among youth are complex. While we are interested in which types of parks may be associated with PA and adiposity outcomes, we recognize that the presence of certain park types has the potential to influence be-havior both inside and outside of parks. We therefore argue that the endogeneity issue is not critical to ourfindings because it is plausible that some park types increase environmental-level exposure to PA, making it a more normative behavior.
The study population is likely not generalizable to a general pediatric population. Despite this limitation, the study may be generalizable to youth who are overweight or obese, or at risk of being so due to a paren-tal history of obesity. Given that currently 31% of the Canadian school-age population is considered overweight and obese (Statistics Canada, 2014), this study focuses on an important sub-population of youth who represent a significant proportion of the population that may have a disproportionate disease burden.
The park typology may not be generalizable to other geographical lo-cations. In addition, although a typology with nine park types may best reflect the variation in park types that exist in the MCMA, the high num-ber of park types, along with a low numnum-ber of participants in each park type, may have impacted on the study's power to detect meaningful dif-ferences in the outcomes of interest. Also, the park types and control variables explained little in the variation of self-reported PA behaviors and truncal fat. The park types explained only 4% of the variation in the reported bouts of PA, 1.5% of the variation in the mean variety of PA, and 7% of the variation in truncal fat. At the population level, how-ever, this may have a large impact on the future health burden (Rose, 1992). Finally, our interpretation of the studyfindings are to be considered within the context of their exploratory nature.
This study adds to a growing body of literature describing associa-tions between features of parks and PA and adiposity outcomes in
youth. Suchfindings may be relevant to obesity prevention strategies related to urban planning designed to motivate at-risk youth to be more physically active. Future studies should attempt to validate the park typology as well as generate hypotheses of park type and PA and adiposity outcomes among youth at risk of obesity using longitudinal data.
Funding
The QUALITY cohort is funded by the Canadian Institutes of Health Research (#OHF-69442, #NMD-94067, #MOP-97853, #MOP-119512), the Heart and Stroke Foundation of Canada (#PG-040291) and the Fonds de recherche du Québec— Santé.
The QUALITY Residential and School Built Environment complemen-tary studies were funded by the Heart and Stroke Foundation of Canada and the Canadian Institutes of Health Research, respectively. MB is sup-ported by a Canadian Institutes of Health Research Doctoral Research Award. GDD is supported by a career award from the Canadian Cancer Society Research Institute (award #703946). AVH is supported by a Canadian Institutes of Health Research Postdoctoral Fellowship and an award in preventive cardiology from the Heart and Stroke Foundation Canada. MH (Junior 1) and TAB (Junior 2) are Fonds de recherche du Québec— Santé research scholars.
Conflicts of interest
The authors declare that there are no conflicts of interest. Transparency document
TheTransparency documentassociated with this article can be
found, in online version. Acknowledgments
MB conducted the literature search, data analyses and interpreta-tion, and generation of tables. GDD defined specific aims, guided analy-ses and interpreted thefindings. AVH conducted data collection and data interpretation. M-SC conducted data interpretation. MH conducted data interpretation. TB conceived of the study design, guided analyses and conducted data collection and interpretation. All authors were in-volved in writing the paper and hadfinal approval of the submitted and published versions.
This research was conducted by members of TEAM PRODIGY, an inter-university research team including Université de Montré-al, Concordia University, Université LavMontré-al, and McGill University.
Table 5
Linear regression examining the relationship between park type and self-reported mean bouts of physical activity, mean variety of physical activities and truncal fat (n = 570). Children living near Bouts of physical activity Variety of physical activities Truncal fat (%)
Beta estimate 90% CI Beta estimate 90% CI Beta estimate 90% CI Park type I Reference category
Park type II 1.9 0; 3.8 0.9 −0.1; 1.9 −0.6 −2.6; 1.3
Park type III 1.8 −0.3; 3.9 1.0 −0.1; 2.0 −1.8 −3.9; 1.3
Park type IV 1.9 0; 3.9 0.9 −0.1; 2.0 −1.0 −3.0; 1.0
Park type V 2.2⁎⁎ 0; 4.3 1.1⁎⁎ 0; 2.2 −0.2 −2.4; 2.0 Park type VI 2.5⁎⁎ 0.2; 4.7 1.4⁎⁎ 0.2; 2.5 −0.5 −2.7; 1.8 Park type VII 2.5⁎⁎ 0.4; 4.7 0.9 −0.2; 1.9 −1.7 −3.9; 0.5 Park type VIII 5.2⁎ 2.3; 8.1 1.6⁎⁎ 0.1; 3.1 −3.4⁎⁎ −6.4; −0.5 Park type IX 1.9 −2.9; 6.7 1.8 −0.7; 4.2 −0.5 −5.4; 4.3 CI: Confidence interval.
Bouts of physical activity refers to the mean sum of 3 recalls of 15-minute bouts of PA over a one week period outside of regular gym class. Variety of physical activities refers to the average number of different types of PA practiced and reported by the child over the three recalls. Truncal fat refers to the percentage of central-to-total body fat, calculated as ((central fat mass in grams) / (total fat mass in grams))∗ 100. All models include household income, sex, age and puberty initiated as covariates.
⁎ p b 0.05. ⁎⁎ p b 0.10.
Dr. Marie Lambert (July 1952–February 2012), pediatric geneticist and researcher, initiated the QUALITY cohort. Her leadership and devotion to QUALITY will always be remembered and appreciated. We are grateful to all the families that participate in the QUALITY cohort.
References
Bender, R., Lange, S., 2001.Adjusting for multiple testing—when and how? J. Clin. Epidemiol. 54 (4), 343–349.
Besenyi, G.M., Kaczynski, A.T., Wilhelm Stanis, S.A., Vaughan, K.B., 2013.Demographic variations in observed energy expenditure across park activity areas. Prev. Med. 56 (1), 79–81.
Bird, M., Datta, G., van Hulst, A., Kestens, Y., Barnett, T., 2015.A reliability assessment of a direct-observation park evaluation tool: the parks, activity and recreation among kids (PARK) tool. BMC Public Health 15 (1), 906.
Bosch, T.A., Dengel, D.R., Kelly, A.S., Sinaiko, A.R., Moran, A., Steinberger, J., 2015.Visceral adipose tissue measured by DXA correlates with measurement by CT and is associat-ed with cardiometabolic risk factors in children. Passociat-ediatr. Obes. 10 (3), 172–179.
Brown, C.L., Halvorson, E.E., Cohen, G.M., Lazorick, S., Skelton, J.A., 2015.Addressing child-hood obesity: opportunities for prevention. Pediatr. Clin. North Am. 62 (5), 1241–1261.
Casey, R., Oppert, J.-M., Weber, C., Charreire, H., Salze, P., Badariotti, D., et al., 2014. Deter-minants of childhood obesity: what can we learn from built environment studies? Food Qual. Prefer. 31, 164–172.
Centers for Disease Control and Prevention. Recommended BMI-for-age Cutoffs Atlanta, 2014I. Georgia: centres for disease control and prevention. [cited 2015 25 Septem-ber]. Available from:http://www.cdc.gov/nccdphp/dnpao/growthcharts/training/ bmiage/page4.html.
Cohen, D.A., Ashwood, J.S., Scott, M.M., Overton, A., Evenson, K.R., Staten, L.K., et al., 2006.
Public parks and physical activity among adolescent girls. Pediatrics 118 (5) (e1381-e9).
Cohen, D.A., Marsh, T., Williamson, S., Derose, K.P., Martinez, H., Setodji, C., et al., 2010.
Parks and physical activity: why are some parks used more than others? Prev. Med. 50, S9–S12.
Colley, R., Garriguet, D., Janssen, I., Craig, C.L., Clarke, J., Tremblay, M.S., 2011.Physical ac-tivity of Canadian children and youth: accelerometer results from the 2007 to 2009 Canadian Health Measures Survey. Health Rep. 22 (1), 15–23.
Ding, D., Gebel, K., 2012.Built environment, physical activity, and obesity: what have we learned from reviewing the literature? Health Place 18, 100–105.
Dunton, G.F., Almanza, E., Jerrett, M., Wolch, J., Pentz, M.A., 2014.Neighborhood park use by children: use of accelerometry and global positioning systems. Am. J. Prev. Med. 46 (2), 136–142.
Evenson, K.R., Catellier, D.J., Gill, K., Ondrak, K.S., McMurray, R.G., 2008.Calibration of two objective measures of physical activity for children. J. Sports Sci. 26 (14), 1557–1565.
Faith, M., Leone, M., Ayers, T., Heo, M., Pietrobelli, A., 2002.Weight criticism during phys-ical activity, coping skills, and reported physphys-ical activity in children. Pediatrics 110 (2).
Ferdinand, A.O., Sen, B., Rahurkar, S., Engler, S., Menachemi, N., 2012.The relationship be-tween built environments and physical activity: a systematic review. Am. J. Public Health 102 (10), e7–e13.
Floyd, M.F., Bocarro, J.N., Smith, W.R., Baran, P.K., Moore, R.C., Cosco, N.G., et al., 2011.
Park-based physical activity among children and adolescents. Am. J. Prev. Med. 41 (3), 258–265.
Freedman, D.S., Sherry, B., 2009.The validity of BMI as an indicator of body fatness and risk among children. Pediatrics 124 (Suppl. 1).
Hoey, H., 2014.Management of obesity in children differs from that of adults. Proc. Nutr. Soc. (FirstView: 1-7).
Janssen, I., 2014.Active play: an important physical activity strategy in thefight against childhood obesity. Can. J. Public Health 105 (1) (e22-e7).
Johnson-Down, L., O'Loughlin, J., Koski, K.G., Gray-Donald, K., 1997.High prevalence of obesity in low income and multiethnic schoolchildren: a diet and physical activity as-sessment. J. Nutr. 127 (12), 2310–2315.
Kaczynski, A., Potwarka, L., Saelens, B., 2008.Association of park size, distance and fea-tures with physical activity in neighborhood parks. Am. J. Public Health 98 (8).
Lambert, M., van Hulst, A., O'Loughlin, J., Tremblay, A., Barnett, T., Charron, H., et al., 2011.
Cohort profile: the Quebec adipose and lifestyle investigation in youth cohort. Int. J. Epidemiol. 1-12.
Marshall, W., Tanner, J., 1969.Variations in pattern of pubertal changes in girls. Arch. Dis. Child. 44, 291–303.
Marshall, W.A., Tanner, J.M., 1970.Variations in the pattern of pubertal changes in boys. Arch. Dis. Child. 45 (239), 13–23.
Nesbit, K.C., Kolobe, T.A., Arnold, S.H., Sisson, S.B., Anderson, M.P., 2014.Proximal and dis-tal environmendis-tal correlates of adolescent obesity. J. Phys. Act. Health 11 (6), 1179–1186.
Ng, M., Fleming, T., Robinson, M., Thomson, B., Graetz, N., Margono, C., et al., 2014.Global, regional, and national prevalence of overweight and obesity in children and adults during 1980–2013: a systematic analysis for the Global Burden of Disease Study 2013. Lancet 384 (9945), 766–781.
Oakes, J.M., Forsyth, A., Schmitz, K.H., 2007.The effects of neighborhood density and street connectivity on walking behavior: the Twin Cities walking study. Epidemiol. Perspect. Innov. 4 (1), 1–9.
ParticipACTION, 2015.ParticipACTION. The biggest risk is keeping kids indoors. The 2015 ParticipACTION Report Card on Physical Activity for Children and Youth (Toronto).
Pietrobelli, A., Faith, M.S., Allison, D.B., Gallagher, D., Chiumello, G., Heymsfield, S.B., 1998.
Body mass index as a measure of adiposity among children and adolescents: a valida-tion study. J. Pediatr. 132 (2), 204–210.
Potwarka, L.R., Kaczynski, A.T., Flack, A.L., 2008.Places to play: association of park space and facilities with healthy weight status among children. J. Community Health 33, 344–350.
Prince, S., Adamo, K., Hamel, M., Hardt, J., Gorber, S., Tremblay, M., 2008.A comparison of direct versus self-report measures for assessing physical activity in adults: a system-atic review. Int. J. Behav. Nutr. Phys. Act. 5 (1), 56.
Rose, G., 1992.The Strategy of Preventive Medicine. Oxford University Press, Oxford, UK.
Rung, A.L., Mowen, A.J., Broyles, S.T., Gustat, J., 2011.The role of park conditions and fea-tures on park visitation and physical activity. J. Phys. Act. Health 8 (Suppl. 2) (S178-S87).
Sallis, J.F., Saelens, B.E., 2000.Assessment of physical activity by self-report: status, limita-tions, and future directions. Res. Q. Exerc. Sport 71 (sup2), 1–14.
Sallis, J.F., Buono, M.J., Roby, J.J., Micale, F.G., Nelson, J.A., 1993.Seven-day recall and other physical activity self-reports in children and adolescents. Med. Sci. Sports Exerc. 25 (1), 99–108.
Shores, K., West, S., 2008.The relationship between built park environments and physical activity in four park locations. J. Public Health Manag. Pract. 14 (3), e9–e16.
Statistics Canada, 2014. Body Mass Index of Children and Youth, 2012 to 2013. Statistics Canada, Ottawa ([cited 2015 12 August]. Available from:http://www.statcan.gc.ca/ pub/82-625-x/2014001/article/14105-eng.htm).
Sterne, J.A.C., Smith, G.D., 2001.Sifting the evidence—what's wrong with significance tests? Phys. Ther. 81 (8), 1464–1469.
Tabachnick, B.G., Fidell, L.S., 2007.Using Multivariate Statistics. 5 ed. Boston, Massachu-setts, Pearson Allyn & Bacon.
Tan, P.-N., Steinbach, M., Kumar, V., 2005.Introduction to Data Mining. 1 ed. Boston, Mas-sachusetts, Addison Wesley.
Taylor, B.T., Fernando, P., Bauman, A.E., Williamson, A., Craig, J.C., Redman, S., 2011. Mea-suring the quality of public open space using Google earth. Am. J. Prev. Med. 40 (2), 105–112.
van Hulst, A., Thomas, F., Barnett, T.A., Kestens, Y., Gauvin, L., Pannier, B., et al., 2012.A ty-pology of neighborhoods and blood pressure in the RECORD cohort study. J. Hypertens. 30, 1336–1346.
van Hulst, A., Roy-Gagnon, M.-H., Gauvin, L., Kestens, Y., Henderson, M., Barnett, T., 2015.
Identifying risk profiles for childhood obesity using recursive partitioning based on individual, familial, and neighborhood environment factors. Int. J. Behav. Nutr. Phys. Act. 12 (1), 17.