OATAO is an open access repository that collects the work of Toulouse
researchers and makes it freely available over the web where possible
Any correspondence concerning this service should be sent
to the repository administrator:
[email protected]
This is an author’s version published in:
http://oatao.univ-toulouse.fr/20371
To cite this version:
Ondarçuhu, Thierry and Thomas, Vincent and Nuñez, Marc
and Dujardin, Erik and Rahman, Atikur and Black, Charles T.
and Checco, Antonio Wettability of partially suspended
graphene. (2016) Scientific Reports, 6. 24237. ISSN
2045-2322
Official URL:
https://doi.org/10.1038/srep24237
Wettability of partially suspended
graphene
Thierry Ondarçuhu
1, Vincent Thomas
1, Marc Nuñez
1, Erik Dujardin
1, Atikur Rahman
2,
Charles T. Black
2& Antonio Checco
3The dependence of the wettability of graphene on the nature of the underlying substrate remains only partially understood. Here, we systematically investigate the role of liquid-substrate interactions on the wettability of graphene by varying the area fraction of suspended graphene from 0 to 95% by means of nanotextured substrates. We find that completely suspended graphene exhibits the highest water contact angle (85° ± 5°) compared to partially suspended or supported graphene, regardless of the hydrophobicity (hydrophilicity) of the substrate. Further, 80% of the long-range water-substrate interactions are screened by the graphene monolayer, the wettability of which is primarily determined by short-range graphene-liquid interactions. By its well-defined chemical and geometrical properties, supported graphene therefore provides a model system to elucidate the relative contribution of short and long range interactions to the macroscopic contact angle.
Graphene, the one-atom thick, two-dimensional carbon allotrope, has received significant attention owing to its extraordinary electronic, optical and mechanical properties1. Advanced coating applications of graphene may
also benefit from its high mechanical and thermal stability, excellent chemical resistance and impermeability to gases2. Yet, the full technological potential of graphene coatings still requires better understanding of how the
atomic monolayer alters the physicochemical properties of the underlying substrate. In particular, the extent of “wetting transparency” of graphene – i.e. transparency to chemical, van der Waals and electrostatic interactions between liquid and substrate atoms or molecules – remains a much debated question3–7. In principle, the
wettabil-ity of graphene-coated solids should depend on graphene-liquid short range interactions but also on solid-liquid long range interactions8,9. An early study by Rafiee et al.3 suggested that graphene coatings are “transparent”
to wetting i.e. do not significantly alter the intrinsic wettability of apolar solids, which interact with water pre-dominantly through van der Waals forces. Conversely, other authors4–6,10 partially revised these conclusions by
showing experimentally that graphene is only partially transparent (or “translucent”) to wetting. Progress on this complex topic has been hampered by experimental shortcomings such as defects occurring during the growth and/or transfer of graphene on a substrate5, as well as adventitious carbon contamination10, both of which were
shown to dramatically alter the intrinsic wettability of graphene and graphitic materials alike11,12. The
theoret-ical description of graphene wetting phenomena is equally challenging because they are highly dependent on the model taken for the adsorbate-graphene interactions. For instance, the adsorption of water on graphene is not accurately reproduced by density functional theory (DFT) even when effects of dispersive interactions are taken into account13,14. Several Molecular Dynamics (MD) studies have modeled the wettability of graphene but
their results depend quantitatively on the choice of the water− carbon interaction potentials4,5,15,16, which are not
known precisely. Nevertheless, MD as well as mean field approaches on flat4,5,16 and rough15 substrates are
consist-ent with the partial wetting transparency of graphene observed in some experimconsist-ents.
Despite considerable progress, a comprehensive and consistent understanding of water-graphene interactions is still lacking. Bridging this gap requires the characterization of the intrinsic wetting properties of a suspended graphene sheet in the absence of any interactions with the supporting substrate. However, this is experimentally challenging since capillary forces exerted by macroscopic drops on the graphene membrane may either tear it or fold it. Here, we circumvent this limitation by preparing graphene monolayers partially supported on nano-patterned silicon substrates over macroscopically large (cm2) areas. The surface fraction of suspended graphene
is varied from 0% to approximately 95% by controlling the morphology of the textured substrate, which allows quantifying the effect of water-substrate interactions on the wettability of graphene. Further, we develop a novel
1Nanosciences group, CEMES-CNRS, 29 rue Jeanne Marvig, Toulouse 31055, France. 2Center for Functional Nanomaterials, Brookhaven National Laboratory, Upton, NY 11973, USA. 3Condensed Matter Physics and Materials Science Department, Brookhaven National Laboratory, Upton, NY 11973, USA. Correspondence and requests for materials should be addressed to T.O. (email: [email protected]) or A.C. (email: [email protected])
received: 30 December 2015 Accepted: 22 March 2016 Published: 13 April 2016
www.nature.com/scientificreports/
2
ScientificRepoRts | 6:24237 | DOI: 10.1038/srep24237procedure for transferring graphene to a solid support that obviates the irreversible contamination associated to polymer-assisted transfer. The water contact angle on both fully supported and partially suspended graphene depends marginally on the chemical nature of the substrate and the suspension fraction, albeit suspended mon-olayers are slightly more hydrophobic than supported ones. We show that the wettability of graphene is dic-tated primarily by water-graphene interactions and to a much lesser extent by water-substrate interactions. By its well-defined chemical and geometrical properties, supported graphene therefore provides a model system to elucidate the relative contribution of short and long range interactions to the macroscopic contact angle8,9.
Results
Fabrication and characterization of suspended graphene layers.
In order to tailor the fraction of suspended graphene, we have fabricated large area (~1 cm2), nanopatterned silicon surfaces with uniform featuresize and spacing on a 10-nm length scale using block copolymer self-assembly and plasma etching (Fig. 1)17.
Tapered conical structures with either sharp (width w ~ 5 nm) or flat (w ~ 15 nm to w ~ 30 nm) tips were obtained using a block-copolymer mask with cylindrical morphology and by varying the vertical and lateral etching rates (Fig. 1a). Fingerprint patterns of grooves and ridges (size w~12 nm to w~20 nm at the top) were obtained using a block copolymer mask with lamellar morphology (Fig. 1b). A precise control over the texture morphology allowed varying the solid areal fraction at the top of the texture φS from approximately 5–80%, thereby
mak-ing these substrates ideally suited to fundamental studies of wettmak-ing of suspended graphene by water (Fig. 1c). Moreover, we performed surface functionalization to obtain patterned substrates with either hydrophilic or hydrophobic properties (see Methods for details).
Supported and partially suspended graphene monolayers were transferred from copper foils bearing graphene grown by chemical vapor deposition (CVD)18,19. A most common procedure for transferring graphene from
copper to another supporting material starts by stabilizing the supported graphene monolayer with a thick layer of polymer (e.g. poly-methyl methacrylate, PMMA)3–5,10. Although this method allows transferring large (~1 m2)
graphene films without compromising its mechanical integrity20,21, it leads to irreversible polymer contamination
of the graphene surface22,23, thereby altering its intrinsic wettability. In order to circumvent this issue, we have
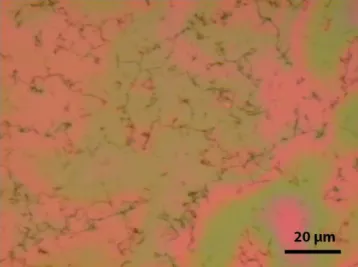
developed a polymer-free transfer method sketched in Fig. 2a and described in detail in Methods section. The quality of the layers transferred onto flat and nanopatterned silicon substrates was assessed by optical microscopy, atomic force microscopy (AFM), Raman spectroscopy and scanning electron microscopy (SEM). The overall integrity of the graphene layer deposited on flat silicon is preserved during the transfer procedure leaving large areas available for contact angle measurements. However, contrary to polymer-assisted transfer methods, the graphene monolayer exhibits wrinkles most likely caused by surface tension forces acting on the floating layer after the copper foil is etched away (Fig. 2b and Supplementary Fig. SI1). These wrinkles appear as darker, narrow lines (~100 nm-wide) in both SEM and optical microscopy images (Fig. 2b) covering 6-8% of the graphene surface. Moreover, graphene pinholes were observed with diameters of a few micrometers covering about 1-2% of the graphene surface.
Graphene monolayers transferred onto nanopatterned substrates remain suspended without sagging signifi-cantly into the voids, regardless of the porosity of the texture, as shown in Fig. 3 (see Supplementary Section SI2 for further details). AFM inspection reveals that the root mean square (rms) roughness of the graphene layer deposited on a nanocone texture is less than 0.4 nm between wrinkles (see inset of Fig. 3d). This remarkable result is understood by considering the large elastic bending energy required to conform the graphene sheet to Figure 1. (a) SEM micrograph of a nanopatterned substrate with conical tips and spacing of 50 nm. (b) SEM micrograph of a substrate with 16 nm-wide grooves and a 70 nm period. (c) Sketch of the experiment.
textures with extremely small period (~50 nm) and high aspect ratio. It is consistent with a recent study showing that graphene remains suspended atop post arrays if the inter-post distance is less than a critical length approxi-matively equal to 250 nm24. At the micrometer scale, the structure of the suspended monolayers exhibits a pattern
of folds similar in aspect and area fraction coverage to that observed on graphene transferred on flat substrates. However, a significantly larger pinhole density (~8%) was observed on monolayers deposited on sharp nanocone textures with a substrate fraction φs < 15% (see Supplementary Fig. SI2). On textured substrates, the occasional
Figure 2. (a) Scheme of the transfer method: (1) the copper foil supporting the graphene is etched by an ammonium persulfate solution leaving a floating monolayer (2); the graphene foil is then scooped on a glass slide and redeposited on a water surface for rinsing (not shown); the monolayer is then scooped out on the substrate (3) and dried (4). (b) SEM image of a graphene layer deposited on a flat SiO2/Si substrate; inset: optical
micrograph of the layer; in both images wrinkles appear as darker lines.
Figure 3. (a–c) SEM images of graphene layers deposited on textures composed of tapered cones with flat tips, grooves, and tapered cones with sharp tip, respectively; (d) AFM image of graphene layer on a conical texture where the white line represent a cross-sectional profile. Scale bar is 200 nm.
www.nature.com/scientificreports/
4
ScientificRepoRts | 6:24237 | DOI: 10.1038/srep24237presence of small cracks connecting series of posts is also observed. We hypothesize that these cracks are formed by releasing the strain induced by capillary forces during the drying of the textured substrates.
The efficiency of the graphene transfer on hydrophobic textures, is smaller partly because of the turbulences occurring during the addition of isopropanol in water, which sometimes tear the graphene layer into fragments too small for contact angle measurements. The transfer of graphene on conical textures systematically leads to fragmented layers which are only partially suspended and cannot be used for contact angle measurements.
While our graphene monolayers are free of polymer contamination, adventitious carbon readily adsorbs on graphene exposed to ambient air and alters its intrinsic wettability10. In order to remove these contaminants, the
samples were systematically annealed at high temperature under a continuous flow of reductive Ar/H2
atmos-phere (see Methods)22,23,25,26. We observed that this process effectively removes the adsorbates on the commecial
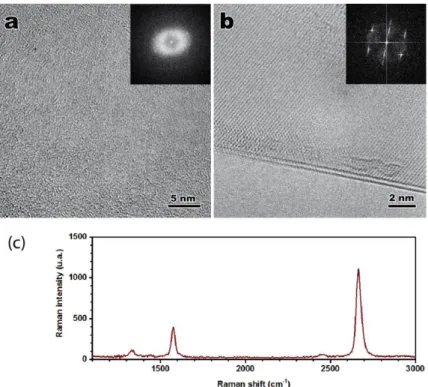
CVD-grown graphene samples. The efficiency of the cleaning protocol was assessed by high resolution transmis-sion electron microscopy imaging and diffraction while Raman spectroscopy gave strong indications of a single monolayer (see Supplementary Section SI3).
The protocol for reproducible contact angle measurement was optimized on graphene monolayers transferred onto flat silicon dioxide from three different commercial CVD-grown graphene sources (see Supplementary Section SI4). Advancing and receding contact angles were measured on several graphene regions, immediately after the reductive annealing and for a few hours afterwards. The quality of the layers transferred onto flat and nanopatterned silicon substrates was assessed10,11. Interestingly, the advancing contact angle is very reproducible
(standard deviation < 1°) whereas receding contact angle is more sensitive to defects (standard deviation > 9°)5.
Consequently, we characterized the intrinsic properties of graphene layers by measuring advancing contact angle values obtained within ten minutes after the annealing process.
Wetting properties of the bare substrates.
In order to investigate the influence of a graphene layer on the wetting properties of a substrate, we first characterized the wettability of the bare nanopatterned substrates. The measurements were performed on bare parts of the samples supporting graphene to ensure that both situa-tions (with and without graphene monolayer) were subject to identical surface treatments and that wettability differences can therefore be attributed to the graphene influence. In particular, the Ar/H2 annealing significantlymodifies the wettability of flat SiO2 substrates. We have found that the flat silicon samples were completely wet by
water after piranha cleaning (θSiOnative2 = °0 ) but became less hydrophilic after annealing, θSiO =55° ± °4
anneal
2 .
Conversely, the wettability of the flat fluorinated SiO2 samples θ( FLSiO2=105° ± °1 ) remained unchanged after
annealing suggesting that the surface treatment did not significantly compromise the structural integrity of the silane coating. The advancing contact angles of the hydrophilic and hydrophobic nanopatterned surfaces, denoted as θSphilicand θ
Sphobicrespectively, are reported in red in Fig. 4 as a function of the solid area fraction φs (red filled
and red open circles respectively). These results show that the surface roughness enhances either the hydrophilic or the hydrophobic character of the substrates. For the sharper structures (φS < 10%), the contact angle was found
to be a few degrees for hydrophilic substrates whereas it reached 165° for the hydrophobic ones, typical of super-hydrophilic and super-hydrophobic surfaces17, respectively. Optical images of the contact line region
revealed that, on hydrophilic nanopatterned surfaces, a wetting film extended from 10 to 100 microns ahead of the contact line, depending on the surface texture. The film appeared bright close to the contact line and dark close to the leading edge. We hypothesize that the film forms through the spontaneous impregnation of the tex-tures with water27. The film color variation reflects changes in thickness; the film is thick enough to cover the
texture completely in the region close to the contact line, but only partially near leading edge. This “hemiwicking” occurs when the contact angle on the walls is smaller than a critical value defined by cosθ ≈⁎ 1/ where r is the r
roughness ratio27. Our textured samples exhibit spontaneous wicking owing to their relatively high roughness
(r = 5 − 10), and intrinsic hydrophilicity (θSiOanneal
2 = 55° on annealed SiO2). Conversely, no such film was observed
ahead of the droplet contact line on hydrophobic textures. In this case, wicking is suppressed by the surface hydrophobicity (θSiOFL
2 = 105° on fluorinated SiO2) and the droplet remains suspended on the texture.
Based on these observations, we have modeled the contact angle of wettability θS of the bare patterns, denoted
as θS using the Cassie-Baxter (CB) equation28.
θ = φ θ + −φ θ
cos S S cos T (1 S)cos V (1)
where θT is the contact angle on the textured material, and θV the contact angle on the medium filling the texture
voids, i.e. water (θV = 0°) or air (θV = 180°) for the hydrophilic and hydrophobic textures, respectively. The CB
model is plotted against the data in Fig. 4a using the experimental values θT = 55°, 105° for the hydrophilic (solid
green line) and hydrophobic (green dashed line) pattern, respectively. The good agreement between theory and experiment suggests that the CB model describes adequately the wetting of the whole range of complex composite surfaces studied here.
Wettability of partially suspended graphene monolayers.
Next, we measured the contact angle θGSof water on the graphene layers transferred on the same nanostructures. On hydrophilic substrates, the optical observation of the droplets revealed features similar to the ones obtained on bare substrates resulting from the liquid impregnation of the textured surface beneath the graphene layer ahead of the contact line (Fig. 4b). Evaporation or removal of the droplet with the same syringe used for liquid dispensing demonstrated that the layer below the droplet is also filled with liquid. Under these conditions, the measured contact angle thus reflects the wettability of a graphene layer partially suspended on water, as schematized in the inset of Fig 4b. This contact angle was found to decrease very slightly with decreasing φs ranging from θGSphilic=69° ± °1 , the value obtained
significantly lower contact angle in the range 49° ≤θGSphilic≤60° was found for sharp conical structures (φs < 15%).
The same experiments were performed on the hydrophobic substrates, where the weak adhesion of graphene onto fluorinated nanopatterned substrates occasionally resulted in graphene lifting off from the surface to wrap the droplet during contact angle measurements29,30. This issue, combined with the difficulty of transferring
graphene to substrates with φS < 25%, resulted in a smaller number of reliable measurements on hydrophobic
samples than on hydrophilic ones. Optical imaging of water droplets deposited on graphene supported by hydro-phobic textures showed that the liquid does not spread ahead of the contact line (Fig. 4c) or beneath the graphene layer. This was due to the super-hydrophobic properties of the supporting substrate, which led to a water droplet on a graphene layer partially suspended on air as sketched in Fig. 4c. The contact angle measurements are reported in Fig. 4a in open blue circles. Similarly to the case of graphene supported by hydrophilic textures, no strong dependence on φS is observed. The average contact angle, was found to increase slightly from
θGSphobic=77° ± °1 on a flat fluorinated substrate to θGSphobic=83 5. ° ± . °2 5 on hydrophobic patterns with
φS = 25%.
We can rule out the possibility that the weak dependence of θGSphilic phobic, on φ
s be due to defects in the graphene
layer. In fact, the surface density of defects (either holes and cracks) in supported graphene sheets amounts to ~2% on flat supports and up to 8% on nanocone textures. These defects influence θGS depending on the wetting
properties of the underlying substrate. On a superhydrophilic substrate, a hole in graphene locally creates a strong wetting defect, whereas on superhydrophobic substrates it gives rise to a strong non-wetting defect. These two types of defects are clearly visible in close-up viewgraphs of the contact line shown in Fig. 4d,e, respectively. Hence, the defects can in principle lead to an apparent decrease of θGSphilic (or increase of θGSphobic) as a function of φS
thereby mimicking the experimental results. We have modelled this effect using the Cassie-Baxter equation (see Supplementary Section SI5 for further details). Our calculations shows that defect densities up to 2% have a Figure 4. (a) Contact angles versus solid area fraction, φS, for bare hydrophilic (filled red circles), bare
hydrophobic (hollow red circles), graphene-coated hydrophilic (filled blue circles), and graphene-coated hydrophobic substrates (hollow blue circles). Green solid and dashed lines represent the Cassie-Baxter contact angle for bare hydrophilic and hydrophobic substrates, respectively. (b,c) Top-view optical image of a water drop on a graphene coated hydrophilic and hydrophobic nanotexture, respectively, where the insets depict the wetting conditions schematically (scale bar = 100 μm). (d,e) Close up view of contact line distortions on a graphene coated hydrophilic and hydrophobic nanopatterned substrates, respectively, where arrows mark the defect location (scale bar = 10 μm).
www.nature.com/scientificreports/
6
ScientificRepoRts | 6:24237 | DOI: 10.1038/srep24237limited effect (less than 10%) on θGS. However, the 8% defect density of graphene supported by superhydrophilic
samples (φS < 15%), may account for up to 30% of the decrease of θGS measured on these substrates.
The dependence of θGS on the composition of the supporting substrate therefore reflects changes in
water-graphene-substrate interactions, rather than the spurious effect of graphene defects. An important finding of this work is that the wettability of graphene varies very little even when it is supported by materials with very different chemical composition such as air, water, silicon dioxide, and fluorinated silicon oxide. This implies that θGS is dictated, to a large extent, by water-graphene interactions and, to a lesser extent, by long range
water-substrate interactions through the graphene layer.
These findings partially differ from the results of Raj et al. who reported no influence of the underlying (hydrophilic) substrate and from a study by Shih et al.4 who found that graphene is opaque to wetting for
hydro-phobic substrates (θS > 90°) but showed some degree of transparence for hydrophilic substrates (30° < θS < 90°).
A combined influence of graphene and underlying substrate was also shown6,10 but not described quantitatively.
The lack of consensus among these studies may stem from the choice of contact angle measurement methods (static contact angle is not as well-defined as advancing angle due to contact angle hysteresis) or from sample preparation, which does not systematically eliminate airborne contaminants.
Discussion
In order to relate quantitatively the observed wetting translucency of graphene to the underlying molecular inter-actions, we have plotted the cosine of the contact angle of supported graphene, cos θGS, as a function of the cosine
of the contact angle on the bare substrates, cos θS. Indeed, cos θGS is related to the water-graphene-solid effective
interaction potential per unit area WWGS through the Young-Dupré equation31.
γ(1+cosθGS)= −WWGS (2)
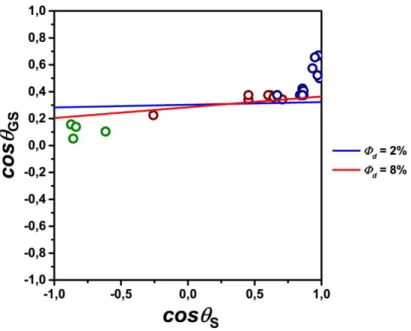
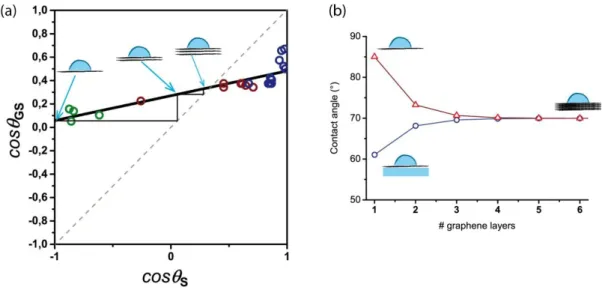
where γ is the surface tension of water. Figure 5 gathers the measurements performed on all the fabricated sam-ples which were categorized in three types, namely supported graphene (red open dots), graphene partially sus-pended on air (green open dots) and water (blue open dots). Remarkably, the data show that all experimental results collapse on a straight line except for data points in a narrow region where cos θS ≅ 1. The scattering of data
in this region is likely due to the larger density of graphene defects on hydrophilic nanocone textures (φd ~ 8%).
A linear fit to the data (solid black line) allows extrapolating the water contact angle on two ideal cases: totally suspended graphene θG = 85° ± 5° (for cos θs = −1), and graphene floating on water, θGW = 61° ± 5° (for
cos θs = +1). Our results are well described by recent mean field calculations of water wetting a flat graphene sheet
suspended on a rough substrate assuming dispersive interactions15. Specifically, the experimental difference
Δθ = θGW − θG = − 24° is in close quantitative agreement with θ∆ theory≈ − °18. Driskill et al.16 have predicted a
slightly smaller θ∆ theory≈ − °10 when taking into account both dispersive and dipolar interactions.
The data presented in Fig. 5 are also consistent with the experimental wetting of freshly cleaved, highly oriented pyrolytic graphite (HOPG). Since this material is composed of stacked graphene layers, its wettabil-ity should not change with the addition of a graphene coating, leading to the relationship θGS = θS. Hence, the
Figure 5. Plot of cos θGS as a function of cos θS for the three different systems schematized in the above
insets: fully supported graphene in red, partially suspended on air in green and partially suspended on water in blue. The solid black line is a linear fit of the experimental data. Grey dashed line is the cos θ GS = cos θ S
contact angle of water on HOPG can be determined graphically as the intersection of the linear fit to the data with the cos θGS = cos θS line (dashed line in Fig. 5). The value θHOPG = 70° ± 5° obtained from Fig. 5 is in good
quantitative agreement with the experimental θHOPG = 62,4° ± 0,9° shown in Fig. 5 as the black cross (see also
Experimental Section for details). Wettability of few layered graphene can also be deduced graphically from the data in Fig. 5 as detailed in the Supplementary Section SI6.
The linear relationship between cos θGS and cos θS can also be understood by writing the
general-ized Young-Dupré equation for water on the bare substrate: γ(1 + cos θs) = −WWS, water on graphene:
γ(1 + cos θG) = −WWG, and water on supported graphene γ(1 + cos θGS) = −WWGS = −WWG − α WWS, where WWS
and WWG are the water-substrate and water-graphene effective interaction potentials per unit area and we have
also assumed that WWGS can be linearly decomposed as WWGS ≅ WWG + αWWS. α represents a phenomenological
“screening parameter” that quantifies the degree of graphene transparency such that α = 0describes a perfectly opaque layer. Solving these equations for cos θGS yields:
θ =α θ + θ +α
cos GS cos S cos G (3)
A linear fit to the experimental data gives α = 0, 21 ± 0, 03, or α = 0, 19 ± 0, 03 when a 2% defect density is taken into account (see Supplementary Section SI5 for further details). This result indicates that graphene screens 81% of the water-substrate interactions compared to a direct contact and is consistent with estimations by mean field theory32 leading to about 70% of interactions blocked by a graphene monolayer.
The origin of this screening effect is twofold. On the one hand, the intercalation of graphene between water and substrate increases the average distance between the water molecules and the substrate thereby lowering their interaction. In the case of van der Waals and dipole-dipole interaction the resulting effective interaction potential per unit area then scales as31 ∼W 1/d2. On the other hand, these long range water-substrate interactions are
mediated by the graphene sheet. The screening caused by the increased water–substrate distance alone can be approximated as α = d( WS WGS/d )2 where dWS and dWGS are the equilibrium distances between liquid and substrate
in contact or separated by graphene, respectively. An estimate of the screening in the particular case of wetting of graphene on water where dWGS = 2dWS yields α = 0,25. This value is very close to the experimental result,
suggest-ing that, at least for solids and liquids interactsuggest-ing solely through dispersive forces, the “screensuggest-ing effect” can be almost entirely understood as an increase of water-substrate separation upon inserting the graphene coating. Note that, in the general case, the estimation of α requires a precise knowledge of the water-graphene and substrate-graphene distances which both are theoretically calculated to be of the order of 3 Å5,33,34.
The experimental value of α is smaller than the pure geometrical estimate, which indicates that a small but significant weakening of the water-substrate interactions may arise from the weak but non-zero electrostatic screening efficiency of the graphene layer35.
Although these results can be understood qualitatively using continuum models of dispersive and dipolar interactions within a mean field approach, a rigorous quantitative description requires more sophisticated calcu-lations based on DFT and molecular dynamics. We hope that our work will stimulate further theoretical analysis.
Conclusions
We have presented a comprehensive study of water wettability on graphene suspended on various nanotex-tured surfaces. By varying the fraction of solid area of the support we were able, for the first time, to measure the water contact angle on a single graphene sheet almost completely suspended on air or supported by water. Through physical and chemical substrates engineering, we were also able to study the substrate dependence of graphene’s wettability to an unprecedented extent. Altogether, these results indicate that the contact angle of water on supported graphene is dictated almost exclusively by (long range attractive and short range repulsive) liquid-graphene interactions. Only ~20% of the long-range interactions between the liquid and the substrate are transmitted through graphene. Our findings shed new lights on the role of liquid-solid microscopic interaction on macroscopic quantities such as the contact angle. They are also relevant to many technological applications of graphene including advanced coatings36–38 and water filtration membranes39.
Methods
Substrate functionalization.
The nanopatterned and flat substrates were degreased by sonication in suc-cessive baths of acetone, isopropyl alcohol and water. The samples were then immersed in a 40 mL mixture of hydrogen peroxide and sulfuric acid (1:3 v/v) for 15 minutes, thoroughly rinsed with deionized water and dried with nitrogen. This surface treatment results in highly hydrophilic substrates.In order to obtain the (super)hydrophobic substrates, the substrates were left overnight in a mixture of 10 mL hexadecane, 1 mL choloroform and 133 μL of 1H-1H-2H-2H-perfluorodecyltrichlorosilane (ABCR, Germany) under Ar atmosphere. The substrates were then rinsed in chloroform and dried with nitrogen.
Graphene transfer method.
In our investigations we have used commercially-available graphene mon-olayers (Graphene Supermarket Inc. USA and Graphenea, SP) grown on copper surfaces by chemical vapor dep-osition (CVD). A ~1 cm2 as-synthesized piece of graphene-coated copper foil is floated at the surface of a diluteaqueous solution of copper etchant ((NH4)2S2O8) with graphene exposed to air (see Fig. 2a). A large solution
vol-ume (100 mL) and low etchant concentration (10−2 M) were used to promote a slow, steady etch rate (< 500 nm/h)
necessary to prevent the fragmentation of the copper foil into sub-millimeter grains, which may tear and sink the floating graphene layer. After complete dissolution of the copper foil (48–72 h), the graphene monolayer is left floating intact at the liquid-air interface. Although this process is performed in cleanroom environment, adventitious contamination on CVD-grown graphene typically provides enough reflective contrast to see the monolayer floating on the etching solution with the naked eye. The floating graphene is then carefully scooped out onto a rinsing bath of deionized water using a glass slide pre-cleaned in a mixture of hydrogen peroxide and
www.nature.com/scientificreports/
8
ScientificRepoRts | 6:24237 | DOI: 10.1038/srep24237sulfuric acid (1:3 by volume). After typically 15 minutes, the graphene layer is again scooped out of the rinsing bath using the final substrate. In the case of flat and patterned hydrophilic substrates, this step is greatly facilitated by the solution that wets the substrate completely. However, the deposition on hydrophobic substrates is more challenging because water spontaneously dewets these surfaces. We obviated this issue by adding a small amount of isopropanol (12% v/v) to the rinsing bath of distilled water thereby lowering the surface tension of the solution enough to induce complete wetting on the hydrophobic surfaces. After the transfer was completed, the samples were dried at room temperature.
Graphene cleaning procedure.
Prior to any contact angle measurements, the samples were cleaned by annealing under a Ar/H2 atmosphere. The samples were heated up to 350 °C following a ramp of 5 °C/min, undera argon flux of 300 sccm, and kept at this temperature during 4 hours with an additional flux of hydrogen (75 sccm). The oven was naturally cooled down to ambient temperature under Ar flux.
Sample characterization.
The samples were first characterized using an optical microscope (Olympus BX60) and scanning electron microscope (FIB-SEM Zeiss 1540XB). Micro-Raman spectra were acquired on a Horiba Xplora-MV2000 spectrometer. AFM characterization were performed on a Multimode 8 AFM (Bruker) in Tapping mode using OTESPA cantilevers. The contact angle measurements were performed on a Kruss DSA100 goniometer following the procedure detailed in Supplementary Section SI4.Wettability of HOPG.
The wettability of HOPG was characterized using a 10 × 10 × 1 mm HOPG (type ZYA) sample purchased from Scientec (France). The sample was exfoliated several times using a scotch tape until a flat surface was obtained. All measurements were performed on freshly exfoliated surfaces i.e. within 5 minutes after the last peeling. The obtained values were reproducible leading to θHOPG,adv = 62, 4° ± 0, 9° and θHOPG,rec = 60,2° ± 1, 1°.
When left overnight under ambient conditions, the contact angles drastically changed to reach θ HOP-G,adv = 90° ± 1°, 6° and θHOPG,rec = 51, 2° ± 1, 5°. This evolution gives a large increase of hysteresis that can be
associated to the adsorption of airborne contaminants, similar to the ones affecting measurements on graphene monolayers.
References
1. Soldano, C., Mahmood, A. & Dujardin, E. Production, properties and potential of graphene. Carbon 48, 2127–2150 (2010). 2. Nine, M. J., Cole, M. A., Tran, D. N. H. & Losic, D. Graphene: a multipurpose material for protective coatings. Journal of Materials
Chemistry A 3, 12580–12602 (2015).
3. Rafiee, J. et al. Wetting transparency of graphene. Nature Mat. 11, 217–222 (2012).
4. Shih, C.-J. et al. Breakdown in the Wetting Transparency of Graphene. Phys. Rev. Lett. 109, 176101 (2012). 5. Raj, R., Maroo, S. C. & Wang, E. N. Wettability of Graphene. Nano Lett. 13, 1509–1515 (2013).
6. Peng, S., Lohse, D. & Zhang, X. Microwetting of Supported Graphene on Hydrophobic Surfaces Revealed by Polymerized Interfacial Femtodroplets. Langmuir 30, 10043–10049 (2014).
7. Parobek, D. & Liu, H. Wettability of graphene. 2D Mater. 2, 032001 (2015).
8. Bonn, D., Eggers, J., Indekeu, J., Meunier, J. & Rolley, E. Wetting and spreading. Rev. Mod. Phys. 81, 739–805 (2009). 9. de Gennes, P. G. Wetting - Statics and Dynamics. Rev. Mod. Phys. 57, 827–863 (1985).
10. Li, Z. et al. Effect of airborne contaminants on the wettability of supported graphene and graphite. Nature Mat. 12, 925–931 (2013). 11. Kozbial, A. et al. Understanding the intrinsic water wettability of graphite. Carbon 74, 218–225 (2014).
12. Martinez-Martin, D. et al. Atmospheric contaminants on graphitic surfaces. Carbon 61, 33–39 (2013).
13. Voloshina, E., Usvyat, D., Schuetz, M., Dedkov, Y. & Paulus, B. On the physisorption of water on graphene: a CCSD(T) study. Phys. Chem. Chem. Phys. 13, 12041–12047 (2011).
14. Ambrosetti, A. & Silvestrelli, P. L. Adsorption of Rare-Gas Atoms and Water on Graphite and Graphene by van der Waals-Corrected Density Functional Theory. J. Phys. Chem. C 115, 3695–3702 (2011).
15. Kim, D., Pugno, N. M., Buehler, M. J. & Ryu, S. Solving the Controversy on the Wetting Transparency of Graphene. Sci. Rep. 5, 15526 (2015).
16. Driskill, J., Vanzo, D., Bratko, D. & Luzar, A. Wetting transparency of graphene in water. J. Chem. Phys. 141, 18C517 (2014). 17. Checco, A., Rahman, A. & Black, C. T. Robust Superhydrophobicity in Large-Area Nanostructured Surfaces Defined by
Block-Copolymer Self Assembly. Adv. Mat. 26, 886–891 (2014).
18. Li, X. et al. Large-Area Synthesis of High-Quality and Uniform Graphene Films on Copper Foils. Science 324, 1312–1314 (2009). 19. Asadi, K. et al. Up-Scaling Graphene Electronics by Reproducible Metal-Graphene Contacts. ACS Appl. Mater. Interfaces 7,
9429–9435 (2015).
20. Kim, K. S. et al. Large-scale pattern growth of graphene films for stretchable transparent electrodes. Nature 457, 706–710 (2009). 21. Kobayashi, T. et al. Production of a 100-m-long high-quality graphene transparent conductive film by roll-to-roll chemical vapor
deposition and transfer process. Appl. Phys. Lett. 102, 023112 (2013).
22. Lin, Y.-C. et al. Graphene Annealing: How Clean Can It Be? Nano Lett. 12, 414–419 (2012).
23. Wood, J. D. et al. Annealing free, clean graphene transfer using alternative polymer scaffolds. Nanotechnology 26, 055302 (2015). 24. Reserbat-Plantey, A. et al. Strain Superlattices and Macroscale Suspension of Graphene Induced by Corrugated Substrates. Nano
Lett. 14, 5044–5051 (2014).
25. Ishigami, M., Chen, J. H., Cullen, W. G., Fuhrer, M. S. & Williams, E. D. Atomic structure of graphene on SiO2. Nano Lett. 7,
1643–1648 (2007).
26. Salehi-Khojin, A. et al. Polycrystalline Graphene Ribbons as Chemiresistors. Adv. Mat. 24, 53–57 (2012). 27. Quéré, D. Wetting and roughness. Annu. Rev. Mater. Res. 38, 71–99 (2008).
28. Cassie, A. B. D. & Baxter, S. Wettability of porous surfaces. T. Faraday. Soc. 40, 0546–0550 (1944).
29. Py, C. et al. Capillary Origami: Spontaneous wrapping of a droplet with an elastic sheet. Phys. Rev. Lett. 98, 156103 (2007). 30. Patra, N., Wang, B. & Kral, P. Nanodroplet Activated and Guided Folding of Graphene Nanostructures. Nano Lett. 9, 3766–3771
(2009).
31. Israelachvili, J. Intermolecular and Surface Forces. (Academic Press, 1992).
32. Shih, C.-J., Strano, M. S. & Blankschtein, D. Wetting translucency of graphene. Nature Mat. 12, 866–869 (2013).
33. Leroy, F., Liu, S. & Zhang, J. Parametrizing Nonbonded Interactions from Wetting Experiments via the Work of Adhesion: Example of Water on Graphene Surfaces. J. Phys. Chem. C 119, 28470–28481 (2015).
34. Sforzini, J. et al. Approaching Truly Freestanding Graphene: The Structure of Hydrogen-Intercalated Graphene on 6H-SiC(0001). Phys. Rev. Lett. 114, 106804 (2015).
35. Britnell, L. et al. Field-Effect Tunneling Transistor Based on Vertical Graphene Heterostructures. Science 335, 947–950 (2012). 36. Chen, S. et al. Oxidation Resistance of Graphene-Coated Cu and Cu/Ni Alloy. ACS Nano 5, 1321–1327 (2011).
37. Berman, D., Erdemir, A. & Sumant, A. V. Few layer graphene to reduce wear and friction on sliding steel surfaces. Carbon 54, 454–459 (2013).
38. Coraux, J. et al. Air-Protected Epitaxial Graphene/Ferromagnet Hybrids Prepared by Chemical Vapor Deposition and Intercalation. J. Phys. Chem. Lett. 3, 2059–2063 (2012).
39. O’Hern, S. C. et al. Selective Ionic Transport through Tunable Subnanometer Pores in Single-Layer Graphene Membranes. Nano Lett. 14, 1234–1241 (2014).
Acknowledgements
We thank Xavier Bouju (CEMES-CNRS) and Mathias Rapacioli (LCPQ, Toulouse) for fruitful discussions. This study has been partially supported through the Laboratory of Excellence NEXT (grant n° ANR-10-LABX-0037) in the framework of the “Programme des Investissements d’Avenir”. M.N. acknowledges the government of Andorra for a PhD fellowship. A.C. acknowledges financial support by NEXT through a Senior Guest Fellowship. Research carried at Brookhaven National Laboratory is supported by the U.S. Department of Energy, Office of Basic Energy Sciences, under Contract No. DE-SC0012704 and used resources of the Center for Functional Nanomaterials, which is a U.S. DOE Office of Science Facility.
Author Contributions
T.O. and A.C. designed the research. V.T., T.O. and A.C. fabricated the suspended graphene samples and performed contact angle measurements. M.N. and E.D. developed the graphene transfer, annealing and characterization methods. C.T.B. and A.R. fabricated the nanopatterned substrates. T.O., A.C. and E.D. drafted the manuscript. All authors reviewed and approved the manuscript.
Additional Information
Supplementary information accompanies this paper at http://www.nature.com/srep Competing financial interests: The authors declare no competing financial interests.
How to cite this article: Ondarçuhu, T. et al. Wettability of partially suspended graphene. Sci. Rep. 6, 24237; doi: 10.1038/srep24237 (2016).
This work is licensed under a Creative Commons Attribution 4.0 International License. The images or other third party material in this article are included in the article’s Creative Commons license, unless indicated otherwise in the credit line; if the material is not included under the Creative Commons license, users will need to obtain permission from the license holder to reproduce the material. To view a copy of this license, visit http://creativecommons.org/licenses/by/4.0/
Wettability of partially suspended graphene
Thierry Ondarçuhu,
1*Vincent Thomas,
1Marc Nuñez,
1Erik Dujardin,
1Atikur Rahman,
2Charles T. Black,
2and Antonio Checco,
3*1
Nanosciences group, CEMES-CNRS, 29 rue Jeanne Marvig, 31055 TOULOUSE (France)
2
Center for Functional Nanomaterials, Brookhaven National Laboratory, Upton, NY , 11973
(USA)
3
Condensed Matter Physics and Materials Science Department, Brookhaven National
Laboratory, Upton, NY 11973 (USA)
Supplementary Information
SI1: Graphene wrinkles formation ………
p. 2
SI2: Characte rization of suspended graphene layers ………...
p. 3
SI3: Annealing procedure ………
p. 5
SI4: Protocol for contact angle measurements on supported graphene layers ……..
p. 7
SI5: Influence of defects ………
p. 10
SI6: Wettability of graphene multilayer and graphite..……….
p.12
References ………..……
p. 13
2
SI1: Graphene wrinkles formation
The transfer method used in this study leads to the formation of wrinkled graphene layers.
In order to get insight in the formation of the folds, we observed graphene layers during all
steps of the process. The pattern of folds is not correlated to the grain boundaries of the
copper foil supporting the graphene layer at the initial stage. Moreover, PMMA-assisted
transfer of the same graphene sample did not show the presence of any wrinkle, indicating
that the folding occurs latter in the process. Indeed, it was observed that the graphene layer is
already folded when lying at the liquid interface (see Fig SI1) showing that folds do not result
from the drying of the liquid layer on the substrate. The wrinkling therefore occurs at the
liquid interface, due to surface tension effects when the copper foil is etched away. Indeed,
the first millimeter in the periphery of the graphene layer is fully crumpled which is useful to
visualize the graphene sheet floating at the liquid interface.
Fig SI1: Optical micrograph of a graphene layer floating on a liquid film above a hydrophilic
flat SiO
2substrate. Colors are due to interference fringes in the thin liquid film. Black
The partially supported graphene layers were characterized by SEM and AFM. The
patterns of folds present the same characteristics as the ones observed on flat substrates. They
are clearly evidenced in the images (see Fig. SI2a, SI2c and SI2d), together with the holes in
the layer. The main difference with flat substrates lies in the occasional presence, on
patterned substrates, of short cracks that propagate following the paths between posts (see
Fig. SI2b). For substrates with conical texture (𝜙 < 15%), the density of defects may
increase significantly and reach 8% for the sharper surface used (𝜙 = 6 %) as shown in Fig.
SI2e.
4
Fig SI2: (a) SEM image of a graphene monolayer deposited on a substrate with nailhead
posts (for better contrast the sample was tilted by54°). (b) SEM image on an area where the
layer presents some cracks following the pillars pattern. (c) Large scale AFM image of a
partially suspended monolayer where holes and folds are clearly visible. (d) Zoom on a flat
area. (e) SEM image of a graphene layer deposited on a substrate with conical texture
(𝜙 = 6%). The contrast was enhanced to visualize the holes in the layer which appear bright
in the image and represents 8% of the total area.
Prior to any contact angle measurements, the samples were cleaned by annealing under a
Ar/H
2atmosphere. The samples were heated up to 350 °C following a ramp of 5°C/min,
under a argon flux of 300 sccm, and kept at this temperature during 4 hours with an
additional flux of hydrogen (75 sccm). The oven was naturally cooled down to ambient
temperature under Ar flux. Even though the optical imaging reveals the removal of some
black particles already present on the copper foil, the effect of the annealing process on the
graphene quality was further assessed by high resolution TEM (HR-TEM) on graphene layers
deposited using the resist-free procedure on TEM grids. The images before and after
annealing are reported on Fig. SI3a-b together with diffraction patterns. No structure is
visible before annealing whereas the crystalline structure of the graphene clearly shows up in
the TEM micrographs and diffraction after treatment, demonstrating the efficiency of the
Ar/H
2annealing.
Fig SI3: HRTEM image and diffraction pattern (inset) of a graphene monolayer: (a) before
annealing; (b) after annealing; (c) Raman spectrum of a supported graphene layer.
6
Micro-Raman spectra were acquired on a Horiba Xplora-MV2000 spectrometer in a 1-
m
focal spot area exempt of visible wrinkle (Figure SI3c). Two intense peaks are recorded at
1580 cm
-1and 2670 cm
-1that correspond to the G and 2D bands of graphene respectively.
Two weaker peaks at 1330 cm
-1and 2450 cm
-1are the first order D band and the second order
D+D" band,
1,2which characterize defects in the layer. The areal ratio of the 2D and G bands
(
𝐴2𝐷𝐴𝐺