The following document is a pre-print version of:
Macorps E, Graettinger AH, Valentine GA, Ross P-S, White JDL, Sonder I (2016) The effects of the host-substrate properties on maar-diatreme volcanoes: experimental evidence. Bull. Volc. 78:1-12
The effects of the host-substrate properties on maar-diatreme volcanoes:
experimental evidence
Élodie Macorps1, Alison H. Graettinger2, Greg A. Valentine2, Pierre-Simon Ross3, James D. L. White4, Ingo Sonder2
1School of Geosciences, University of South Florida, 4202 E Fowler Ave, Tampa, FL 33620, USA
2Department of Geology and Center for Geohazard Studies, State University of New York, 411 Cooke Hall, Buffalo, NY 14260, USA
3Institut National de la Recherche Scientifique, Centre Eau Terre Environnement, 490, Rue de la Couronne, Québec, Québec G1K 9A9, Canada
4Geology Department, University of Otago, P.O. Box 56, Dunedin 3054, New Zealand Corresponding author: [email protected]
Abstract
While the relationship between the host-substrate properties and the formation of maar-diatreme volcanoes have been investigated in the past, it remains poorly understood. In order to establish the effects of the qualitative host-substrate properties on crater depth, diameter, morphological features and subsurface structures, we present a comparison of four campaigns of experiments that used small chemical explosives buried in various geological media to simulate the formation of maar-diatremes. Previous results from these experiments have shown that primary variations in craters and subsurface structures are related to the scaled depth (physical depth divided by cube root of blast energy). Our study reveals that single explosions at optimal scaled depths in stronger host-materials create the largest and deepest craters with steep walls and the highest crater rims. For single explosions at deeper than optimal scaled depths, the influence of material strength is less obvious and nonlinear for crater depth, and nonexistent for crater diameter, within the range of the experiments. For secondary and tertiary blasts, there are no apparent relationships between the material properties and the crater parameters. Instead, the presence of pre-existing craters influences the crater evolution. A general weakening of the materials after successive explosions can be observed, suggesting a possible decrease in the host-substrate influence even at optimal scaled depth. The results suggest that the influence of the host-substrate properties is important only in the early stage of a maar-diatreme (neglecting post-eruptive slumping into the open crater), and decreases as explosion numbers increase. Since maar-diatremes reflect eruptive histories that involve tens to hundreds of individual explosions, the influence of initial substrate properties on initial crater processes could potentially be completely lost in a natural system.
Key words: maar, diatreme, substrate, crater, morphology, phreatomagmatic Introduction
Phreatomagmatic eruptions, driven by explosive interaction of magma and externally derived water, are the most dangerous eruptions in monogenetic volcanic fields (White and Ross 2011), and often also occur during the lifetimes of polygenetic volcanoes. When explosions occur in the subsurface due to interaction of magma with groundwater, the phreatomagmatic explosions result in the formation of maar-diatreme volcanoes, which are the second most abundant type of sub-aerial volcanic landforms on Earth after scoria cones (Wohletz and Heiken 1992). On the surface, maar-diatreme volcanoes comprise a deep crater cutting into the pre-eruptive ground along with its surrounding tephra (ejecta) ring. Beneath the crater in the subsurface, a diatreme
structure extends downward as a cone-shaped body of fragmented country rocks, juvenile materials and magmatic intrusions (Lorenz 1973, 1986; White and Ross 2011 and references therein). Maar-diatremes are an end-member type of explosive volcanic depression (Palladino et al. 2015), formed by discrete subsurface explosions that brecciate and eject country rock and juvenile material onto their tephra rings. Although maar-diatremes also typically have important components of subsidence due to explosion processes (e.g., Sweeney and Valentine 2015) and diatreme fill compaction, they are distinguished from explosive calderas, which form almost entirely by subsidence due to magma withdrawal with only minor components of country rock ejection. Understanding explosion processes
that form maar-diatreme volcanoes is crucial to improving the forecasting of such volcanic activity.
The variability in the geological settings in which maar-diatremes are found has been discussed in the past in terms of host-rock (substrate) hardness and water availability (Lorenz 2003; Auer et al. 2007; Ross et al. 2011). Two end-member types of substrates are often described: (1) Hard rock substrates, which are cut by fault and joint sets that can be hydraulically active, but with low matrix permeability such as well-consolidated sediments (e.g. limestone), or plutonic basement. As water runs in hard rocks through the structural weaknesses, the groundwater flow will depend on the orientation of the fractures relative to the stress field (Singhal and Gupta, 2010). (2) A soft rock substrate implies unconsolidated sediments or volcaniclastic deposits that can be water-saturated up to, or close to, the surface. Poor cementation of clay-poor coarser sediments results in a high matrix permeability. Auer et al. (2007) propose a conceptual model to distinguish ‘hard’ versus ‘soft’ maar-diatremes. The model compares a hard-substrate system that produces a steep-sided and cone-shaped diatreme, enlarged and filled with brecciated materials, to a soft-substrate system yielding a broad or bowl-shaped diatreme structure, enlarged and filled by substrate collapse due to substrate liquefaction during explosions (Auer et al. 2007).
Studies of some natural maar-diatreme systems, however, are inconsistent with the simple model of Auer et al. (2007). For example, Delpit et al. (2014) contend that the sub-vertical margins and the large diameters of the deep diatremes in the Missouri River Breaks volcanic field are geometric characteristics typically associated with ‘hard’ substrates, even though the diatremes were actually emplaced into dominantly unconsolidated sediments. Concepts of hard versus soft substrate maar-diatremes are based largely on geological inferences, and there is a need to test the concepts experimentally. Taking into account the influence of the substrate on phreatomagmatic eruptions and the formation of maar-diatremes can help to better assess the potential hazards related to the emplacement of such volcanic edifices based on the geological settings. More specifically the area, in both lateral and vertical directions that can be affected by crater excavation is expected to be dependent on the substrate strength. Here we assess experimental meter-scale craters that were produced by chemical explosions in geological media with variations in substrate cohesion and permeability, allowing qualitative comparison with natural examples (Fig 1). The experiments reflect an immediate post-eruption structure, with proportions of crater diameter to subsurface structure depth similar to that of a natural maar-diatreme system as a whole. However, the resulting structures do not include additional modification by sediment infill and non-eruptive collapse. This series of experiments
is used here to evaluate the hypothesis that the host-substrate in which maar-diatreme-forming explosions occur exerts a significant influence on the resulting maar-diatreme volcanoes.
Methods
Experiment setups
We compare the results of experiments conducted in four campaigns from 2012 to 2014. The experiments consisted of shallow-buried explosions (blasts) into layered granular media (pads), in order to mimic the effects of discrete explosions, resulting in the formation of a crater and its subsurface structure. The reader is referred to Ross et al. (2013), Graettinger et al. (2014), and Valentine et al. (2012, 2015), for a detailed description of the experiments, and Valentine et al. (2014) for information on energetics of phreatomagmatic explosions in forming maar-diatremes. The blasts were performed using chemical explosives of known size and energy density, emplaced at defined scaled depths (scaled depth Dsc = d · E-1/3, where d is the physical depth (m)
of a charge and E is the explosion energy in Joules), which designates the relation between depth of burial and charge energy (Goto et al. 2001; Sonder et al. 2015). The charges were emplaced within layers of material with varying or similar competence (Fig 2). Over the four campaigns, the pads can be combined into two distinct sets. All pads within a set have the same explosion configurations (i.e. depth of the charge and energy), but variable host-substrate conditions. Thus, we can distinguish: (1) Set 1 with Pads 2012P1B1, 2013aP1B1, 2013bP1B1 and 2013bP3B1 experiencing a single one pound (0.454 kg) charge explosion at 50 cm below the initial pad surface, hence at a scaled depth of Dsc = 0.0038 mJ -1/3, and (2) Set 2 with Pads 2012P3B1-3, 2013aP3B1-3 and 2014P4B1-2013aP3B1-3 experiencing three successive explosions of 1/3-pound (150 g) charges each at 50 cm below the surface (defined by the previous crater floor for Blasts 2 and 3 at each pad), each at a scaled depth of Dsc = 0.0055 mJ-1/3. In this way, all pads experienced the same final cumulative explosion energy. The explosions in Set 1 and each first blast of each experiment in Set 2 are considered as primary blasts because they occurred through undisturbed host-substrate, with a flat pad surface. The position of the charge in pads from Set 1 is such that each primary explosion occurred at optimal scaled depth conditions where the largest crater for that charge energy should be formed. For pads from Set 2, all explosions occurred deeper than optimal scaled depth where more energy was lost to the host substrate. The results from the first blast in Pad 2013bP2B1 were also added to Set 2 because that experiment had the same settings as the other primary blasts in this set. For simpler presentation here, we have renamed each pad with the number of its respective set, and one letter from ‘a’ to ‘d’ in chronological order (i.e. Pad
2012P1 is the first pad in Set 1, therefore renamed as ‘Pad 1a’).
Substrate strength
Substrate conditions varied within individual sets due to variations in the materials or weather conditions (Fig 2). Thus, the differences in the resulting craters and subsurface structures can be analyzed and interpreted in terms of effects of the host-substrate characteristics (Table 1). Qualitative substrate strength is based on the specific conditions of the materials for each individual pad. Because in situ, the strength of granular materials such as the one used in these experiments is very difficult to assess, samples of material were collected on site and then analyzed in laboratory for moisture content and density as a way to qualitatively estimate the substrate strength of each individual pad. In Pad 2d, the substrate showed large heterogeneities in the material competence because it was poorly compacted and generally weak relative to the other pads, which contained a resistant layer and were mechanically fully compacted. In Pads 1a and 2a the top layer of crushed asphalt had stronger grain cohesion because it softened under hot temperatures (c. 28-30°C) during the days preceding the experiments. This resulted in stickiness and agglutination of the asphalt particles into large clusters of up to 30 cm. In Pads 1c and 2c, the materials experienced a large increase in moisture content, to 13.3 wt. % and 7.0 wt. % respectively, when subjected to heavy rainfall conditions. Moisture contents were calculated from the mass of wet samples of pad materials from the day of the experiments and compared to the dry mass of the same sample in laboratory. Pad 1d had a frozen surface because the weather was cold (c. -2°C) and the pad had a significant moisture content (i.e. 3.9 wt. %). As emphasized by Hornbaker et al. (1997), the mechanical behavior of dry granular materials changes if even a small amount of liquid is added, with addition of up to 17.0 wt. % in sand materials producing additional apparent cohesion (Coulomb 1773; Fredlund et al. 1978; Kim 2001; van Mechelen 2004). This increase in cohesion of under-saturated moist sand (pendular state) is due to the presence of capillary forces that lead to interstitial liquid forming liquid bridges at contacts between grains (van Mechelen 2004). Thus, the cohesion of our experimental pads was higher in Pads 1c, 1d and 2c as a result of increased moisture content, and was further increased by the poor sorting of the materials. The surface tension increased with decreasing temperature due to the decreasing intermolecular distances in the liquid (which was the case in Pad 1d), which further increased its strength.
Measurements
Two orthogonal topographic profiles were measured after each blast along the same profile
lines, providing quantitative information on the resulting crater dimensions (i.e. diameter, depth, rim height, wall steepness). In Table 1, values of the different crater dimensions were averaged from both orthogonal topographic profiles for each pad and blast. Probe profiles along the same lines were made using a graduated pole that was manually pushed into the pad until the users felt a significant increase in the material strength. This allowed us to determine semi-quantitatively the structure of the disrupted zone in the subsurface. Finally, at the end of the experiment series, the pads were excavated with the exception of pads from the fall of 2013 (i.e. Pads 1c, 1d and 2c). During excavation we progressively cut cross sections through the pads every 10 to 30 cm to the center of the crater in order to observe the subsurface structure beneath the crater in three dimensions. The visible subsurface disruption of the final structure was traced using field observations and photographs for comparison with the probe profiles. During the first year’s experiments, the thicker layers made the visual distinction between fallback and fresh layers difficult, but their softness compared to the mechanically compacted layers made this distinction possible with the probe. Measurements of the structure height, width and depth, as well as the structure-wall dips were performed using the basic line and angle measurement tools on photographs in the Image J software (http://imagej.nih.gov/ij). The structure height-to-width ratios H/W (Table 1) were further computed using these measurements. Pad 2d was too weak to obtain useful probe profiles because the pole repeatedly penetrated to the bottom of the pad, so for Pad 2d we focus on the visible disruption profile. Crater depth and morphology
Set 1 – optimal scaled depth configuration
We compare crater depths and morphologic parameters, specifically crater wall steepness and rim height (i.e. the top part of the crater wall that constitutes a positive topographic feature above the surface), for the different substrate configurations. All resulting craters in Set 1 were sub-circular with a conical shape and a well-defined rim, but with walls having variable depth and slope angles. The craters in Pad 1c and Pad 1d were very similar in structure and dimensions (Fig 3a). These craters were the deepest, at 45 and 47 cm from the original surface, respectively. Pad 1a and Pad 1b were 38 and 31 cm deep respectively. Pad 1c and Pad 1d also presented crater walls with an averaged slope angle of 37° and 33°. This was steeper than the more gently dipping slopes for Pad 1a and Pad 1b (24° and 22°, respectively; Table 1). Finally, Pad 1c and 1d showed the highest crater rims with heights of 14 and 12 cm from the initial surface. Pad 1a showed a 9 cm rim and Pad 1b presented the smallest rim height of 6 cm. In terms of depth, wall steepness and rim height, the pads in Set 1 can be sorted by increasing values as
1b<1a<1d<1c (Fig 4a). The greater grain cohesion for both Pads 1c and 1d discussed previously resulted in increased pad strength and the preservation of steeper, deeper craters. In Pad 1a, the intermediate depth and intermediate rim height, could be explained by the stronger top layer of crushed asphalt, as opposed to the dry and unmodified materials in Pad 1b.
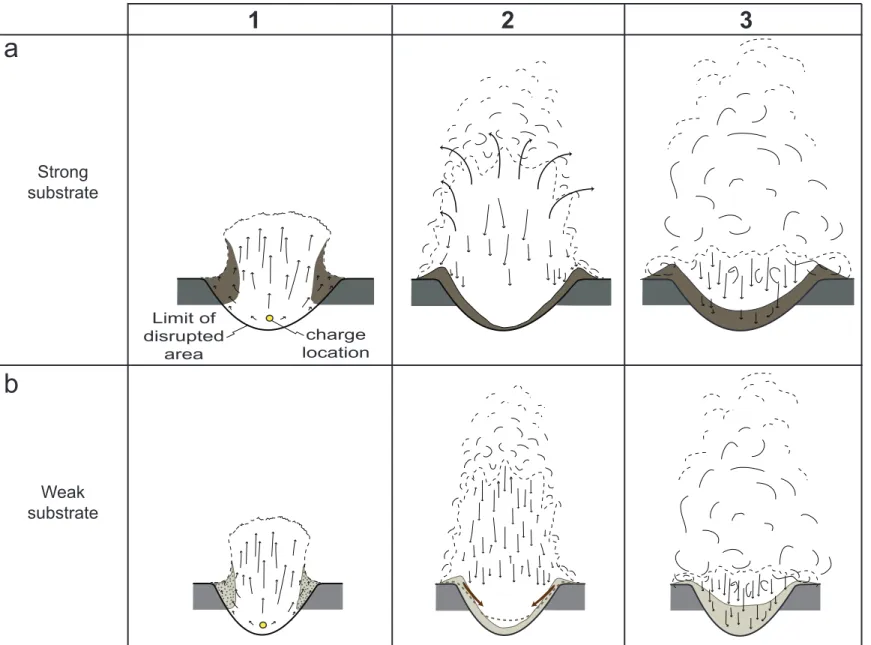
While the primary control on single-blast crater dimensions is scaled depth (Sonder et al. 2015), these results show the second-order effects of material properties. For primary explosions at optimal scaled depth into strong materials, the resulting craters are deeper, with steeper walls and higher rims. This can be explained by variation in slumping structures associated with the material strength - slumping occurs as an immediate process of explosion and with deposition during jet collapse. As the eruptive jet forms, the particles are entrained upward, excavating a transient crater. In the case of weak particle cohesion, those particles that are not directly entrained into the jet can slump toward the center of the crater. Thus, in case of a stronger substrate, the stiffness of the material reduces or eliminates slumping of the walls towards the center of the crater during the explosion, maintaining a high crater rim at the top of the crater walls. Conversely, when explosions occur in a weaker substrate, the slumping of the walls immediately partly fills in the crater, decreasing its depth, rim height, and the slope angle of the walls.
Set 2 – non-optimal scaled depth configuration
In Set 2, three successive blasts are considered in terms of crater depth and crater rim variations. Each blast occurs at deeper than optimal scaled depth conditions. The primary blast for Pads 2a and 2c in this series produced a poorly defined and shallow depression with maximum depth of 8 cm in Pad 2a, and 4 cm in Pad 2c. Both pads were surrounded by subdued rims of irregular height. The depressions were largely filled with hummocky structures composed of fallback from the eruptive jet. In Pad 2b, the fallback concentrated into one central location, forming a positive topographic mound, called a retarc, that was ~26 cm high in a 6 cm-deep depression (Graettinger et al. 2014). In contrast, the crater produced in Pad 2d was a conical-shaped and sub-circular crater 32 cm deep (Table 1 and Fig 3b). In Pad 2c, the rim was ~14 cm high and irregularly formed, consisting of large angular, semi-coherent clods of host material. These clods also occurred in the crater resulting in angular hummocks. In Pad 2d, the well-defined rim was of variable height which averaged ~7 cm.
For Blast 1 (the first blast in each sequence at a particular pad), the stronger substrate in Pad 2c did not result in the deepest crater (Table 1, Fig 4a), however, it did have a high crater rim with a steep inner slope of ~68°. The clods of ejecta, due to
cohesion of the particles under more coherent host-material, resulted in a larger quantity of material amongst the fallback and in the very proximal deposits, without significant proportions of ejecta beyond the crater rim. Thus, it led to increased height of the crater rim and decreased depth of the depression. Furthermore, the angular shape of the clods constituting the rim increased its apparent slope toward the depression pit. The distinct variation in crater depth between Pad 2d and the other pads in Set 2 (Table 1, Fig 4a) is due to the volume of fallback in the crater. The volume of fallback returning to the crater is a result of the confining pressure on the explosion site, which is a function of charge depth, substrate density and material cohesion, and therefore the amount of energy diffused by the host-substrate (Valentine et al. 2014; Graettinger et al. 2015; Sonder et al. 2015). However, this relationship does not appear to be linear with material density (see Table 1). Due to the limited number of experiments, it is difficult to distinguish the influence of substrate strength versus that of density. The variation in crater rim height and wall steepness, however, did appear to correlate with the material strength as was observed for pads in Set 1.
The discussion of the second and third explosions in Series 2 pads will focus on Pads 2a, 2b and 2d because of the different settings for Pad 2c. The craters resulting from Blast 2 in Pads 2a, 2b and 2d were sub-circular and conical-shaped with a hummocky rim of ~15 cm in Pad 2a and well-defined rims of 15 and 9 cm in Pad 2b and Pad 2d, respectively. The crater walls in Pad 2a and Pad 2b had a shallow slope angle (Table 1) with the upper 2 cm nearly vertical in Pad 2b (this is not obvious on Fig. 3 because the horizontal distance between measurements on the topographic profile was 10 cm). Pad 2d had steep upper walls with a slope of ~54° and then a shallower slope angle of ~39° due to slumping structures nearer the center of the crater. At all three craters after the second blast there was an increase in depth (Table 1, Fig 4a), with the greatest total depth (crater depth from the highest point on the rim) for Pad 2d. However, Pads 2a and 2b experienced a greater increase in depth of 20 and 18 cm (Fig 4a), respectively, with higher crater rims. The variability in depth increase from the second blast is due to the variability in the pre-existing craters. The presence of a crater before an explosion has been proven to influence the jet shape which affects proximal deposition and fallback (Taddeucci et al. 2013; Graettinger et al. 2014). The pre-existing crater walls limit initial lateral expansion of the jet, resulting in a lower and more vertically focused jet and thus more fallback in case of blasts deeper than optimal scaled depth (Graettinger et al. 2015). This explains the smaller increase in crater depth for Pad 2d, which already had a well-developed crater after Blast 1. The presence of hummocks in Pad 2a and retarc in Pad 2b before Blast 2 have the inverse
effect, resulting in very wide jet angles and thus more dispersion of ejecta and a greater increase in crater depth.
After the third blast, all three craters (2a, 2b and 2d) showed a decrease in depth (Table 1, Fig 4a) due to accumulation of hummocky deposits resulting from fallback of material into the crater from the vertically-focused jet. The final craters in Pad 2a and Pad 2d were similar with sub-circular to circular shapes and hummocky floors that caused the deepest point to be offset relative to the charge epicenter. The craters had similar depths (24 cm in Pad 2a, 25 cm in Pad 2d). In Pad 2b, the shallow crater of 18 cm was sub-circular in shape. In Pad 2d, the greater decrease in the crater depth (~14 cm) may indicate a larger volume of fallback compared to Pad 2a and Pad 2b (~4 to 6 cm depth decrease). The crater in Pad 2a was surrounded with a hummocky rim 10 cm higher than the well-defined rim in Pad 2d (7 cm). The crater rim in Pad 2b was well defined and 14 cm high. The higher crater rims in Pad 2a and Pad 2b suggest a volume of proximal ejecta greater than the volume of direct fallback. All three craters had evidence of slumping structures toward the center of the crater and walls had shallow slope angles (Table 1). However, the steep upper 15 cm of the walls in Pad 2d associated with the shallowest lower wall slope angle are evidence of more slumping relative to other pads. This suggests a general weakening of all pad substrates following explosions, with weaker materials in Pad 2d resulting in more intense slumping of the walls toward the crater, significantly decreasing its depth.
The positive correlation between crater depth and host-material properties observed in primary optimal scaled depth explosions does not appear to extend to deeper-than-optimal scaled depth primary blasts (Fig 4a). Elements of crater morphology other than depth, such as rim height and wall steepness do, however, seem to correlate with the host-material strength of primary blasts at deeper than optimal scaled depths. For secondary and tertiary blasts at deeper than optimal scaled depths, these relationships with host-substrate properties do not hold (Fig 4a). The evolution of the crater depth and morphology after Blasts 2 and 3 is driven by the jet behaviors, which are influenced by the shape of the pre-existing crater. In addition, the slumping structures seen after Blast 3 suggest a general weakening of the pads’ host-substrate in response to the explosions. Observations from these experiments suggest that even at optimal scaled depths, successive explosions in a strong substrate would decrease the effects of the original host properties on crater morphology by weakening the substrate materials. The degree of substrate weakening would be, smaller for an already weak substrate, and potentially greater in a harder substrate.
Crater diameter
Set 1 – optimal scaled depth configuration
Crater diameter is another parameter that varies as a result of explosions in similar configuration but differing host materials, suggesting a possible influence of host-substrate properties. In Set 1, Pad 1d had the largest crater of 207 cm diameter, while Pad 1a and Pad 1c showed smaller diameters of 192 and 193 cm, respectively. Pad 1b presented the smallest diameter crater (170 cm). The relative amount of increase in crater diameters (1b<1a<1c<1d) correlates with increasing strength of the pad materials, revealing a positive relationship between the host-substrate strength and the resulting crater diameter for primary explosions at optimal scaled depth conditions (Fig 4b).
Set 2 – non-optimal scaled depth configuration
In Set 2, the crater diameter evolution is more complex. After the first blast, Pad 2b had the largest depression, 180 cm in diameter with a retarc. Pad 2c and 2d had similar diameters of 140 cm and 136 cm, but Pad 2c was a hummocky depression, while 2d was a conical crater. Pad 2a had the smallest diameter, 132 cm, and hummocky topography. The crater diameter formed by primary blasts in Set 2 shows no correlation with increasing material strength or density in these experiments (Table 1, Fig 4b). After the second blast, the crater diameters in Pad 2a and Pad 2d increased 36% and 2%, respectively, whereas the crater in Pad 2b showed a 22% decrease in the diameter. After the third blast, the craters in Pad 2b and Pad 2d increased 11% and 7% in diameter, whereas diameter of the crater in Pad 2a decreased by 1%. The observed decrease in crater diameter in Pad 2b Blast 2 and Pad 2a Blast 3 can be considered a result of the topography present before each explosion. Blast 2 in Pad 2b occurred through a retarc in a depression, and excavation of a new crater resulted in a diameter crater smaller than that of the initial depression. On the other hand, Blast 3 in Pad 2a occurred within a pre-existing crater, but the deposition of fallback partially filled the crater and resulted in a decrease in crater diameter. That is, a negative change in crater diameter is possible through either excavation or deposition in multi-blast systems. The change in diameter was observed to be more dependent on the configuration of material within the crater before a blast, which is a result of explosion history, than to original host material strength.
To summarize, for primary explosions at optimal scaled depths, the crater diameter seems to correlate positively with the strength of the host-substrate (Fig 4b). Better particle cohesion in stronger substrates is responsible for a larger amount of material excavation during an explosion, and thus produces a larger-diameter crater diameter, within the range of properties in our experiments. For primary and successive explosions deeper than optimal
scaled-depth, however, there is no apparent relationship between host-substrate strength, or density, and crater diameter (Fig 4b). The variations in crater diameter that were observed were predominantly controlled by scaled depths and by the explosion sequence, and any control on crater diameter by original host substrate properties appears to have been subordinate to those of scaled depth and crater morphology.
Subsurface structure
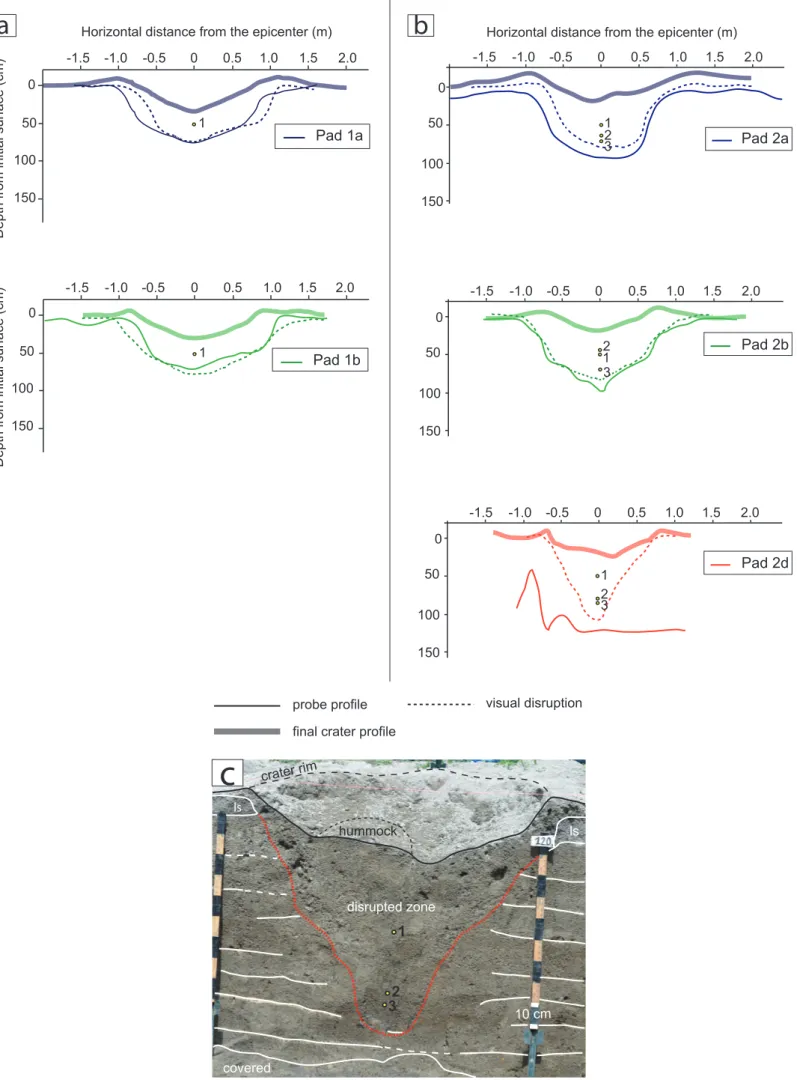
The margins of the subsurface structure are defined as the limit of the area where the originally-horizontal layering was disrupted. The subsurface structures of Pad 1a and Pad 1b were produced by only one explosion, whereas for Pad 2a, 2b and 2d the structures were the result of three successive blasts. All of the probe profiles show a similar pattern of the subsurface structures (Fig 5): a disrupted zone that is broader than the crater near the surface (see final crater profiles in Fig 5) and decreases in width toward the bottom of the pad. In our experiments, the probe profiles for all of the pads indicate a disrupted zone below the deepest charge locations. The subsurface structures in Pad 1a, Pad 1b, Pad 2a and Pad 2b were produced in substrates of multiple differing layers and show high similarities in shape and dimensions (Fig 5a and 5b). The profiles for Pads 1a and 1b show similar shallow dips of the structure walls (~42° and ~41°) and disruption to similar depths of ~75 cm below the original pad surface (Fig 5a). In addition, the width ratios of the structures appear to be very similar (Table 1). In Pads 2a and 2b the profiles indicate similar slopes (~50° and ~49°), as well as similar depths of ~95 cm (Fig 5b). In Pad 2d, the visible disruption profile shows a steeper (~58°) and deeper structure, up to ~110 cm, than do Pads 1a, 1b, 2a and 2b. The dips structure walls in pads from Set 2 are generally steeper than in Pads 1a and 1b. The width ratios also indicate a narrower structure in Pad 2d (Table 1). The visible disruption in all of the pads shows similar subsiding “collars” of materials, i.e., downward warping of layers at the edge of the subsurface structure (Fig 5a and 5b). In contrast, the inner parts of the subsurface structures differ between pads with multiple layers versus pads composed of a single material. In Pads 1a, 1b, 2a and 2b, the inner part allows distinction between mixed fallback upper and domainal lower deposits associated with an upward movement of materials from the deeper layers. In contrast, the inner part of Pad 2d had a quite massive texture, increasing in porosity upward through the upper fallback deposits. In Pad 2d, the structure of the visible disruption presented in Fig 5c is quite similar to what could be expected and interpreted for a ‘natural’ small maar-diatreme (e.g. Miyakejima example in Geshi et al. 2011; Graettinger et al. 2014).
The subsurface structures for pads within each set are similar, but the depth and slope angles vary between the two sets. The deepest level of disruption corresponds to the deepest charge location within an experimental pad (Fig 5). Thus, the subsurface structures in Set 2 are deeper because final explosion sites lay at greater depths than in Set 1 (Fig 5, see charge locations). The steeper dips of structure walls from Set 2 as opposed to Set 1 can be explained by smaller charge energy for each of the three blasts, resulting in a narrower disrupted area after each blast and greater total depth. The narrower structure in Pad 2d could be related to the energy dissipation as a function of pad strength. As the substrate was weaker in Pad 2d, the weak interactions between particles resulted in higher energy dissipation through local shear along particle contacts rather than dispersion and propagation of stresses through a network of contacts (Zhao et al. 2008), and resulted, therefore, in a narrower disrupted area. Thus, there could be a host-material strength control on subsurface structure formation, but in our experiments it was subordinate to the effects of scaled depth and charge history. In terms of general subsurface structure, the similarities between pads within each set suggest that there is limited influence of the host substrate.
Discussion and conclusions
The scaled depths of explosions, and, for multi-blast systems, the developing surface topography, are the dominant controls on crater morphology and subsurface structures (Sonder et al. 2015). They control eruptive jet behavior and consequently the ejecta distribution and proportion (Valentine et al. 2012; Graettinger et al. 2014, 2015). Nevertheless, the host substrate does have an influence on crater morphology for primary blasts. This is most obvious for optimal scaled depth explosions where crater diameter, depth and slopes are influenced by material properties. The main substrate property involved is the strength of materials, addressed here through the apparent cohesion (i.e. intergrain attraction forces) and presence or absence of adhesive surface forces (i.e. water-grain attraction forces). As the strength of the host-substrate increases, syn-“eruption” slumping processes tend to be reduced due to better cohesion between the particles. A larger amount of particles are entrained within the jet, while cohesion maintains the walls and reduces or prevents slumping. This results in deeper craters with steeper walls and higher rims (Fig 6a). Conversely, as the strength of the substrate decreases, less particulate material is excavated while the crater wall materials tend to slump and fill in the crater, decreasing its depth (Fig 6b). Similar process can be associated with crater diameter variations for primary blasts, where a better particle cohesion leads to greater excavation and thus larger craters (Fig 6).
For explosions deeper than optimal scaled depth, the primary-blast results suggest that the differences
in crater depth can be attributed to variations in the volume of fallback, which is related to the combined effects of confining pressure (a function of charge’s depth and density of the host) and material strength, which controls the amount of energy diffused through the host-substrate (Sonder et al. 2015). In our results from primary blasts deeper than optimal scaled depth, it is difficult to distinguish the influence of material strength from that of host density. For rim height and ejecta size and angularity, we found small effects of the material strength. The diameters of craters excavated by blasts set deeper than optimal scaled depth are not correlated with the pads’ substrate properties.
These relationships are only observed, however, in primary explosions through undisturbed substrate and flat initial ground. For secondary and tertiary blasts, a general weakening of the host substrate due to the succession of explosions is apparent. There is no evidence that the host substrate properties influence cratering after the second blast. The crater depth and morphology seem to be predominantly controlled by the scaled depth and the pre-existence of craters that control jet behavior and ejecta distribution (Graettinger et al. 2014, 2015). Pre-existing craters tend to vertically focus the jet, resulting in more fallback, while in contrast the presence of a hummocky crater floor or retarc prompts lateral expansion of the jet, increasing ejecta dispersion. Excavations and probe profiles of the resulting structures for single optimal scaled blast (Ross et al. 2013; Graettinger et al. 2014) indicate weakening of the substrate and therefore, it is likely that effect of the substrate strength is also decreased for successive blasts at optimal scaled depth.
To conclude, we infer that the host substrate properties can influence the crater morphology during early stages of maar-diatreme formation (i.e. proto-diatreme stage, Valentine and White 2012). As the number of explosions increases, this effect is apparently diminished because original material properties are “forgotten”, and likely would not be reflected in diatreme morphology, although the subaerial crater might be affected by slumping that is not directly related to explosion activity. This may explain why diatremes that formed in saturated, poorly consolidated sediments can have steep sides like those formed in coherent rock (e.g., Hopi Buttes, Lefebvre et al. 2013; Missouri Breaks diatremes, Delpit et al. 2014; Mardoux structure, Valentine and van Wyk de Vries 2014), rather than shallow-dipping sides as is sometimes inferred.
Acknowledgements
This work was supported by the INVOGE exchange program (Élodie Macorps), by the US National Science Foundation (grant EAR 1420455 to Dr. Greg Valentine), and by the University at Buffalo 3E fund. The authors thank Valerio Acocella, Karoly
Nemeth and Olivier Roche for their constructive and helpful reviews of the manuscript.
References
Auer A, Martin U, Nemeth K (2007) The Fekete-hegy (Balaton Highland Hungary) “soft-substrate” and “hard-substrate” maar volcanoes in an aligned volcanic complex–Implications for vent geometry, subsurface stratigraphy and the palaeoenvironmental setting. J
Volcanol Geotherm Res 159:225-245.
doi:10.1016/j.jvolgeores.2006.06.008
Coulomb CA (1773) Sur l’application des règles de maximis et minimis à quelques problèmes de statique, relatifs à l’architecture, in Mémoires de mathématiques et de physique, vol. 7. Académie Royale des Sciences de Paris, Paris, pp 343-382
Delpit S, Ross P-S, Hearn BC (2014) Deep-bedded ultramafic diatremes in the Missouri River Breaks volcanic field, Montana, USA: 1 km of syn-eruptive
subsidence. Bull Volcanol 76:832. doi:
10.1007/s00445-014-0832-8
Fredlund DG, Morgenstern NR, and Widger RA (1978) The shear strength of unsaturated soils. Can Geotech J. 15:313-321
Geshi N, Németh K, Oikawa T (2011) Growth of phreatomagmatic explosion craters: A model inferred from Suoana crater in Miyakejima Volcano, Japan. J
Volcanol Geotherm Res 201:30-38. doi:
10.1016/j.jvolgeores.2010.11.012
Goto A, Taniguchi H, Yoshida M, Ohba T, Oshima H (2001) Effects of explosion energy and depth to the formation of blast wave and crater: Field explosion experiment for the understanding of volcanic explosion. J Geophys Res 28:4287-4290
Graettinger AH, Valentine GA, Sonder I, Ross P-S, White JDL, Taddeucci J (2014) Maar-diatreme geometry and deposits: subsurface blast experiments with variable explosion depth. Geochem Geophys Geosyst 15. doi:10.1002/2013GC005198
Graettinger AH, Valentine GA, Sonder I, Ross P-S, White JDL (2015) Facies distribution of ejecta in analog tephra rings from experiments with single and multiple subsurface explosions. Bull Volcanol 77:66-78. doi:10.1007/s00445-015-0951x-
Hornbaker DJ, Albert R, Albert I, Baraba´si A-L, Schiffer P (1997) What keeps sandcastles standing? Nature 387:765
Kim T-H (2001) Moisture-induced tensile strength and cohesion in sand. Dissertation, University of Colorado, Colorado, USA
Lefebvre NS, White JDL, Kjarsgaard BA (2013) Unbedded diatreme deposits reveal maar-diatreme-forming eruptive processes: Standing Rocks West, Hopi Buttes, Navajo Nation, USA. Bull Volcanol 75:739
Lorenz V (1973) On the formation of maars. Bull Volcanol 37:183–204
Lorenz V (1986) On the growth of maars and diatremes and its relevance to the formation of tuff rings. Bull Volcanol 48:265–274
Lorenz V (2003) Maar-diatreme volcanoes, their formation, and their setting in hard-rock or soft-rock environments. Geolines 15:72-83
Palladino DM, Valentine GA, Scottili G, Taddeucci J (2015) Maars to calderas: end-members on a spectrum of explosive volcanic depressions. Front Earth Sci 3:36. doi: 10.3389/feart.2015.00036
Ross P-S, Delpit S, Haller MJ, Németh K, Corbella H (2011) Influence of the substrate on maar-diatreme volcanoes - An example of a mixed setting from the Pali Aike Volcanic Field, Argentina. J Volcanol
Geotherm Res 201:253-271. doi:
10.1016/j.jvolgeores.2010.07.018
Ross P-S, White JDL, Valentine GA, Taddeucci J, Sonder I, Andrews R (2013) Experimental birth of a maar-diatreme volcano. J Volcanol Geotherm Res 260:1-12. doi: 10.1016/j.jvolgeores.2013.05.005
Singhal BBS, Gupta RP (2010) Applied hydrogeology of fractured rocks, 2nd edn. Springer Science & Business Media, New York, pp 13-33
Sonder I, Graettinger AH, Valentine GA (2015) Scaling multiblast craters: general approach and application to volcanic craters. J Geophys Res: Solid Earth 120:6141-6158, doi: 10.1002/2015JB012018
Sweeney MR, Valentine GA (2015) Transport and mixing dynamics from explosions in debris-filled volcanic conduits: Numerical results and implications for maar-diatreme volcanoes. Earth Planet Sci Lett 425: 64-76, doi:10.1016/j.epsl.2015.05.038
Taddeucci J, Valentine GA, Sonder I, White JDL, Ross P-S, Scarlato P (2013) The effect of pre-existing crater on the initial development of explosive volcanic eruptions: An experimental investigation. Geophys Res Lett 40:507-510. doi: 10.1002/grl.50176
Valentine GA, van Wyk de Vries B (2014) Unconventional maar diatreme and associated intrusions in soft sediment-hosted Mardoux structure (Gergovie, France). Bull Volcanol 76:807
Valentine GA, White JDL (2012) Revised conceptual model for maar-diatremes: Subsurface processes, energetics, and eruptive products. Geology 40:1111-1114. doi: 10.1130/G33411.1
Valentine GA, White JDL, Ross P-S, Amin J, Taddeucci J, Sonder I, Johnson PJ (2012) Experimental craters formed by single and multiple buried explosions and implications for volcanic craters with emphasis on maars. Geophys Res Lett 39, L20301. doi: 10.1029/2012GL053716
Valentine GA, Graettinger AH, Sonder I (2014) Explosion depths for phreatomagmatic eruptions. Geophys Res Lett 41:3045–3051. doi: 10.1002/2014GL060096 Valentine GA, Graettinger AH, Macorps É, Ross P-S,
White JDL, Döhring E, Sonder I (2015) Experiments with vertically and laterally migrating subsurface explosions with applications to the geology of phreatomagmatic and hydrothermal explosion craters and diatremes. Bull Volcanol 77:1-17. doi: 10.1007/s00445-015-0901-7
Van Mechelen JLM (2004) Strength of moist sand controlled by surface tension for tectonic analogue
modelling. Tectonophysics 384:275-284. doi:
10.1016/j.tecto.2004.04.003
White JDL, Ross P-S (2011) Maar-diatreme volcanoes: A review. J Volcanol Geotherm Res 201:1-29. doi:10.1016/j.jvolgeores.2011.01.010
Wohletz K, Heiken G (1992) Volcanology and geothermal energy. University of California Press, Berkeley 432 p. Zhao Z, Liu C, Brogliato B (2008) Energy dissipation and
dispersion effects in granular media. Phys Rev E 78, 031307. doi: 10.1103/PhysRevE.78.031307
500 m
a
b
50 cm
Fig 1 a) Aerial photography of the maar-crater of Gour de
Tazenat (Massif Central, France) emplaced in a granitic
base-ment. Source: www.photo-paramoteur.com. b) Experimental
crater in Pad 1c (see Table 1) resulting from primary blast at
optimal scaled depth
30 cm
lg
ls
asph.
a
lg
cs
asph.
ls
Arag.
20 cmb
Fmix
ps
ls
10cmc
20 cmls
mix2013
d
(ls + cs + asph + lg)
e
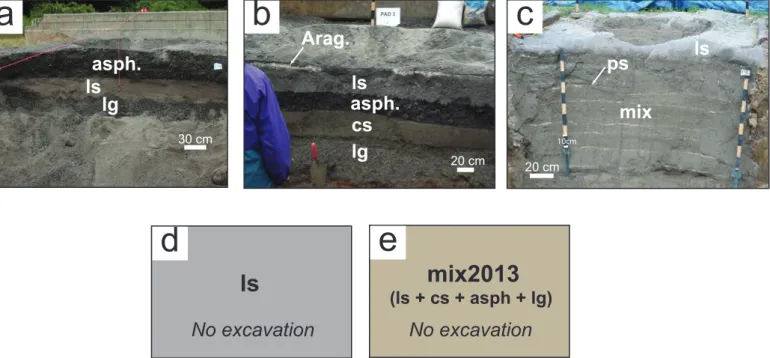
Fig 2 a) Pad substrate configuration in 2012 (i.e. Pad 1a and 2a) with 3 layers of 30 cm each mechanically
compacted. b) Pad substrate configuration in 2013a (i.e. Pad 1b and 2b) with 4 mechanically compacted layers
of 15 cm and a top loose layer of ~5 cm. c) Pad substrate configuration in 2014 (i.e. Pad 2d) with 8 layers of
~15 cm and a top layer of ~10 cm all manually built and hand-compacted, separated by thin marker layers.
Variation in thickness of the layers in Pad 2d is due to the semi-quantitative building of the pad without
mechanical compaction. d) Schematic pad substrate configuration in 2013b for Pad 1c and 2c (because there
was no excavation) with un-layered single material mechanically compacted at the end. e) Schematic pad
substrate configuration in 2013b for Pad 1d (because there was no excavation) with un-layered mixture of
materials and mechanically compacted at the end. (asph: crushed asphalt; ls: limestone screenings; lg:
lime-stone gravel; cs: concrete sand; arag: aragonite; mix: man-made mixture of concrete sand, plaster and water
in respective proportions of 10:1:2; ps: play sand marker layers; mix2013: recycled and mixed materials from
2013a)
Horizontal distance from epicenter (m) depth (cm) 0 50 0 -0.5 -1.0 -1.5 0.5 1.0 1.5
Horizontal distance from epicenter (m)
depth (cm) 0 50 0 -0.5 -1.0 -1.5 0.5 1.0 1.5
Horizontal distance from epicenter (m)
depth (cm) 0 50 0 -0.5 -1.0 -1.5 0.5 1.0 1.5
Horizontal distance from epicenter (m)
depth (cm) 0 50 0 -0.5 -1.0 -1.5 0.5 1.0 1.5
Pad 2a
Pad 2b
Pad 2c
Pad 2d
blast 3 blast 1 blast 2 blast 3 blast 1 blast 2 blast 3 Pad 1a Pad 1b Pad 1c Pad 1dHorizontal distance from epicenter (m)
depth (cm) 0 50 0 -0.5 -1.0 -1.5 0.5 1.0 1.5
a
b
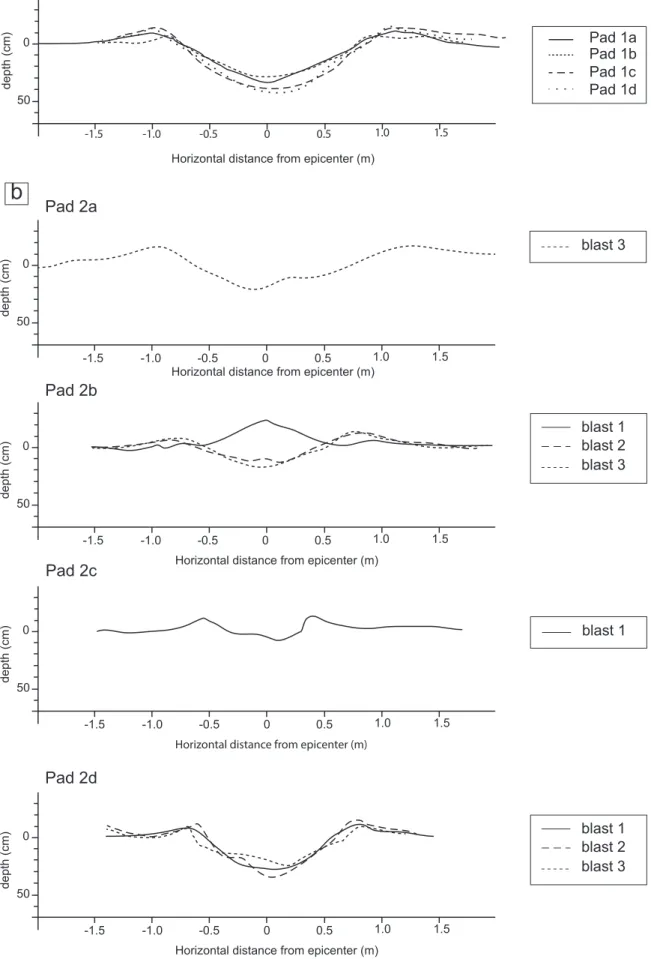
blast 1Fig 3 a) Resulting crater profiles from primary blasts at optimal scaled depths in pads
from Set 1. b) Resulting crater profiles from three successive blasts deeper than optimal
scaled depth in pads 2a, 2b and 2d, and primary blast deeper than optimal scaled depth in
Pad 2c. In Pad 2a, only the final crater profile (after blast 3) was measured. On the vertical
axis, 0 indicates the initial pre-blast surface. On the horizontal axis, 0 indicates the charge
a
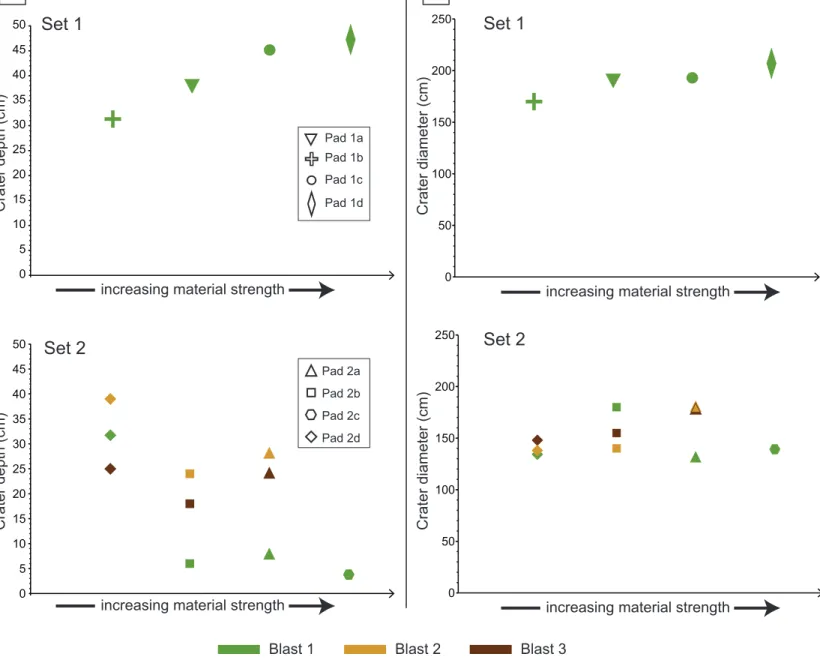
0 5 10 15 20 25 30 35 40 45 50 Crater depth (cm)increasing material strength
0 5 10 15 20 25 30 35 40 45 50 Crater depth (cm)
b
0 50 100 150 200 250 Crater diameter (cm) 0 50 100 150 200 250 Crater diameter (cm)Set 1
Set 2
Set 1
Set 2
increasing material strength increasing material strength
increasing material strength
Pad 1a Pad 1b Pad 1d Pad 1c Pad 2d Pad 2b Pad 2a Pad 2c
Blast 1 Blast 2 Blast 3
Fig 4 a) Crater depth variations with increasing material strength in pads for Set 1 and Set 2. b) Crater diameter
50 0
100 150
Depth from initial surface (cm)
Depth from initial surface (cm)
0 -0.5 -1.0
-1.5 0.5 1.0 1.5 2.0 Horizontal distance from the epicenter (m)
Pad 1a 1
a
50 0 100 150 0 -0.5 -1.0 -1.5 0.5 1.0 1.5 2.0 Pad 1b 1 covered hummock crater rim 1 2 3 disrupted zone ls ls 10 cmc
probe profile visual disruption
Fig 5 Subsurface structure profiles. a) Final probe profiles and visual disruption profiles in Pad 1a and 1b. The
yellow dots represent the charge location. b) Final probe profiles and visual disruption in Pad 2a, 2b and 2d. The
final crater profile 0 50 100 0 -0.5 -1.0 -1.5 0.5 1.0 1.5 2.0 150 Pad 2a
b
3 1 2Horizontal distance from the epicenter (m)
0 50 100 0 -0.5 -1.0 -1.5 0.5 1.0 1.5 2.0 150 Pad 2b 3 1 2 0 50 100 0 -0.5 -1.0 -1.5 0.5 1.0 1.5 2.0 150 Pad 2d 3 2 1
Weak
substrate
1
2
3
Limit of disrupted
area locationcharge