To cite this document:
Kuhn, Nicolas and Lochin, Emmanuel and Lacan, Jérôme and
Mehani, Olivier and Boreli, Roksana CLIFT: a Cross-Layer InFormation Tool for
Latency Analysis Based on Real Satellite Physical Traces. (2014) In: 7th Advanced
Satellite Multimedia Systems Conference ASMS 2014, 8 September 2014 - 10
September 2014 (Livorno, Italy).
O
pen
A
rchive
T
oulouse
A
rchive
O
uverte (
OATAO
)
OATAO is an open access repository that collects the work of Toulouse researchers and
makes it freely available over the web where possible.
This is an author-deposited version published in:
http://oatao.univ-toulouse.fr/
Eprints ID: 11835
Any correspondence concerning this service should be sent to the repository
administrator:
[email protected]
CLIFT: a Cross-Layer InFormation Tool for Latency
Analysis Based on Real Satellite Physical Traces
Nicolas Kuhn
1,2,3, Emmanuel Lochin
2, J´erˆome Lacan
2, Olivier Mehani
3, Roksana Boreli
31IMT Bretagne, Rennes, France
2Universit´e de Toulouse, ISAE, TeSA, Toulouse, France 3NICTA Sydney, Australia
Abstract—New mobile technology generations succeed in achieving high goodput, which results in diverse applications profiles exploiting various resource providers (Wifi, 4G, 5G, . . . ). Badly set parameters on one of the network component may severely impact on the transmission delay and reduce the quality of experience. The cross layer impact should be investigated on to assess the origin of latency. To run cross-layer (from physical layer to application layers) simulations, two approaches are possible: (1) use physical layer models that may not be exhaustive enough to drive consistent analysis or (2) use real physical traces. Driving realistic measurements by using real physical (MAC/PHY) traces inside network simulations is a complex task. We propose to cope with this problem by introducing Cross Layer InFormation Tool (CLIFT), that translates real physical events from a given trace in order to be used inside a network simulator such as ns-2. Our proposal enables to accurately perform analysis of the impact of link layer reliability schemes (obtained by the use of real physical traces) on transport layer performance and on the latency. Such approach enables a better understanding of the interactions between the layers. The main objective of CLIFT is to let us study the protocols introduced at each layer of the OSI model and study their interaction. We detail the internal mechanisms and the benefits of this software with a running example on 4G satellite communications scenarios.
I. INTRODUCTION
In [1], the authors highlight that even though new mobile technology generations reduce the latency, each component of the network adds delay and may severely impact the end user experience. As an example, on top of the transmission delay of a satellite link (254 ms), the various delays that are added along the path bring the “one way delay” to 329 ms. Badly set parameters on one of the links of the end-to-end path may severely impact the transmission delay and reduce the quality of experience. In order to resolve those issues, cross layer interactions should be investigated.
The increase of wireless and satellite links in current networks introduces challenging issues. In the case of Land-Mobile Satellite (LMS) channels, the most powerful codes cannot recover lost data, due to long bit-errors bursts at the physical layer [2]. The implementation of physical layer schemes is commonly linked to specific hardware, making it ill suited to modifications after the design or deployment of the system. To overcome the extremely challenging conditions in mobile satellite environment, reliability schemes can be introduced at the link layer in order to recover data that the physical layer may not be able to rebuild. In [3], the authors
conduct an extensive study on the reliability schemes that can be implemented at the link layer level: Forward Error Coding (FEC), Automatic Repeat reQuest (ARQ), Selective-Repeat Automatic Selective-Repeat reQuest (SR-ARQ) and Hybrid-Automatic Repeat reQuest type II (HARQ-II). Introducing reliability schemes at this level can prevent the transport layer from decreasing its congestion window in case of isolated errors. Moreover, the spectrum efficiency may be optimized, as introducing redundancy at the link layer may enable the usefulness of previously received data.
In the context of high latency links, these techniques might introduce critical delays and impact the transport layer protocols performance [4]. Preliminary studies have explored TCP performance over link layer ARQ protocols in wireless environment [5], [6] and in the context of 4G satellite system downlink [7]. One recent proposal [8] has developed analytical tools in order to evaluate the impact of reliability schemes at the link layer on transport layer protocols while some others [9], [10] attempt to consider link-layer data units. Nowadays, there is a clear need for a tool allowing to evaluate currently deployed protocols (CUBIC in GNU/Linux or Android and TCP Compound in Windows operating systems) over realistic MAC/PHY layer traces. Unfortunately, and to the best of our knowledge, there is no tool allowing to easily perform such study.
Even though their results are accurate and relevant, testbeds suffer from various drawbacks, such as the difficulty to run exotic simulations or the hardware limitations. In the context of satellite communications, the access to the media might be expensive without specific rights. Also, without the “super-user” rights, exotic simulations can not be launched and the protocols of different layers can not be modified much [11]. Following this idea and the need for cheap (in terms of simulation time, and computer process) and realistic evaluation tools, this document argues for methods to integrate low layers in the high-level network simulator NS-2.
Our proposal, called Cross-Layer InFormation Tool (CLIFT), links an updated and maintained network simulator, ns-2, with recent lower layers codes performing over real physical channel state traces. CLIFT is not a physical layer simulator (as opposed to [12]) but a way to take into account physical layer traces inside a network simulator. Therefore, CLIFT allows to study the impact of link layer reliability
CLIFT
INPUT OUTPUT
metrics
link layer trace ns2 *.tcl file
physical layer trace
(parameter file) TMT
NS2 BLOCK
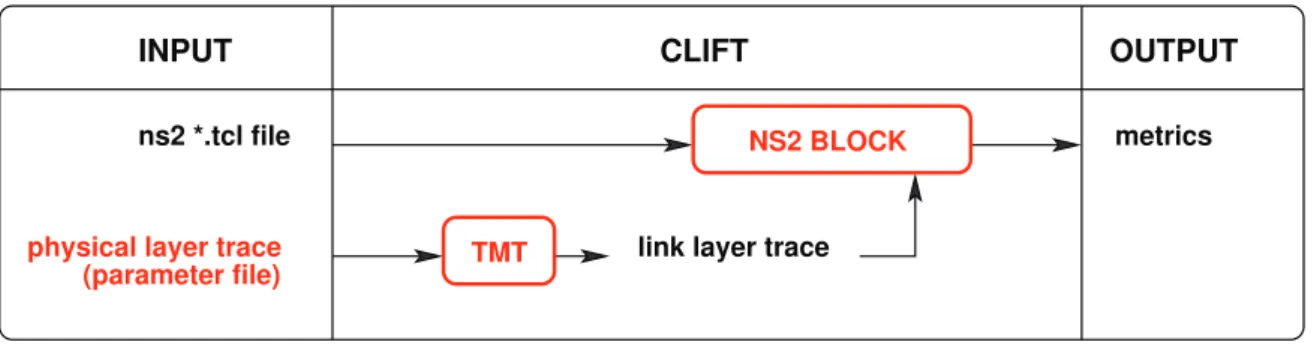
Fig. 1. Structure of CLIFT: Trace Manager Tool (TMT) (physical and link layers) and an NS2 module (upper layers)
schemes, as a function of a given physical channel, on trans-port protocols performance. The rationale of our approach is to replay MAC/PHY traces (CLIFT allows to read multiple ex-isting traces format) either empirically measured or generated by a physical layer emulator or simulator.
The rest of the paper is organised as follows: in Section II, we briefly detail the structure of our tool. In Section III, we present the physical layer traces and how CLIFT can consider link layer reliability schemes. Then, we detail the problems encountered in the development of the queuing module for ns-2 in Section IV. We illustrate the potential of our tool through an example in Section V and propose a use-case example in Section VI. We conclude in Section VII.
II. SOFTWAREARCHITECTURE
Before diving into the software details, we propose in this section to firstly present the overall structure of CLIFT and the linkages between each internal component. We also detail how to define a simulation and present the metrics provided by CLIFT.
A. CLIFT main internal components
CLIFT is based on two main components presented in Figure 1.
The Trace Manager Tool (TMT) component: for each link of the network, CLIFT loads a given physical trace and a parameter file (containing link-layer parameters, such as the reliability scheme used or the size of the link layer data units). We explain in Section III how reliability schemes at this layer can be taken into account.
Thens-2 block component: we developed a queuing module in ns-2 that loads these link layer traces to schedule the transmission of the transport layer packets. Thens-2 module implementation is detailed in Section IV.
B. Defining a complete simulation
A simulation is performed following the ns-2 standard procedure where the user needs to: (1) define the network structure through a standard TCLns-2 simulation file; (2) for each link, define a parameter file and provide a physical layer trace; (3) then runns simulation.
For each link, CLIFT adapts the measurements trace de-pending on the possible reliability schemes introduced and analyses the traces to compute the relevant metrics.
C. Metrics evaluation
Two kinds of metrics are returned by CLIFT:
• link layer level metrics: throughput efficiency, delay,
retransmission distribution, erasure distribution;
• transport layer level metrics: used resources (percentage
of the bandwidth), delay, number of RTO events, retrans-mission distribution, throughput, queuing delays. All these metrics allow to perform cross-layer analysis. This will be later illustrated in Section V.
III. PHYSICAL LAYER TRACE
One of the main advantage of CLIFT is to bring real physical traces into network simulation. In this section, we thus focus on the physical layer trace format and present the erasure codes that can optionally be applied.
A. Physical layer trace format
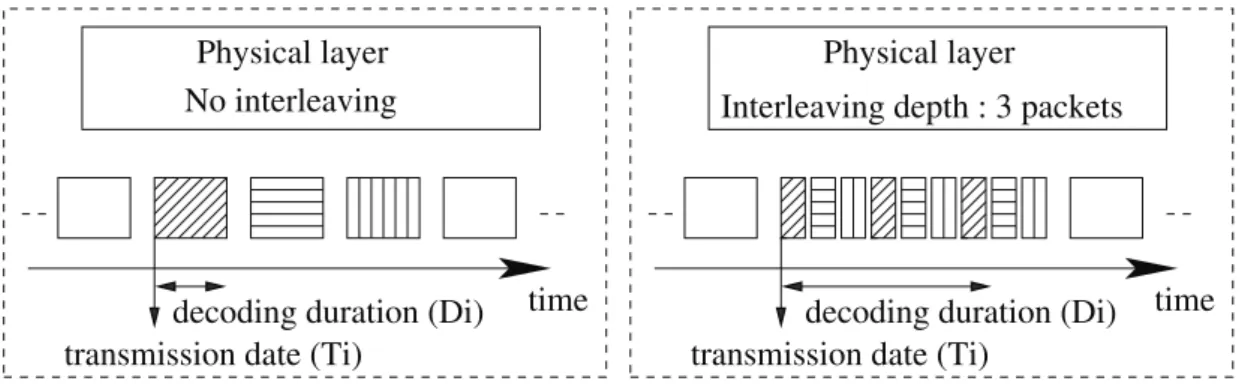
CLIFT accepts, as an input, several physical traces format: both measured (as those provided in CRAWDAD (see http: //crawdad.cs.dartmouth.edu) or generated by physical layer emulators [12] or simulators [13]. As an example, we propose the use of OFDM and TDM simulators from CNES. CNES is a government agency responsible for shaping and implementing France’s space policy in Europe, see http://www.cnes.fr/. that take into account realistic satellite links characteristics, such as satellite orbits or recent correcting codes to generate physical layer traces [14]. Each packet sent at the physical-layer level is characterised by a transmission date and a decoding time. In Figure 2, in order to better assess the link between trans-mission date and decoding time, we illustrate how they are affected by interleaving at the physical layer. The transmission date is linked to the bandwidth and the length of the code at the physical layer. The decoding time is linked to the duration of the interleaving, the channel state and the transmission time. As CLIFT can load any physical layer trace compliant with this format, they can be either real measured traces or traces obtained by a physical layer simulator. Therefore, the main achievement of CLIFT is that real measured channel evolutions can be considered, while modelling such channels might lead to approximation and errors.
The decoding time is composed of the different delays caused by the reliability schemes at the physical layer level
No interleaving
Physical layer
Physical layer
Interleaving depth : 3 packets
time
time
transmission date (Ti)
transmission date (Ti)
decoding duration (Di)
decoding duration (Di)
Fig. 2. Physical layer traces: transmission and decoding times
(interleaving and recovery delay). In the following, we denote by LLDU , one Link Layer Data Unit, ti, the transmission
date ofLLDUi,di, the decoding time ofLLDUianddi= 0,
the erasure event of LLDUi. At t = RT T /2 + ti+ di, the
physical-layer deliversLLDUito the link layer, if there is no
supplementary delay (congestion, queuing, ...).
B. Link layer Model
The traces considered by CLIFT can be MAC/PHY traces that may optionally implement reliability schemes. If we use traces that do not enable reliability mechanisms at the MAC level (e.g. ARQ or H-ARQ), we could also perform a pre-treatment over these traces with tools such as TMT [15], PPR [16] or DUMMYNET/NETEM[17] that allow to apply reliability mechanisms up the MAC level. Basically, these tools allow to modify the PHY traces, following a given reliabil-ity mechanism used at the MAC level, by recomputing the transmission slots. The principle is as follows : the decoding time of one erased LLDU is linked to the reliability scheme involved to estimate the time when the recovered LLDU must be sent. The supplementary time introduced by the link layer reliability scheme, denoted d′
i, is the time needed to obtain
(tR) and decode (dR) theLLDU that enables the recovery of
LLDUi: d′i = tR+ dR−ti. A physical layer data unit will
be delivered to the link layer atRT T /2 + ti+ d′i.
We detail below commonly used reliability schemes:
• FEC: The sender sendsND data andNR repair LLDUs.
From a FEC block composed ofND+ NR LLDUs, the
link-layer can repair a maximum number ofNRLLDUs; • SR-ARQ: The link layer retransmits the lost LLDU; • HARQ of type II: This mechanism is a combination
of FEC and SR-ARQ. After a first transmission of a FEC block, including data and repair LLDU, HARQ-II allows the sender to send additional repair LLDU when a recovery is not possible at the receiver side.
We denote HARQ (ND,ND+ NR) (or FEC (ND,ND+ NR)),
whereND is the number of data LLDU andNR the number
of repair LLDU.
As a result, one other main achievement of CLIFT is to consider the most recent link layer reliability schemes applied on realistic physical layer traces.
IV. INTERNAL SOFTWARE PRINCIPLE
CLIFT schedules the transmission of the IP packets depend-ing on the link layer traces (section III-B). We introduce a new queuing module inns-2 that loads these traces and determines when a packet can be received by the upper layer (depending on the reliability schemes introduced) and sent. The queuing system in ns-2 is mainly driven by the following entities: packets (with arrival times and services times attributes) and queues (with empty and non-empty attributes).
The enqueue() function is called when a packet arrives in the queue. When the channel is idle, the dequeue() function is called to transmit the packet chosen depending on the queuing mechanism. We modify these functions according to the scheduling read in the link layer trace.
A. Add an IP packet in the queue: the enqueue() function
One IP packet is divided into m LLDU (LLDUn, ...LLDUn+m). We denote by Ei, the enqueueing
date of IP packeti, Ti its the transmission date,
Di its decoding duration and Ri its reception date.
We look in the link layer trace for the LLDU that matches tn 6 Ei < tn+1. Over the m LLDUs, we
compute Di = maxk∈[n,n+m](tk + dk) − Ti. When
Ri = maxk∈[n,n+m](tk+ dk) + RT T /2 is actually the date
when IP packeti is delivered to the receiver.
We handle the case Di < Ei since ns-2 is a event-driven
simulator: for example, this event might occur when erasure codes are used, and bursts of LLDUs are forwarded to the upper layer. With a FEC code, if LLDUs are lost, they are all rebuilt at the same time with the reception of theNth
R LLDU. B. Removing an IP packet from the queue: the dequeue() function
As soon as an IP packet enters the queue, we introduce a timer which value is set depending on the transmission date of the LLDU packets the IP packet is broken down into. The timer is set to expire when there is an IP packet to transmit. Therefore, at each expiration of the timer, the method dequeue() is called and the corresponding IP packet is transmitted. We reinitiate the timer value if: (1) an IP packet is enqueued and there is no other packet in the queue; (2) an IP packet is enqueued and its transmission date is earlier than
0000000000 0000000000 0000000000 1111111111 1111111111 1111111111 00000000000 00000000000 11111111111 11111111111 0000 0000 0000 1111 1111 1111 0000000 0000000 0000000 1111111 1111111 1111111 0000000000 0000000000 0000000000 1111111111 1111111111 1111111111 20 90 90 10 10 10 10 5 6 7 8 9 10 11 link layer LLDU
SRC : input traffic
output time of the slot
+Xms +Yms theoretical delivery at the IP level
DST : output delivery at the IP level transmission date (Ti) decoding duration (Di)
we compute the max (Ti+Di)
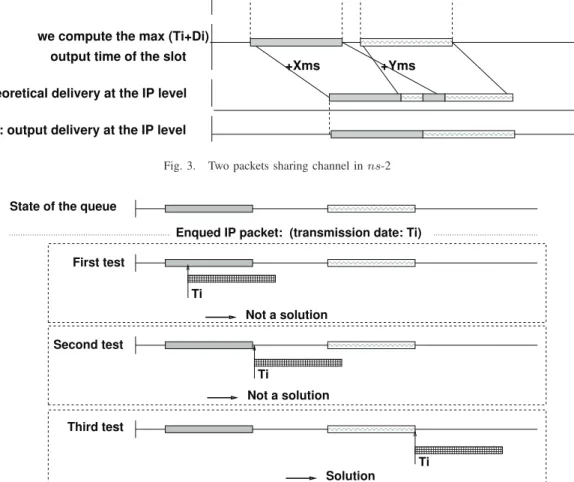
Fig. 3. Two packets sharing channel inns-2
00000000000 00000000000 00000000000 11111111111 11111111111 11111111111 00000000000 00000000000 00000000000 11111111111 11111111111 11111111111 00000000000 00000000000 00000000000 11111111111 11111111111 11111111111 00000000000 00000000000 11111111111 11111111111 00000000000 00000000000 11111111111 11111111111 00000000000 11111111111 0000000000 0000000000 1111111111 1111111111 0 0 0 0 1 1 1 1 0 0 0 0 0 1 1 1 1 1 0 0 0 0 0 1 1 1 1 1 Not a solution Not a solution State of the queue
Solution Second test Third test First test Ti Ti Ti Enqued IP packet: (transmission date: Ti)
Fig. 4. Adaptation of the transmission date of the IP packet
those of the packets in the queue; (3) an IP packet has to be removed from the queue (timer expiration) and there are IP packets in the queue.
C. Packet sending and scheduling principles
Figure 3 illustrates the problem occurring when LLDU reliability schemes overlap IP packets in terms of channel occupancy. In this example, both IP packets are broken into 4 LLDUs. The algorithms introduced at physical and link layers make that parts of the second packet must be transmitted before parts of the first packet. As a result, in this example, CLIFT adapts the transmission date of both packets that the transmission does not overlap at the network layer level.
In Figure 4 we detail the different cases we had to consider sincens-2 prevents one node from sending two packets at the same time.
If one of the LLDU is erased, the whole IP packet is dropped. The date of this event is linked to the reliability scheme introduced at the link layer. Indeed, the computed transmission date becomes the drop date. We also consider
that a dropped packet still uses the channel for its transmission and has to be taken into account in the scheduling detailed in Figure 4.
V. ILLUSTRATION EXAMPLE WITH LIMITED CONGESTION WINDOW
In this section, we show an example of what CLIFT enables to assess. We do not focus on a realistic example. The results are not vastly analyzed, but an illustration of the potential of our tool.
A. Simulation definition
1) Network and objectives: We study the impact of re-transmissions at the link layer on the performance of the transport protocol in a high bandwidth-delay product context. We consider a link between a satellite and a mobile receiver.
2) Physical layer characteristics: The physical layer trace corresponds to a mobile receiver moving at 60 km per hour. The simulation lasts 400 seconds. The size of the physical layer data unit is 33 bytes and the capacity 2,3 Mbps. We
0 10 20 30 40 50 60 70 0 50 100 150 200 250 300 350 400 450 Cong. window [pkts] Time (sec)
ARQ HARQ(10/12) HARQ(10/15)
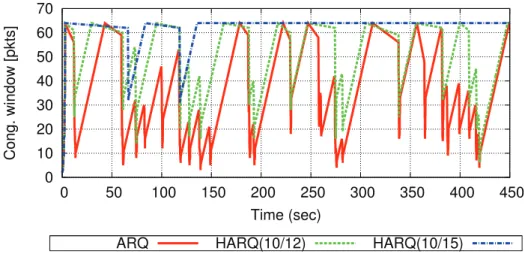
Fig. 5. Congestion window evolutions: when there is more redundancy, there are less congestion window reductions
consider an interleaving at physical layer of 35,5 ms and coding ratio of 1/3, waveform suitable for LTE uplink signals and a RTT of 500 ms. In accordance with the phenomena described in [2], the data obtained introduces realistic signal-to-noise ratio variations (and burst erasures), modulations, multiplexing or frequency. The physical layer traces have been provided by CNES.
3) Link layer characteristics: In this example we study the impact of retransmissions at the link layer level on the perfor-mance of transport protocols. Therefore within the different reliability schemes introduced (detailed in III-B), we focus on ARQ and HARQ of type II. For HARQ, we choose to use ND = 10 data LLDU and NR = 2 or 5 repair LLDU. The
LLDU packet size is set to 33 bytes.
4) Transport layer characteristics: The transport protocol used is TCP NewReno, implemented in ns-2. The IP packet size is set to 500 bytes. On the receiver side, we introduce a SACK mechanism. We aim to show the impact of the retransmissions at the link layer on the congestion window size. In order to better visualize the impact of congestion window reduction, we limit the congestion window to 64 IP packets: this parameter prevents TCP from reaching the optimal congestion window, but, the potential of our tool to assess the impact of link layer parameters on TCP.
5) Application layer characteristics: We introduce a File Transfer Protocol (FTP) between the satellite and the mobile receiver. The source is non application limited. FTP may not be a commonly used 4G mobile application, but FTP is uses as much network resources as the rate control allows. The greedy usage pattern allows us to test the boundary performance of the transport.
B. Results and interpretation
In this section, before interpreting the results, we collect the different metrics obtained during this simulation, in terms of: (1) used resources, goodput, mean coding ratio (MCR), delay, retransmission distribution (Table I); (2) congestion window evolution and packet transmission (Figure 5).
TABLE I METRICS GIVEN BYCLIFT
Metrics ARQ HARQ
(10/12) (10/15) % of the bandwidth used 13% 17% 23%
Goodput (kbps) 305 351 390
MCR (usef ul datasent data ) 95% 80% 65%
minimum 287 287 288 delay (ms) mean 288 288 289 maximum 383 341 327 Retransmission 0 99% 98% 99% number 1 0,7% 1,4% 0,6% (link layer) 2 0,04% 0,03% 0,01% 3 0,0007% 0% 0% Retransmission 0 98% 99% 99% number 1 1,5% 0,6% 0,7% (transport layer) 2 0,1% 0,1% 0%
With the data gathered in Table I, we can see that HARQ (10/15) has the best performance in terms of goodput and delay. Thereby, as more repair packets are sent, more bandwidth is used for this only application. Moreover, we can notice that even if we do not optimise the value ofNDnor the
ratio betweenNDandND+NR, HARQ of type II enables the
transmission of more data than an SR-ARQ reliability scheme, but uses more capacity.
We can see that there are more retransmissions at the transport layer with a SR-ARQ mechanism at the link layer. In consequence, we also see that the congestion window is reduced more often. Indeed, this can be explained by the fact that, while this mechanism enables the recovery of data, the IP packet is received after an additional delay. As the delayed IP packet is not acknowledged, the transport protocol assumes that it has been lost. When the congestion window is large, the delayed acknowledgements introduces spurious retransmissions and might greatly deteriorate the transmission of data as there is a reduction of the size of congestion window. Through this example, we illustrated that, on a channel with
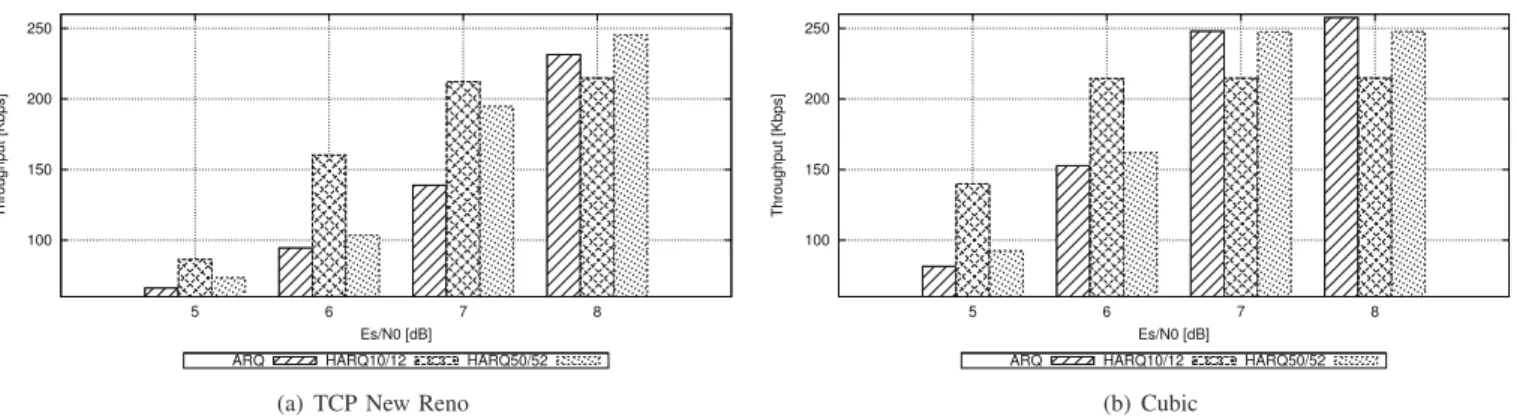
100 150 200 250 5 6 7 8 Throughput [Kbps] Es/N0 [dB]
ARQ HARQ10/12 HARQ50/52
(a) TCP New Reno
100 150 200 250 5 6 7 8 Throughput [Kbps] Es/N0 [dB]
ARQ HARQ10/12 HARQ50/52
(b) Cubic
Fig. 6. Comparing Cubic and TCP NewReno whenEs/N 0 decrease: when the bit-error-rate is high, we measure the interest for introducing redundancy at the link layer
a high erasure probability, with realistic parameters and bursty aspects, an SR-ARQ mechanism can introduce an important number of spurious retransmissions and reductions of the congestion window size: as the retransmissions modify the scheduling of the IP packets, the non-acknowledgement of some IP packets greatly deteriorate the performance of TCP NewReno protocol. As a future work we aim to study and observe the impact of retransmissions at the link layer level on the performance of the most recent transport protocols implemented inns-2.
We illustrated here that retransmissions at the link layer can greatly deteriorate the performance of a loss-based transport protocol. As an HARQ-II mechanism first sends a FEC block, it improves the performance in the simulation context. We considered a maximal congestion window of 64 packets. It would be interesting to study the impact of the bandwidth reduction due to the transmission of these repair packets. When the capacity of the link is reached, a trade-off has to be found between reducing the congestion window (with SR-ARQ) and reducing the available bandwidth (HARQ-II).
VI. USE-CASE:COMPARINGCUBIC ANDTCP NEWRENO OVER VARIOUS LINK LAYER RELIABILITY SCHEMES IN THE
CONTEXT OF4GLINKS
In this section, we present a use-case example for which CLIFT can provide realistic results. An extended version of these results can be found in [18].
A. Simulation definition
1) Network and objectives: We compare, in ns-2, the performance of Cubic and TCP NewReno over various link layer reliability schemes in the context of 4G satellite links.
2) Physical layer characteristics: The physical layer trace corresponds to a mobile receiver moving at 60 km per hour. The simulation lasts 400 seconds. We introduce a Turbo Code 3GPP with a code word (before coding) of 33 bytes on both up and down links. The interleaving depth at the physical layer of 36ms. We present the results of this scenario with Es/N 0 ∈ [5; 8] dB, i.e. P ER ∈ [10−2; 101]. The capacity
is 0.26 Mbps and the RTT 500 ms. In accordance with the
phenomena described in [2], the data obtained introduces realistic signal-to-noise ratio variations (and burst erasures), modulations, multiplexing or frequency. The physical layer traces have been provided by CNES.
3) Link layer characteristics: As in the previous section, we focus on ARQ and HARQ of type II. For HARQ, we choose to use (1) ND = 10 data LLDU and NR = 2 repair
LLDU or (2)ND= 50 data LLDU and NR= 2 repair LLDU.
The LLDU packet size is set to 33 bytes.
4) Transport layer characteristics: The transport protocol used is TCP NewReno or Cubic, both implemented in ns-2. The IP packet size is set to1500 bytes. On the receiver side, we introduce a SACK mechanism. Contrary to the previous section, the congestion window is not limited to64 IP packets.
5) Application layer characteristics: We introduce a File Transfer Protocol (FTP) between the satellite and the mobile receiver. The source is non application limited.
B. Results and interpretation
In Figure 6, we present the average throughput measured at the mobile receiver side. When the physical layer unit error rate is high, we note that there are important benefits in terms of bandwidth that can be achieved when HARQ-II are introduced at the link layer:
• with Cubic: at Es/N 0 = 5 dB, with ARQ, we
mea-sured an achieved throughput of 81 kbps, and with HARQ(10/12), of 140 kbps: introducing HARQ(10/12) at the link layer increases the goodput by 59 kbps. At Es/N 0 = 6 dB, with ARQ, we measure an achieved throughput of 153 kbps, and with HARQ(10/12), of 215 kbps: introducing HARQ(10/12) increases the good-put by 62 kbps.
• with TCP NewReno: at Es/N 0 = 5 dB, with ARQ, we
measured an achieved throughput of 66 kbps, and with HARQ(10/12), of 86 kbps: introducing HARQ(10/12) at the link layer increases the goodput by 20 kbps. At Es/N 0 = 6 dB, with ARQ, we measure an achieved throughput of 92 kbps, and with HARQ(10/12), of 162 kbps: introducing HARQ(10/12) increases the good-put by 70 kbps.
When there are less physical layer errors, we validate the assumption that when the capacity is fully exploited, transmit-ting redundancy packets with HARQ-II reduces the goodput,
i.e.the available bandwidth. Indeed, when the transport layer protocol is Cubic, atEs/N 0 = 8 dB, with ARQ, we measure an achieved throughput of258 kbps, and with HARQ(10/12), of 215 kbps. Introducing HARQ(10/12) reduces the goodput by43 kbps.
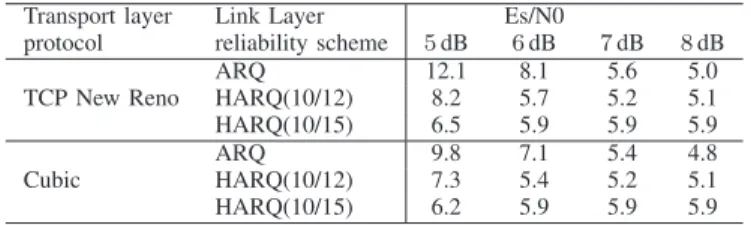
We propose to evaluate the behaviour observed in the pre-vious simulations by considering the transmission of 0.1 Mb (median Internet web page size according to Google Web Metrics [19]) with different transport layer protocols, differ-ent reliability schemes and differdiffer-ent transmission times (to consider different channel states). In Table II, we present the time needed to transmit these data using the different simulation parameters: we ran200 iterations and present the average value. As pointed out before, the impact of the value of Es/N 0 severely impacts on the transmission delay. We measure that the transmission is quite faster with ARQ than with HARQ when the signal-to-noise ratio is high. When the signal-to-noise ratio decreases, we quantify that there is more interest for considering HARQ schemes. Also, we can see that the performance of Cubic and TCP NewReno are approximatively the same, due to the small size of the file transmitted.
TABLE II
TIME NEEDED TO TRANSMIT0.1 MB(IN SECONDS) Transport layer Link Layer Es/N0
protocol reliability scheme 5dB 6dB 7dB 8dB
ARQ 12.1 8.1 5.6 5.0
TCP New Reno HARQ(10/12) 8.2 5.7 5.2 5.1 HARQ(10/15) 6.5 5.9 5.9 5.9
ARQ 9.8 7.1 5.4 4.8
Cubic HARQ(10/12) 7.3 5.4 5.2 5.1
HARQ(10/15) 6.2 5.9 5.9 5.9
In this section, we conclude that when the number of error increases at the physical layer, HARQ-II enables a significant improvement of the performance of transport layer protocols: we justify this by measuring the achievable throughput when FTP applications are considered and by measuring the delay needed to transmit a fixed amount of data. Also, we measured that Cubic shows better throughput than TCP NewReno and quantify this gain for various signal-to-noise ratios and link layer configurations.
VII. CONCLUSION
We have presented a tool that enables cross-layer studies between transport and MAC/PHY layers. We have developed the Cross Layer InFormation Tool (CLIFT), a simulator based on ns-2 that takes into account physical or link layer traces to schedule the transmission of transport layer packets.
Our software can consider several networks architectures while taking into account most recent transport protocols. The originality of our tool consists in taking into account realistic sets of physical layer parameters (coding ratio, modulation, waveform). An important variety of existing tools can provide
traces loaded in CLIFT, as they can be measured or simulated. In this article, we focused on 4G satellite links. However, CLIFT can take into account any physical layer traces (Wi-Fi, wired or 5G satellite links) in the context where cross-layer studies are of interests. We provide an exemple of use case with 4G satellite links, but we also used CLIFT to conduct investigations of link layer retransmissions impact on TCP in the context of Aeronautical Communications [20]. CLIFT is well suited to study and optimize the protocols introduced at various layers of the OSI model to reduce the latency measured in the network.
ACKNOWLEDGEMENT
The author wish to help Caroline Bes and Laurence Clarac from the Centre National d’Etudes Spatiales (CNES) which funded this work. CLIFT is available upon request to CNES. The authors wish to thank Thales Alenia Space for technical support. Nicolas Kuhn is supported by the RITE project.
REFERENCES
[1] O3b Networks and Sofrecom. Why latency matters to mobile backhaul. Available at: http://www.o3bnetworks.com/telcos/mobile-backhaul [2] M. Cheffena and F. P´erez-Font´an. Channel Simulator for Land Mobile
Satellite Channel Along Roadside Trees. IEEE Transactions on antennas and propagation, 2011.
[3] E. Berlekamp, R. Peile, and S. Pope. The Application of Error Control to Communications. Communications Magazine, IEEE, 25(4), April 1987. [4] M. Hassan, R. Jain. High Performance TCP/IP Networking. Pearson
Prentice Hall, New Jersey, 2004.
[5] H. Balakrishnan, V.N. Padmanabhan, S. Seshan, R.H. Katz. A comparison of mechanisms for improving TCP performance over wireless links. ACM/IEEE Transaction Networking, 1997.
[6] A. Chockalingam, M. Zorzi, V. Tralli. Wireless TCP performance with link layer FEC/ARQ. Proc. IEEE ICC, 1999.
[7] S. Alfredsson, A. Brunstrom, M. Sternad. Transport Protocol Performance over 4G Links: Emulation Methodology and Results. Wireless Commu-nication Systems, 2006. ISWCS ’06.
[8] C. Liu, E. Modiano. On the performance of additive increase multi-plicative decrease (AIMD) protocols in hybrid space-terrestrial networks. Computer Networks, 2004.
[9] V. Subramanian, S. Kalyanaraman, K.K. Ramakrishnan. Hybrid Packet FEC and Retransmission-based Erasure Recovery Mechanisms (HARQ) for Lossy Networks: Analysis and Design, appears in Communication Systems Software and Middleware, 2007
[10] C. Barakat and A. Al Fawak. Analysis of link-level hybrid FEC/ARQ-SR for wireless links and long-lived TCP Traffic, Performance Evaluation - Selected papers from the first workshop on modelling and optimization in mobile, ad hoc and wireless networks (WiOpt’2003)
[11] E. Lochin, T. P´erennou and L. Dairaine, When should I use network emulation? Annals of Telecommunications, 2012
[12] J. Mittag et Al. Enabling Accurate Cross-Layer PHY/MAC/NET Simu-lation Studies of Vehicular Communication Networks. Proceedings of the IEEE, vol.99, no.7, July 2011
[13] G. Judd and P. Steenkiste. Repeatable and realistic wireless experimen-tation through physical emulation. ACM SIGCOMM Comput. Commun. Rev. 2004
[14] C. Amiot-Bazile and J. Lacan. Prediction of performance of the DVB-SH system relying on Mutual Information. Advanced satellite multimedia systems conference (ASMA) and 11th signal processing for space com-munications workshop (SPSC), 2010
[15] N. Kuhn, E. Lochin, J. Lacan, R. Boreli, C. Bes and L. Clarac. Enabling Realistic Cross-Layer Analysis based on Satellite Physical Layer Traces. IEEE International Symposium on Personal, Indoor and Mobile Radio Communications (PIMRC), 2012
[16] K. Jamieson and H. Balakrishnan. PPR: Partial Packet Recovery for Wireless Networks. SIGCOMM 2007 Proceedings of the 2007 conference on Applications, technologies, architectures, and protocols for computer communications.
[17] M. Becke, T. Dreibholz, E. P. Rathgeb and J. Formann. Link Emulation on the Data Link Layer in a Linux-based Future Internet Testbed Environment. The Tenth International Conference on Networks, ICN 2011.
[18] N. Kuhn, E. Lochin, J. Lacan, R. Boreli and L. Clarac. On the impact of link layer retransmission schemes on TCP over 4G satellite links. To appear in International Journal Of Satellite Communications And Networking, 2014.
[19] Google Web Metrics. See more at: https://developers.google.com/speed/ articles/web-metrics.
[20] N. Kuhn, N. Van Wambeke, M. Gineste, E. Lochin and J. Lacan. Link Layer Retransmission and TCP for Aeronautical Communications. 5th International Conference on Personal Satellite Services (PSATS), 2013.