http://doi.org/10.1504/IJPD.2020.10028179
Bertoni, Alessandro and Yi, Xin and Baron, Claude and Esteban, Philippe and Vingerhoeds, Rob A. A framework for data-driven design in a product innovation process: data analysis and visualisation for model-based decision making. (2020) International Journal of Product Development, 24 (1). 68-94. ISSN 1477-9056
A framework for data-driven design in a product
innovation process: data analysis and visualisation
for model-based decision making
Alessandro Bertoni*
Department of Mechanical Engineering, Blekinge Institute of Technology, 37179, Karlskrona, Sweden Email: [email protected] *Corresponding author
Xin Yi
LAAS-CNRS, Université de Toulouse,CNRS, INSA, 7 av. du Colonel Roche, 31400, Toulouse, France
Email: [email protected]
Claude Baron
LAAS-CNRS,
Université de Toulouse,
CNRS, INSA, 7 av. du Colonel Roche, 31400, Toulouse, France
and
ISAE-SUPAERO, Université de Toulouse, 10 av. Edouard Belin, 31400 Toulouse, France Email: [email protected]
Phillippe Esteban
LAAS-CNRS,
Université de Toulouse,
CNRS, Université Toulouse III – Paul Sabatier, 7 av. du Colonel Roche,
31400, Toulouse, France Email: [email protected]
Rob Vingerhoeds
ISAE-SUPAERO, Université de Toulouse, 10 av. Edouard Belin, 31400 Toulouse, France
Email: [email protected]
Abstract: The paper presents a four-layer framework for the application of
data-driven design in a product innovation process. The framework builds on the Knowledge Value Stream and on the Product Value Streams of a product innovation process and indicates how data-driven activities shall be structured and organised in relation to the different phases of a model-based decision process. Visualisation is proposed as a communication enabler at the top of the framework to overcome the comprehensibility barrier between data science and engineering design models. The framework is implemented in the case study of a construction equipment encompassing the analysis of operational machine data and the experimentation of suitable visualisation techniques. Ultimately, a list of challenges for the implementation of data-driven design is presented, and the capability of the framework to support the transition toward data-driven design is discussed in relation to the emergence of product-service systems solutions.
Keywords: data-driven design; product innovation; product value stream;
knowledge value stream; decision making; data visualisation; data analysis.
Reference to this paper should be made as follows: Bertoni, A., Yi, X.,
Baron, C., Esteban, P. and Vingerhoeds, R. (2020) ‘A framework for data-driven design in a product innovation process: data analysis and visualisation for model-based decision making’, Int. J. Product Development, Vol. 24, No. 1, pp.68–94.
Biographical notes: Alessandro Bertoni is Associate Professor in Mechanical
Engineering in the Product Development Research Lab at Blekinge Institute of Technology (Sweden). He received a PhD in Product Innovation at Luleå University of Technology and he currently does research in the field of Value-Driven Design. He focuses on the integration of data science and machine learning algorithms in the early stages of product and systems design, as well as in the development of decision support tools for decision making.
Xin Yi is a doctoral candidate at INSA-Toulouse and majors in Informatique et Génie Industriel (computer science and industry engineering). She has a master degree in Sustainable Product-Service System Innovation from Blekinge Institute of Technology and is currently conducting research at the LAAS-CNRS laboratory. Her research focuses on design fixation with a particular focus on knowledge structuring and concept innovation.
Claude Baron is Professor at the University of Toulouse – INSA (France). After graduating (MSc/Engineering Degree), she received a PhD in Computer Sciences (Honours) and the “Habilitation à diriger les recherches” diploma from University of Toulouse. She conducts research in systems and software engineering at the LAAS-CNRS laboratory where she leads the Systems Engineering and Integration team. She is interested in optimising and smoothing product development process. Her research work is based on a multidisciplinary and collaborative vision of the design of complex systems. She addresses system modelling and process monitoring, considering embedded and critical systems and applications in avionics and automotive.
Philippe Esteban is Associate Professor at the University of Toulouse – Toulouse III University Paul Sabatier. He conducts research in Systems Engineering at the LAAS-CNRS Laboratory, at the System Engineering and Integration team. He is interested in basing implementation of collaborative engineering techniques on methods and tools to conduct the development process of a product rather than targeting the sole product technical development.
Rob Vingerhoeds is Professor of Systems Engineering and Head of the Complex Systems Engineering Department at ISAE-SUPAERO, Université de Toulouse, France. An Aerospace Engineer from Delft University of Technology, he holds a PhD in Applied Sciences from the University of Ghent, as well as a “Habilitation à Diriger des Recherches” from INP Toulouse. Systems engineering is a key topic in his career since the early beginnings, with a particular focus on real-time intelligent systems. His current research focuses on systems engineering for concept design, model-based systems engineering, and predictive maintenance for complex systems. Besides research and lecturing, he has substantial industrial experience in these areas.
This paper is a revised and expanded version of a paper entitled ‘Data visualization in conceptual design: developing a prototype to support decision making’ presented at the ‘12th International Conference on Modelling, Optimization and Simulation (MOSIM 2018)’, 27–29 June 2018, Toulouse, France.
1 Introduction
The breakthrough of emerging technologies in a variety of sciences and industries is shaking the traditional industrial system, opening for what the World Economic Forum defined as the Fourth Industrial Revolution (Schwab, 2015). The availability of new technologies creates an unprecedented possibility to radically change established behaviors at a pace that has “no historical precedent” (Schwab, 2015, p.1). From a business perspective, the “servitisation” phenomenon (Vandermerwe and Rada, 1989), originally recognised more than two decades ago, is now gaining speed, enabled by the new technological possibilities in the fields of data management, communication, and analysis. Such a situation sets the basis for new competitors to enter established markets with new value propositions and demands established companies to innovate their product offer (see for instance Miller and Hartwick, 2002; Davies, 2004; Ng et al. 2012).
Research has discussed what capabilities, processes and activities can lead individuals or companies to be more innovative (e.g., Kelley, 2001; Christensen, 2013; Johnsson, 2018). A common thread in such approaches is the improvement of the need-finding skills, by posing the right questions, understanding the real needs, either tacit or explicit, and quickly prototyping innovations. The training of individuals and teams to cross-functionality is often indicated as the key activity to promote innovation in a company (O’Connor and McDermott, 2004; West et al., 2004; Johnsson, 2017). Nevertheless, when the system to innovate grows in complexity (e.g., including the design of several sub-systems with service-oriented considerations), cross-disciplinary skills need to be complemented by suitable processes to support innovation. To this concern, Kennedy et al. (2008) described a Product Innovation Process. Such a process is increasingly proposed in literature as a lean enabler for systems engineering and it
encompasses two main “streams”: a Knowledge Value Stream where knowledge is collected and analysed, and a Product Value Stream where the development process kicks off with a product commitment. The challenge in the process is to deal with knowledge that is poorly formalised, causing the need-finding and trade-off activities to be cumbersome. On the one hand, the complexity causes individuals and teams to be quite ineffective in understanding the cause-effect relationships in the system. On the other hand, experimenting and prototyping new design ideas do not provide data consistent enough to build trade-off studies at an overall system level.
However, the increased accessibility of data collection and data communication technologies and the breakthrough of data science algorithms, have created the opportunity to address the lack of data availability in early design. The use of data mining and machine learning techniques has been increasingly discussed in literature as a way to fill the gap between the qualitative nature of decision-making models and their link to real data (Kusiak, 2006). To this respect, the term Data-Driven Design (DDD) has been used to refer to those applications relying on data to support the early stages of product and service development in a variety of situations (e.g., Kim et al., 2016; Zhang et al., 2017a). The scope of DDD models is to complement, rather than substitute, engineering models built on “traditional” mechanical simulations. The latter are commonly poorly capable of representing the relation between life-cycle performances and design variables, as well as not being able to effectively communicate service-related information that goes beyond the technical-horizon of engineers (Gautam and Singh, 2008; Bertoni et al., 2013). At the same time, DDD models need to deal with the so-called “Comprehensibility Barrier” (Freitas, 2014) of data science models, making engineers capable of understanding the content, results, and rationale of a model while not treating it as “black box”.
In line with such a context, the paper presents a framework describing the role and challenges of DDD models as enablers of product innovation in early design. The paper exemplifies the framework by applying it to a case study run in the construction equipment industry. Machine learning has been applied to the early design of a new machine to derive knowledge and discover hidden patterns in the data. The results of the analysis have been then communicated to engineers by means of different types of visualisation and an experiment has been run to verify the preferable visualisation techniques.
The paper has the following structure, Section 2 presents the research approach based on a literature review and on participatory action research. Section 3 presents the theoretical framework concerning data-driven approaches in design, the theory concerning computer-based support for decision making, and the product innovation process used as a reference in the paper. Section 4 describes the framework for DDD, while Section 5 describes the settings of the case study and the visualisation prototypes developed based on the results of the testing. Section 6 describes the challenges and research questions related to the implementation of the framework. Sections 7 and 8 discuss the relevancy of the research in relation to the actual literature and draw the final conclusions.
2 Research approach
The research presented in this paper is based on an approach combining literature review with Participatory Action Research (PAR) (Whyte, 1989). The review initially focused
on the application of data mining and machine learning in early product development, rendering clusters of papers targeting similar design problems. Such analysis was followed by a review of data visualisation support in the early stages of engineering design. Initially, the search was conducted on online databases to gather a complete picture of existing visualisation techniques. Later, the visualisation techniques were classified on the basis of their input and on the capability to match and integrate with techniques with similar features under different visualisation situations (the full description of the benchmarking is available in Yi et al., 2018).
The PAR took place primarily in collaboration with two medium-large companies dealing with large product development projects. On such occasions, data were collected through informal discussions, workshops, semi-structured and open-ended interviews, and company conferences. Transcriptions and notes were taken soon after informal discussions and interviews and were used to identify the main roles and challenges for data analysis and visualisation in the product innovation process. Those were analysed focusing the analytical lens on the decision-making process in the early stages of engineering design. Hypotheses were formulated, refined, and validated through verbal feedback obtained during internal conferences and as follow up of ad-hoc organised presentations. Such data were used to identify the industrial needs leading to the definition of the case study in the construction equipment industry. Such a case study was initiated based on an already available dataset, which consisted of variables and measurements collected from machine operations. Such data were further complemented by artificial variables defined as “contextual”, inspired by the work by Cronholm (2013) and further refined by means of interviews with company expers. To avoid the exposure of sensitive information, the field data described in this paper have been artificially modified. The modified data, however, conserve a reasonable degree of credibility to assure a realistic description.
The visualisation techniques identified in the literature review were tested for suitability by means of a design experiment in an artificial setting, involving four experts in engineering design. The purpose of the test was not described to the participants to avoid biased behaviors in the experiment. The experiment started with a brief introduction of the task background (i.e. understanding the fuel consumption patterns of construction equipment to drive the redesign objectives) followed by the presentation of the same results visualised with different techniques and either presented as printed papers or available on an interactive dashboard. Initially, 30 minutes were given for engineers to play with the data and with the different visualisation techniques. This activity was followed by a group discussion to find an agreement on the relevancy of the presented data, followed by a discussion on the efficacy of the visualisation techniques. The researchers played a passive role in the design experiment, taking notes on the topics of the discussion and on the different points of view of the participants. After the design experiment, the participants were asked to fill in a questionnaire consisting of 70 closed questions about the specific relevancy of each visualisation technique. The questions focused on five main aspects for each visualisation, namely: the intuitiveness, the familiarity with the technique, the support for knowledge acquisition, the support for faster decisions, and the capability of effectively showing the deviation from the average conditions. Finally, semi-structured interviews were conducted with the four engineers separately. During the interviews, questions about how they judged the intuitiveness and effectiveness of each visualisation technique were discussed.
The data collected through the questionnaires were analysed by creating a database and sorting questions and answers in a table. Each answer was coded by assigning a number code and the final results were obtained by summing up the codes to summarise the findings. Concurrently, narrative analysis was used for both the running notes taken during the design session and the semi-structured interviews. Data were organised and clustered based on the similarity of the topics and detailed reasons for specific choices were extracted.
3 Theoretical framework
3.1 Data-driven approaches in design
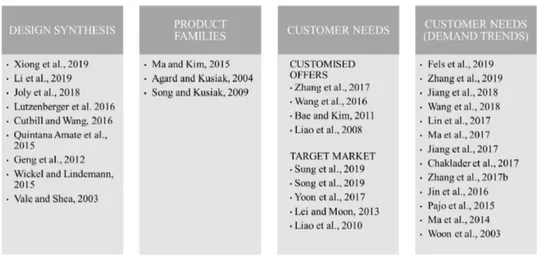
Data Mining and Machine Learning are the most commonly used terms to refer, respectively, to approaches aiming to discover patterns in a large set of data, and to the development of algorithms allowing computers to evolve their behaviors based on empirical data (Anand and Büchner, 1998; Manyika et al., 2011). The literature review highlighted that data-driven approaches assume either a predictive or a descriptive role in the design, that is, they focus either on forecasting the value of a design variable or in describing hidden patterns in the available data (Anand and Büchner, 1998). Such approaches are addressing the need to overcome the limits of human analysis when dealing with a large and complex set of data (Fayyad and Stolorz, 1997). Four main areas of application emerged from the literature, namely: design synthesis, product families, customer needs, and customer needs focusing on demand trends.
Concerning the design synthesis, Tseng and Jiao (1997) were among the firsts to describe how patterns of functional requirements could be identified by data mining. After that, one of the first contributions was the one by Vale and Shea (2003) proposing an approach analysing the modifications of design objectives and rating the effects according to a figure of merit. Recently, approaches have been proposed to exploit design for manufacturing (Xiong et al., 2019), and to support computational fluid dynamics optimisation (Joly et al., 2019; Li et al., 2019). Other methods have instead focused on addressing black-box optimisation (Cutbill and Wang, 2016), on managing design changes relying on existing engineering database (Wickel and Lindemann, 2015), and in improving the definition of the design parameters based on available data (Lützenberger et al., 2016). Based on a database of historical data, Geng et al. (2012) mined parameter-translating rules to support the translation of customers’ requirements into design requirements and module characteristics. A case study of data-driven design optimisation of wing covers was described by Quintana-Amate et al. (2015), forecasting the impact on the time to remanufacturing given by a change of a value in a design parameter.
A smaller set of contributions focused on supporting the design of new product families (Agard and Kusiak, 2004), to define clusters of families (Ma and Kim, 2016), or to identify sub-assembly patterns from customers’ orders (Song and Kusiak, 2009). The analysis of the trends in customers’ demands is an area that has been addressed by a number of authors. Among those, Woon et al. (2003) focused on explicating the hidden knowledge about trends in product development. More recently, Zhang et al. (2017b) proposed an approach to identify the performance requirements of a product based on the analysis of collected operational data. Large attention has been given to the use of social media and online reviews as data sources to identify customer needs. Mining social
media, Pajo et al. (2015) proposed a method to gather information about actual and future customers’ needs, while Vezzetti et al. (2017) applied big data analytics on social media to increase customers’ satisfaction in the fashion industry. Using text mining, opinion mining and sentiment analysis, many authors have recently proposed methodology to predict the importance of new features in future products (Jin et al., 2016; Lin and Chiu, 2017; Jiang et al., 2017; Chaklader and Parkinson, 2017; Jiang et al., 2018; Xingjian et al., 2018; Fels et al., 2019; Zhang et al., 2019). Trend mining techniques have also been used to optimise design features by creating predictive models based on the identification of patterns in the design attributes (Ma et al., 2014). Similarly, Zhang et al. (2017a) proposed a Systematic Function Recommendation Process for product and service design, mining information from unstructured contents on online databases and web pages. Ma et al. (2017) described an approach to guide the identification of the design parameters to be modified based on the analysis of time-dependent product usage data, using clustering algorithms on large datasets.
The so-called “Apriori” algorithms have been used by a number of authors to support managerial decision making by identifying the target market segment (Lei and Moon, 2013), to study the product attributes influence in the purchase decisions (Bae and Kim 2011), to improve customer relationship management by mining customer knowledge (Liao et al., 2010), and to describe the relations between the data collected from the customers and the product map (Liao et al., 2008). Recent work concerning the identification of potential markets, applied data mining into patent databases to understand the technology evolution trajectories and demands (Song et al., 2019) and to discover new product opportunities (Yoon et al., 2017). Sharing the same objectives, Wang et al. (2016) used network analysis based on experiments, product surveys and product specifications to understand the interaction between technologies products and customers to guide engineering design decisions, and Sung et al. (2019) used customers’ purchase data to discover new sales distributors. Figure 1 summarises the findings of the literature review clustering the main publications dealing with data-driven design applications in engineering design into the four categories identified.
3.2 Model-based support for early engineering design decision making
How humans make decisions in the presence of complexity and multi-criteria evaluation is a largely discussed research topic encompassing engineering, psychology, and management. Research shows that decision making is often dominated by three aspects, namely: what is the information available about the current and historical situation, what is the relation between basic processes and actions or decisions, and the decision-making process itself (Wierzbicki et al., 2000). Normally, humans do not have the cognitive capabilities to incorporate all such aspects in the decision making, rather they tend to isolate only one of such, or a sub-aspect of it.
Rationally this is done for not studying an overly complicated environment featuring many cross-influencing factors. Nevertheless, the reality in complex decision environments shows the need for decision support systems that integrate those three aspects (Wierzbicki et al., 2000). To address such needs, computer-based decision support systems have been developed and studied since the ’70 s (Weiss et al., 1978).
To this concern, the most suitable way of developing a support system for decision-making is identified in supports capable of “exploiting (the) knowledge about aspect-oriented approaches and of modifying those approaches in such a way that they can be fitted together somehow” (Wierzbicki et al., 2000, p.10).
Apparently in contrast with the creation of model-based supports, “gut feeling” and intuition, building on the experience and on the tacit knowledge of decision-makers, are proved to play a critical role when making decisions in large-scale product development (Flanagan et al., 2007; Kastensson and Johansson, 2011). While such ad-hoc intuitive decisions allow reacting quickly to a change of information from products and contexts, they do not deliver better results than well prepared analytical decisions, rather the benefit of computerised supports for decision is not disputed (Wierzbicki et al., 2000) (Flanagan et al., 2007). To this concern, Wierzbicki et al. (2000), described the role of computer-based models in relation to human cognitive capabilities and limitations, defining five phases for a creative, strategic, and intuitive decision process. Those are, namely, Recognition, Deliberation, Gestation and Enlightenment, Rationalisation, Implementation. Among those, Rationalisation, i.e. the formulation of the reason for the choice in case of group decisions, is identified as the phase that could get more benefit from computer-based support (Wierzbicki et al., 2000). This fits the context of new product development, in which decisions are mostly taken in teams, and in which the results of group decisions have been proven to outperform individual decisions by granting more effective product development continuation (Wierzbicki et al., 2000; Flanagan et al., 2006).
3.2.1 Substantive models and preferential models for decision making
In their work on model-based decision support systems, Wierzbicki et al. (2000) described two types of models to support decision making: substantive models and preferential models. The substantive models allow capturing priorities and relevant decision criteria, while preferential models provide a means for discussing preferences and exchange evaluations based on the pre-selected criteria. In other words, substantive models describe the relationship between variables in that part of the reality relevant for the decision, while preferential models represent the preferences of the decision-makers. Those models have been put into relation with the development of model-based decision
support systems, identifying different activities linked to model building, model analysis, and choice and implementation, for the different stages of the decision process. In detail, Wierzbicki et al. (2000) summarised the activities as:
Early Stages of the decision process (Model Building): Here, the decision model design is either created as new or modified from pre-existing model blocks. This phase includes problem identification and initial data gathering to define alternative hypotheses and model types and structures. In this stage, substantive model parametersareestimatedbystatisticalanalysisorparametricoptimisationprocedures. Middle Stages of the decision process (Model Analysis): Here, substantive models
are used for selecting alternative designs or scenarios. This is done by running simple multi-objective simulations with sensitivity and post-optimal analysis. In the case of complex decisions, involving a high number of options, partial preferential models can also be used in this phase.
Late stages of the decision process (Choice and Implementation): Here, specific methods or tools are employed to support the final decision. Preferential models are used to exchange evaluations of possible solutions. Models can also be used for monitoring the effect of a decision in terms of adequacy and viability.
3.3 Value streams in the product innovation process
A number of authors in the field of product development and systems engineering (see for instance Stenholm et al., 2015; Isaksson et al., 2015) identified the product innovation model by Kennedy et al. (2008) as a reference for describing the process and activities happening in the early stages of complex product design. The model consists of two main stages, namely a Knowledge Value Stream and a Product Value Stream. The first encompasses the initial capture and reuse of knowledge about markets, customers, technologies, products, and manufacturing capabilities, which is general across projects and organisations. The second corresponds to the flow of tasks, people and equipment needed for defining drawings, bill of materials, manufacturing systems, and anything else that is necessary for product development. Such a framework has been further developed from the perspective of a sub-system manufacturer by Isaksson et al. (2015) as a “framework for model-based decision support for value and sustainability”, highlighting the different needs for decision supports in the two streams. Four main activities are identified along the streams and can be summarised as follows:
Concept Screening/Scoping: Here, the solution space is very open and information is limited and immature. This phase encompasses quick screening of solutions in order of hours.
Concept trade-off: Here, the more promising solutions are selected for analysis and simple simulation models are created to evaluate different designs. This phase is still characterised by low maturity of knowledge and information.
Emerging Design (product commitment): Here, decisions are made to enable the design team to confine the design space and down select a limited number of concepts from the previous set. More precise models are created to investigate the design space and their development and executions can take within one and a few days.
Concept development: Here, the Product Value Stream starts by committing to a design. Product and process definitions are refined to minimise risks and costs. The time frame for decision support tools is still constrained, but studies can eventually take a few weeks. In this stage, the product definition is clearer and there is a higher availability of data for decision making.
4 The role of data analysis and visualisation in complex system innovation
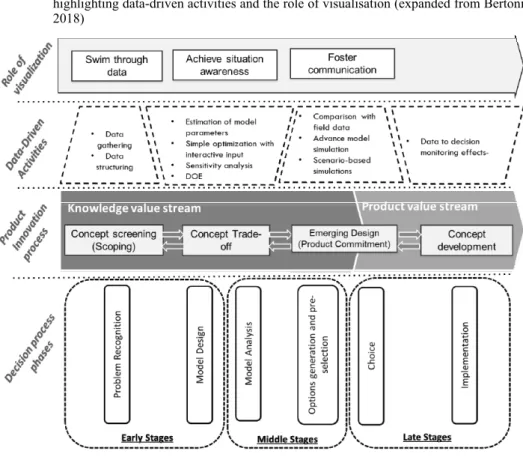
Based on the literature findings and the PAR, this section proposes a framework describing the role of data analysis and visualisation in the Product Innovation Process (see Figure 2). Data in the very early stages of the process are often of qualitative nature, being very difficult to formalise into mathematical terms. Those are mainly based on tacit knowledge or experience of engineers and decision-makers and embeds uncertainty given by context-dependency. For this reason, DDD models in the conceptual screening shall be mainly used to define hypotheses and correlations and shall be populated by the acquisition of preliminary data about the problem to be solved.
This is in line with what takes place in the “problem recognition” phase, where substantive models are created to capture the priorities in the evaluation. In the concept trade-off phase, DDD models shall be created with the awareness of which data are available. Those are used to populate substantive models targeting that portion of reality relevant for the decision. At this stage, statistics and mathematical modeling can be used in the “model design” phase, where a number of models and derivatives are developed. The concept trade-off shall be then completed by complementing the Model Analysis phase with DDD models capable of running more data-intense calculations, enabled either by the collection of new data or by sensitivity analysis and design of experiment to study the effects of the variation of the inputs. At this point, the DDD models can still be seen as substantive, i.e. describing the situation as-is with no reference to decision-makers’ preferences.
In the Emerging Design phase, alternative solutions are designed and eventually pre-selected. To this purpose, partial preferential models start to be needed to enable the decision-makers to converge toward the final choice of committing to a concept. DDD models encompass the comparison of the early simulation results with real experimental data. In some cases, advanced simulation models can be developed on request. Here, users would need to interact with the DDD models to estimate the value of a solution based on different preferences used as input. In other words, in this stage the DDD models are no longer playing the role of describing the situation AS-IS, rather they allow estimating the effect of a decision, to predict how preferable a solution is in comparison to others. Finally, entering the Product Value Stream, the focus shifts toward the development and implementation of the committed solution. Here DDD models lose their descriptive nature but shall be used as a basis to manage the continuous monitoring of the process, eventually leading to model prediction updates.
The implementation of DDD in a product innovation process cannot avoid considering the issues related to the human capabilities of managing and elaborating complex information in a restrict time-frame (i.e. the issue of information overload described by Tegarden, 1999). The visual representation of information plays an
important role in trying to avoid this to happen, by enabling decision-makers to “fly over”, or “swim through”, the data. Visual representation enables the use of mental models when searching for solutions (Simon, 1996) and fosters communication by achieving situational awareness (Endsley, 1995; Klein 1989). The use of multiple cues creates advantages by enhancing associative processing and mitigating information overload (Severin, 1967). This is also valid for computerised information processing and models where information should be represented with a multidimensional perspective, this is because it is not set “a priori” on which piece of information decision-makers’ sub-consciousness will focus (Wierbicki et al., 2000). The integration of a visualisation support shall, however, take into consideration the risk of filling different information channels with too much information, causing irrelevant cues to be evoked (Severin, 1997); and shall also be closely tied to the cognitive styles, personal characteristics and prior knowledge of the visualisation audiences (Bai et al., 2011). The framework for DDD application in the product innovation process, showed in Figure 2, emphasises the parallelism between data-driven activities, product innovation stages and phases of the decision process.
Figure 2 Framework for data-driven design models in relation to the product innovation process
highlighting data-driven activities and the role of visualisation (expanded from Bertoni, 2018)
5 Case study
The proposed framework for DDD has been applied in a case study of the development of construction equipment, namely a wheel loader. The framework has been applied to exemplify the potential use of data analysis and visualisation in the early design stages with a specific focus on the need for data visualisation. In the development of construction equipment (e.g., wheel loaders, articulated haulers, dump trucks and trucks) the energy efficiency is a key performance objective for the industry, thus this has been set as the main design objective of the case study. In relation to the energy consumption, a wheel loader requires power mainly to lift the material with the bucket, to move from point A to point B, and to power the devices in the cabin. As for any other construction equipment, the energy efficiency of a wheel loader is not only determined by the nominal fuel consumption value, rather is very much influenced by the contextual conditions in which the machine operates. Engineers in charge of designing the next generation of machines need therefore to be aware of how a design change would impact the machine performance under a high number of different operating scenarios.
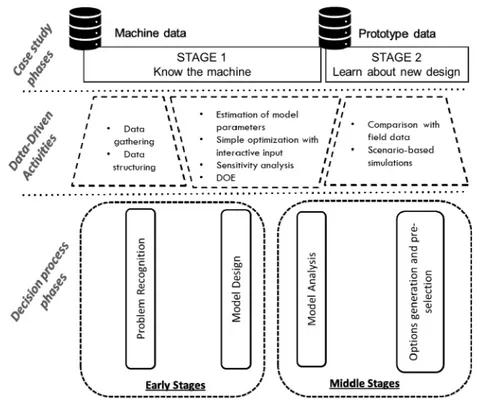
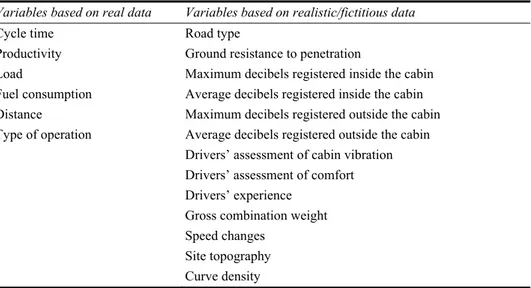
Machine-related, operational and context-related data were collected in the first part of what is defined as Stage 1 of the case study (see Figure 3) to allow the engineers to build models about the performances of the actual machine. The initial dataset consisted of 19 variables, as listed in Table 1.
Table 1 List of variables used to build DDD models in the case study. The division is based on the use of real (column 1) or realistic and fictitious data (column 2)
Variables based on real data Variables based on realistic/fictitious data
Cycle time Road type
Productivity Ground resistance to penetration
Load Maximum decibels registered inside the cabin
Fuel consumption Average decibels registered inside the cabin
Distance Maximum decibels registered outside the cabin
Type of operation Average decibels registered outside the cabin
Drivers’ assessment of cabin vibration Drivers’ assessment of comfort
Drivers’ experience
Gross combination weight
Speed changes
Site topography
Curve density
As shown in Figure 3 DDD models were applied in Early Stage and in the Middle stage of the Decision Process. Data mining techniques were applied to the dataset to allow the identification of unexpected correlations. For instance, the experience of the drivers, the speed changes, and the curve density on the operating path, proved to sensibly impact the fuel consumption of the machine. On the contrary, other variables such as the topography of the working site or the ground resistance proved not to be highly correlated with an increase in fuel consumption.
After having defined a model of the impact of contextual variables on fuel performance, the stage 2 of the case study focused on using such data to estimate the performance of a new design, using data from the current machine to create a benchmark upon which to compare new machine designs. This allowed scenario simulations based on the original field data (e.g., the expected fuel impact deviation from the expected scenario). This was applied to the estimation of the impact of contextual variables on the energy performance of a new hybrid-engine wheel loader. The detailed description of the results of the case study in terms of machine performances and predictions are outside the scope of this paper and can be found in Bertoni et al. (2017).
5.1. Testing the visualisation of the case study results
The case study included the study of which visualisation techniques would best fit with the need to communicate the results to an engineering team. The results of the analysis from stage 1 were used as the basis for the investigation. Different visualisation techniques were applied to the data obtained from the analysis. Feedback and insights were gathered from engineers about the intuitiveness of the visualisation. The study of visualisation techniques targeted in particular the capability of interpreting the data and the capability to deal with individual cognitive limitations. As a result of the testing, four different levels of granularity of the visualisation appeared to be necessary, and different visualisation techniques were investigated on the basis of different engineering needs. The following list provides an insight into the findings of the testing (a more extensive description of the testing is available in Yi et al., 2018).
Showing the overall fuel consumption: Box-plots proved to be useful in providing the overall picture of the fuel performance when a large amount of data is presented from an overall perspective without entering detailed information. The use of color-marked clusters appeared to be convenient in such cases (as suggested by Fraley and Raftery, 2002).
Visualisation of patterns in a cluster with few data points: Bar charts allowed efficient data visualisation for such analysis where similar data output were gathered in a unique cluster.
Visualisation of patterns in a cluster with many data points: For more complex datasets, Scatter Plot was identified as more convenient for trend tracking since they express data in a horizontal direction. Variations in color, symbol and size ease the pattern investigation. Scatter plots, combining the function of the commonality exploring and trend tracking, offered a good tool for insights gathering.
Comparing the impact of variables on the whole value: In this case, the possibility for engineers to interactively select design variables and visualise the impact with bar charts emerged as a good visualisation solution. Link to such visualisation the use of pictures representing the specific variables under consideration emerged as a possible solution to the problem of data interpretation (i.e. wrong interpretation of the meaning of the design variable).
Basedonthefindingsfromthetesting,afinalprototypeconsistingofseveralvisualisation techniques was proposed. The following sub-sections describe which visualisation techniques were selected for the case study to support different data analysis.
5.1.1 Approach one: show the overall fuel consumption
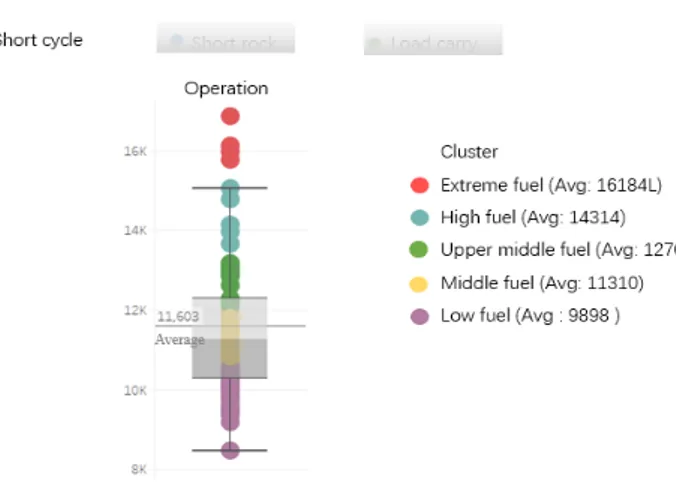
The first approach answered the need to obtain an overall indication of the general fuel consumption in different situations. According to the feedback from the testing, box-plots proved to be the most concise and easily understandable way of providing the overall picture of fuel performances. Therefore, box-plots were used to show a bird view of fuel performance as presented in Figure 4.
The advantage of Box-plots is that of depicting groups of data, bringing convenience for patterns exploration. The latter is further enabled by color-marked clusters to divide fuel performance, that in the case study corresponded to low, middle, upper-middle, high and extreme fuel consumption. For each cluster, the number of items and the average fuel consumption level were displayed to distinguish the clusters. Table 2 shows the cluster classification with the number of data points for each cluster and the average fuel consumption.
The cluster visualisation brings also the need to display the reasons for which the data differ between each other. In this case, the Box-plot proved not to be the most efficient and effective tool for communication. Approach 2 and Approach 3 were developed to display the data rationale respectively for the case in which a few data were available (such as for high or extreme fuel consumption) and in the case in which more data were available (i.e. low, middle, and upper-middle clusters).
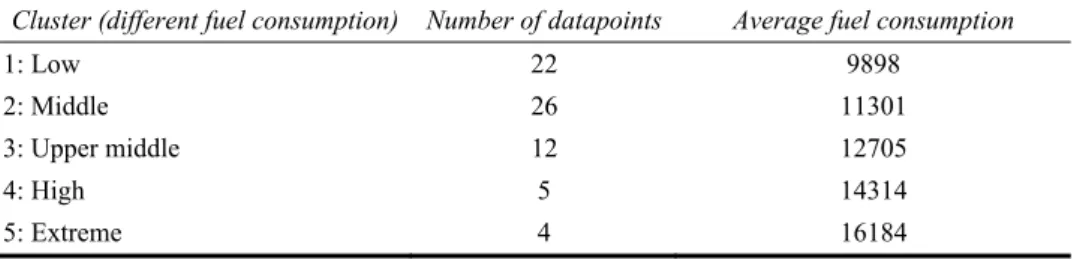
Table 2 Cluster classification with a number of data points and average fuel consumption
Cluster (different fuel consumption) Number of datapoints Average fuel consumption
1: Low 22 9898
2: Middle 26 11301
3: Upper middle 12 12705
4: High 5 14314
5: Extreme 4 16184
5.1.2 Approach two: patterns visualisation within a cluster with few data points
For the visualisation of patterns in a cluster with limited data available, a bar chart proved to be an efficient method to communicate results and collect insight from engineers. Figure 5 shows the cluster “extreme fuel consumption” marked in red for the type of operation named “Short cycle”. In this cluster, four items needed to be explored further, hence, a bar chart was applied to the underlying variables (as shown in Figure 6).
In this case, a combination of extreme road types (very rough and cross-country) combined with very hilly terrain, high curve density, and very high-speed changes explained the high fuel consumption.
Figure 6 Pattern exploration in a cluster with few data points using bar charts
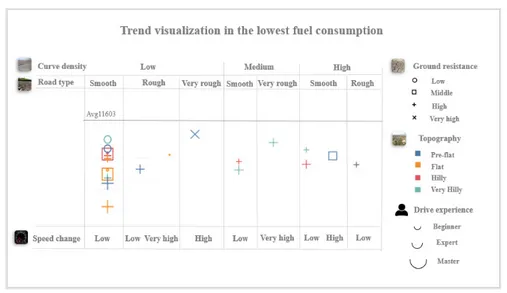
5.1.3 Approach three: patterns visualisation within a cluster with many data points
For the visualisation of the patterns in a cluster with more data available, the bar chart loses effectiveness. In the example shown in Figure 7, the cluster with the lowest fuel consumption was selected for visualisation. In this cluster, 22 data points needed to be visualised to explore trends and commonalities.
A scatter plot with an added horizontal line was selected as the best, allowing pattern tracking, particularly under the situation in which many underlying parameters contributed to a specific value point. As shown in Figure 7, a scatter plot was implemented combining the function of commonality exploring and trend tracking.
To make the visualisation concise and intuitive, various colors, symbols, and sizes were used. Besides, the average fuel consumption for all cases was represented in a horizontal line to provide a visual baseline reference.
In Figure 7, different dimensions of the symbols are applied to “Driver Experience”, respectively indicating visually the amount of experience of the driver (i.e. bigger symbol indicates higher experience). Figure 7 also shows that big and middle sizes are accounted for the majority of the data point and only 3 symbols are small. Thus, it is shown that in most cases of low fuel consumption, the machine is operated by a “master” or “expert” driver. Meanwhile, the three cases in small size symbols could be selected to further analyse in which conditions also the drivers recognised as “beginner” obtained low-fuel consumption. The disposition of the data points from the right to the left of the figure also visualises the variable “curve density” in relation to the external condition in which each data point was collected (e.g., around half of the cases are gathered in the left column of the figure, indicating low-curve density situations with smooth road type and low-speed changes).
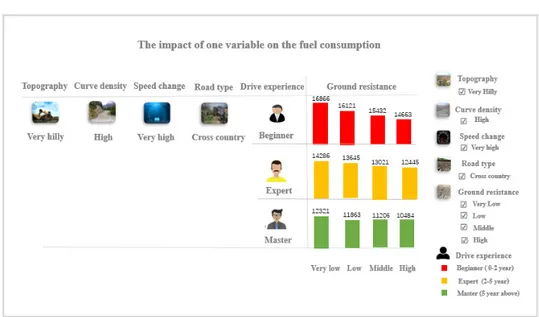
5.1.4 Approach four: patterns visualisation among different clusters
A Bar chart was used as a method for comparative visualisation to explore data patterns among the different clusters. In this visualisation, engineers had the possibility to select design parameters interactively to compare different fuel performances. In addition, the use of pictures representing each variable was adopted to address the problem of data interpretation.
As shown in Figure 8, the right-hand-side of the dashboard was used to filter different parameters, while the corresponding data information was presented on the left side of the dashboard. In Figure 8 the visualisation was used for multiple data pattern investigation, studying a situation in which topography, curve density, speed change, and road type do not vary, while the correlation between driver experience and ground resistance was under investigation.
6 The challenges of DDD implementation and reflections on the case study
The following sub-sections have the objective to describe the challenges emerged from the literature analysis and from the empirical study concerning the introduction of DDD models as supports for decision making in the product innovation process. Context dependency, data interpretation, information completeness, and individual cognitive limitations have emerged as relevant research area to be aware of when developing and implementing DDD models.
6.1 Context dependency
The “context independence” axiom (Holt, 1986), states that the preferential choice between two items is not determined by other choices that may be available. This means that, intuitively, if the intent of a new design is to develop a joint with the highest resistance to stress, the decision-makers will prefer the concept proving the highest resistance to stress during the simulation. Such axiom proved to be inconsistent in the presence of uncertainty in the data (a condition that is common in early design) since decision-makers often use models expressing the relative value of a concept based on the background and the local context of a decision (Tversky and Simonson, 1993). In some cases, the uncertainty can be mitigated by the reliability of the method that is applied for obtaining the data. This is the case, for instance, of computer-based finite element analysis, where well established and validated mathematical approaches are applied. The same cannot be said for models based on more immature data, which, therefore, increase uncertainty and risk. This situation firstly introduces the “trade-off contrast” effect, making a product to appear more or less attractive based on the other products available in the background. Secondly, it introduces the “extremeness aversion” effect, making extreme values relatively less attractive than intermediate values when making a decision (Tversky and Simonson, 1993).
The challenge with DDD models is, therefore, to be able to avoid the biases induced by previous experiences of the product, by trade-off contrast, and by extremeness aversion. These challenges raise two questions to be considered when developing DDD models in the presence of contextual dependency:
How can data analysis and visualisation mitigate the phenomenon of trade-off contrast?
What level of detail and precision is requested to a DDD model to effectively increase the perceived reliability of the output to avoid the extremes aversion effect? In the case study, the use of different levels of granularity of visualisation, starting
into the contribution of the single variables, is proposed as a method to increase the perception of the reliability of the output. This is because it allows the exploration of the rationale upon which the final results are built. As opposite, the trade-off contrast is a phenomenon intrinsic in the individual perception and no indications emerged in the case study on how to mitigate it.
6.2 Data interpretation
When making decisions, the interpretation of the value of a design alternative is relative to the standpoint of the different stakeholders involved in the decision. The design team needs to find an agreement about the relevant value criteria to consider and about the reliability of their assessment. Furthermore, decision-makers individually interpret and weight the information that is obtained from the data. The models provided to support the decisions need to be specific enough not to leave too much space to individual interpretation, and, at the same time, to be open for further analysis and investigation by decision-makers. This means that the models shall not be perceived as “black boxes”, rather they need to be understandable and transparent for the decision-makers to be able to judge the priority and the relevance given to the data. Such a challenge is similar to the one of contextual dependency but is based on the different individual interpretations of a model, caused by, for instance, decision-makers’ background, role, experience, or context in which the data are analysed and presented. This challenge raises the following question:
How can the figures/data/descriptions used in DDD models be visualised in order to be easily understood by engineers irrespectively from their individual role and background in the design team?
In the case study, the relatively little amount of data considered (19 variables for about 120 observations) did not request to deal with the problem of selecting which kind of data to bring into the analysis. The data mining algorithm was applied to the whole dataset to investigate correlations with fuel consumption and the variables that did not have any specific impact were automatically excluded. However, predictions were made on the basis of multilinear regression analysis which created models that can be likened to “black boxes”, thus providing the final results but not the logic of the calculation. A recent work by Dasari et al. (2019) proposed the use of Random Forest models to avoid the problem of “black box” models in early product development. In their work, they have proved tree models to be as good as regression models in the prediction of the results while maintaining a clear structure on the logic of the calculation.
To deal with the different backgrounds of the members of the design team, a number of visual clues and icons were implemented in the visualisation interface with the aim of making the meaning of every single variable as intuitive as possible for the users. For instance, small icons, in the form of an image, visualised the characteristic of the different road types and of the different site topographies, to facilitate an agreement on the meaning of a variable.
6.3 Information completeness
Earlier in the design process the decision is made, lower is the availability of information that can be used to base such decision upon (Ullman, 1992). DDD models need to cope
with intrinsic information incompleteness. This creates a trade-off between the range and the accuracy of data collection and the effectivity of the analysis. In other words, the data need to encompass multidimensional aspects, be manageable by the users, and, ultimately, they need to cope with the risk of providing a sense of accuracy in the evaluation when this is not present. Two questions are raised concerning information completeness:
How can relevant datasets be identified and how those can be validated prior to the analysis?
How can the results be visualised to mitigate the risk of providing a false sense of accuracy?
In the case study, the dimension of the data set was relatively limited. The major questions on the dataset identification consisted in establishing the contextual variables that were worth integrating into the analysis (the right column in Table 1). The list of variables was defined based on the work by Cronholm (2013) and further refined through interviews with company experts, but no specific validation process for the variables was done prior to the analysis. To address the risk of providing a false sense of accuracy while clustering and visualising results with many data points, a decision was made to allow the exploration of patterns while, at the same time, integrating the visualisation of every single data point (as shown in Figure 7). This rendered a visual indication of the density of data points building up the score for a specific combination of variables. Figure 7 shows, for instance, that only one data point was present for a combination of very high-speed changes, medium curve density, very rough road type, irrespectively from ground resistance, topography, and driver experience. As opposite many data points were available in the case of smooth road type, low curve density, and low-speed change, making more realistic to perform performance comparison in such a context.
6.4 Individual cognitive limitation
Individuals naturally present limited cognitive capabilities to rationally and logically analyse and manage a high amount of information in a short time. Research in information design discusses the issue of cognitive fixation, concerning the analysis, planning, presentation, and understanding of a message (Pettersson, 2010). The choice of the information design strategy to use to inform decision-makers determines how accessible the information is and how clear the communication will be. In this sense, an effective information design allows individuals to capture patterns and relationships not easily deduced otherwise (Meirelles, 2013). This challenge leads to the formulation of a research question related to the role of visualisation in the product innovation process: How can the visualisation of results and rationale of DDD models evolve all along
the product innovation process to deal with the limitation of the individual cognitive capability?
The four approaches for visualisation proposed in the case study aimed to contribute to the dynamic evolution of the visualisation techniques based on the different needs in the stages of the product innovation process. However, the contribution of the case study is limited to the concept screening and trade-off phase and was not extended to the identification of emerging designs or to the product value stream.
7 Discussion
The Internet of Things and the increasingly reducing cost barriers of information communication technologies are creating unprecedented opportunities to benefit from large scale data collection and analysis in a variety of contexts. Machine learning and data mining are applied to investigate hidden correlations in data, although their potential impact as enablers for product innovation has not been exploited. The academic discussion about the application of such techniques to build models in design and development is still in its infancy and established approaches and evident case studies are missing. While some cases are presented in literature, there is limited discussion about the role of such models in respect both to the innovation process and to the decision-making process.
The paper builds on such gap, analysing the possibility of exploiting data science in the product innovation process from a multidisciplinary perspective, building a parallel among the research fields dealing with lean product and service innovation (Kennedy et al., 2008), model-based decision making (Wierzbicki et al., 2000), and visualisation and individual cognitive behavior in decision making (e.g., Severin, 1967; Tegarden, 1999).
The proposed framework can be seen as a support, for the transition toward a more “intense” decision-making process in engineering design. It highlights which data-driven activities are needed at the different stages of the innovation process, focusing, at the same time, on what types of decisions can be supported and on what is the role of visualisation in such decision making moments.
The focus on the role of visualisation emerged as highly relevant in an engineering context in which data science is often outside the portfolio of competencies of the designers and of the innovation experts. The problem of understanding the models, their logic, and their reliability, has been raised by many authors in the engineering design community (e.g., Johansson et al., 2011; Dasari et al., 2019), thus the improvement of the understanding through suitable visualisation techniques becomes a necessary part of a DDD framework. To this concern, the challenges in DDD implementation presented in Section 6 want to define a preliminary list of research questions that emerged as relevant during the research, with a special focus on the necessity to visualise the data in a consistent manner to deal with the problem of comprehensibility of the models.
The case study described represents an instantiation of the framework in a real industrial case. It provides an example of an application of the framework encompassing also the experimental activity concerning the test of different visualisation techniques. In the case study, the use of the framework was meant to build complementary knowledge to support the development of a construction equipment. This was obtained by first collecting and structuring the data from the machine and the operating environment, and later using them to build estimation models (following the process in the Knowledge Value Stream visualised in Figure 2). In this case, DDD was used to better understand how the machine behaved in a real operational scenario, by including contextual variables that affected the overall machine performances but that were difficult to predict beforehand. Doing so, unexpected performance behaviors of the current machine, measured in specific conditions, could be discovered, and the knowledge gained through data collection and analysis could be used in the design of a new machine by building more reliable performance estimation models.
From a business perspective, the application of the framework is conditioned to the possibility of collecting and analysing data. To this concern, the “servitisation” of manufacturing, promoting an increased combination of Product-Service Systems (PSS) offers, opens a spectrum of opportunities for data collection. PSS often imply that the manufacturer retains the ownership of a product along its lifecycle, including maintenance, repair, and dismissal, thus allowing easier access to the lifecycle data. In the case study, this translates into being able to monitor and follow the performance of a construction equipment along with its operational life, collecting information about its use in different operating conditions, with the ultimate goal to design of a generations of such machines.
Ultimately, the paper wishes to provide a reference to further investigate the benefits of DDD to push forward the state-of-the-art and the state-of-the-practice. With this objective, a number of research activities are running to expand the research findings, focusing on the following directions:
The integration and the study of the effectiveness of interactive visualisation capabilities in an immersive environment for decision making, the so-called Model-Driven Decision Arena as presented by Bertoni et al. (2018).
The collection of data from scaled prototypes (both in terms of machines and environment) to simulate different operating scenarios prior to the commitment of a large amount of capital in the realisation of a full-scale prototype.
The use of data-driven design models to explore a larger design space by identifying and including needs from different stakeholders.
The refinement of the data-driven models to better deal with cognitive limitations in analysis, reasoning, and presentation, investigating how to apply data analysis and visualisation to support requirements definition, in combination with traditional engineering approaches.
8 Conclusion
The paper has presented a framework for data-driven design in the product innovation process, linking the literature related to model-based decision making to the recent applications of data mining and machine learning in engineering design. The framework has been proposed to highlight how and when extensive data analysis can contribute to the product innovation process, how DDD models are positioned in reference to the theory of model-based decision making, and what is the role of visualisation as an enabler for data-driven decision making. A case study on the design of construction equipment has been presented to exemplify the application of the framework in a real industrial case. From this, a visualisation prototype consisting of four approaches has been proposed to provide references for data visualisation in different visual scenes. Finally, the paper defined a list of challenges related to DDD implementation and discussed the potential of the proposed framework as an enabler for product innovation in a product-service system context.
Acknowledgements
The research leading to these results has received financial support by the Swedish Knowledge and Competence Development Foundation (Stiftelsen för kunskaps – och kompetensutveckling) through the Model Driven Development and Decision Support research profile at Blekinge Institute of Technology.
References
Agard, B. and Kusiak, A. (2004) ‘Data-mining-based methodology for the design of product families’, International Journal of Production Research, Vol. 42, No.15, pp.2955–2969. Anand, S.S. and Büchner, A.G. (1998) ‘Decision support using data mining. Financial Times
Management.
Bae, J.K. and Kim, J. (2011) ‘Product development with data mining techniques: a case on design of digital camera’, Expert Systems with Applications, Vol. 38, No. 8, pp.9274–9280.
Bai, X., White, D. and Sundaram, D. (2011) ‘Purposeful visualization’, Proceeding of the 44th
Hawaii International Conference on System Sciences (HICSS’11), Hawaii, pp.1–10.
Bertoni, A. (2018) ‘Role and challenges of data-driven design in the product innovation process’,
IFAC-PapersOnLine, Vol. 51, No. 11, pp.1107–1112.
Bertoni, A., Bertoni, M. and Isaksson, O. (2013) ‘Value visualization in product service systems preliminary design’, Journal of Cleaner Production, Vol. 53, pp.103–117.
Bertoni, A., Larsson, T., Larsson, J. and Elfsberg, J. (2017) ‘Mining data to design value: A demonstrator in early design’, DS 87-7 Proceedings of the 21st International Conference on
Engineering Design (ICED’17), Design Theory and Research Methodology, Vancouver,
Canada, Vol 7, pp.21–29.
Bertoni, M., Wall, J. and Bertoni, A. (2018) ‘Model-driven decision arena: an aerospace case study’, Proceedings of the 15th International Design Conference, pp.171–182.
Chaklader, R. and Parkinson, M.B. (2017) ‘Data-driven sizing specification utilizing consumer text reviews’, Journal of Mechanical Design, Vol. 139, No. 11.
Christensen, C. (2013) The Innovator's Dilemma: When New Technologies Cause Great Firms to
Fail, Harvard Business Review Press.
Cronholm, K. (2013) ‘Design of experiment based on VMEA (variation mode and effect analysis)’,
Procedia Engineering, Vol. 66, pp.369–382.
Cutbill, A. and Wang, G.G. (2016) ‘Mining constraint relationships and redundancies with association analysis for optimization problem formulation’, Engineering Optimization, Vol. 48, No. 1, pp.115–134.
Dasari, S.K., Cheddad, A. and Andersson, P. (2019) ‘Random forest surrogate models to support design space exploration in aerospace use-case’, Proceedings of the IFIP International
Conference on Artificial Intelligence Applications and Innovations, Springer, Cham,
pp.532–544.
Davies, A. (2004) ‘Moving base into high-value integrated solutions: a value stream approach’,
Industrial and Corporate Change, Vol. 13 No. 5, pp.727–756.
Endsley, R. (1995) ‘Toward a theory of situation awareness in dynamic systems’, Human Factors, Vol. 37, No. 1, pp.32–64.
Fayyad, U. and Stolorz, P. (1997) ‘Data mining and KDD: promise and challenges’, Future
Generation Computer Systems, Vol. 13, Nos. 2/3, pp.99–115.
Fels, A., Briele, K., Ellerich, M. and Schmitt, R. (2018) ‘Extracting customer-related information for need identification’, Proceedings of the International Conference on Human Systems
Flanagan, T., Eckert, C. and Clarkson, P.J. (2007) ‘Externalizing tacit overview knowledge: a model-based approach to supporting design teams’, AI EDAM, Vol. 21, No. 3, pp.227–242. Fraley, C. and Raftery, A.E. (2002) ‘Model-based clustering, discriminant analysis, and density
estimation’, Journal of the American Statistical Association, Vol. 97, pp.611–631.
Freitas, A.A. (2014) ‘Comprehensible classification models: a position paper’, ACM SIGKDD
Explorations Newsletter, Vol. 15, No. 1, pp.1–10.
Gautam, N. and Singh, N. (2008) ‘Lean product development: maximizing the customer perceived value through design change (redesign)’, International Journal of Production Economics, Vol. 114, No. 1, pp.313–332
Geng, X., Chu, X. and Zhang, Z. (2012) ‘An association rule mining and maintaining approach in dynamic database for aiding product-service system conceptual design’, The International
Journal of Advanced Manufacturing Technology, Vol. 62, Nos. 1/4, pp.pp.1–13.
Holt, C.A. (1986) ‘Preference reversals and the independence axiom’, The American Economic
Review, Vol. 76, No. 3, pp.508–515.
Isaksson, O., Bertoni, M., Hallstedt, S. and Lavesson, N. (2015) ‘Model based decision support for value and sustainability in product development’, DS 80–1 Proceedings of the 20th
International Conference on Engineering Design, pp.21–30.
Jiang, H., Kwang, C.K. and Yung, K.L. (2017) ‘Predicting future importance of product features based on online customer reviews’, Journal of Mechanical Design, Vol. 139, No. 11.
Jiang, H., Kwong, C.K., Park, W.Y. and Yu, K.M. (2018) ‘A multi-objective PSO approach of mining association rules for affective design based on online customer reviews’, Journal of
Engineering Design, Vol. 29, No. 7, pp.381–403.
Jin, J., Liu, Y., Ji, P. and Liu, H. (2016) ‘Understanding big consumer opinion data for market-driven product design’, International Journal of Production Research, Vol. 54, No. 10, pp.3019–3041.
Johansson, C., Hicks, B., Larsson, A.C. and Bertoni, M. (2011) ‘Knowledge maturity as a means to support decision making during product-service systems development projects in the aerospace sector’, Project Management Journal, 42, No. 2, pp.32–50.
Johnsson, M. (2017) ‘How understanding of agile innovation work affects innovation teams’,
ISPIM Innovation Summit, Melbourne, pp.1–11.
Johnsson, M. (2018) ‘The innovation facilitator: characteristics and importance for innovation teams’, Journal of Innovation Management, Vol. 6, No. 2, pp.12–44.
Joly, M., Sarkar, S. and Mehta, D. (2019) ‘Machine learning enabled adaptive optimization of a transonic compressor rotor with precompression’, Journal of Turbomachinery, Vol. 141, No. 5.
Kastensson, A. and Johansson, C. (2011) ‘Decision making in gates: based on formal basis or gut feeling’, International Journal of Technology Intelligence and Planning, Vol. 7, No. 2, pp.140–152.
Kelley, T.A. (2001) The art of innovation: lessons in creativity from IDEO, America’s leading design firm, (Vol. 10), Broadway Business.
Kennedy, M., Harmon, K. and Minnock, E. (2008) Ready, set, dominate – Implement Toyota’s
Set-Based Learning for Developing Products and Nobody Can Catch You, The Oaklea Press,
Richmond.
Kim, H., Liu, Y., Wang, Y. and Wang, C. (2016) ‘Special issue: data-driven design (d3)’,
Journal of Mechanical Design, Vol. 138, No. 12.
Klein, G.A. (1989) ‘Strategies of decision making’, Military Review, pp.56–64.
Kusiak, A. (2006) ‘Data mining: manufacturing and service applications’, International Journal of
Production Research, Vol. 44, Nos. 18/19, pp.4175–4191.
Lei, N. and Moon, S.K. (2013) ‘A decision support system for market segment driven product design’, DS 75-9: Proceedings of the 19th International Conference on Engineering Design
Li, J., He, S. and Martins, J.R. (2019) ‘Data-driven constraint approach to ensure low-speed performance in transonic aerodynamic shape optimization’, Aerospace Science and
Technology, Vol. 92, pp.536–550.
Liao, S.H., Chen, Y.J. and Deng, M.Y. (2010) ‘Mining customer knowledge for tourism new product development and customer relationship management’, Expert Systems with
Applications, Vol. 37, No. 6, pp.4212–4223.
Liao, S.H., Hsieh, C.L. and Huang, S.P. (2008) ‘Mining product maps for new product development’, Expert Systems with Applications, Vol. 34, No. 1, pp.50–62.
Lin, K.Z. and Chiu, M.C. (2017) ‘Utilizing text mining and kansei engineering to support data-driven design automation’, Advances in Transdisciplinary Engineering, Vol. 5, pp.949–958. Lützenberger, J., Klein, P., Hribernik, K. and Thoben, K.D. (2016) ‘Improving product-service
systems by exploiting information from the usage phase’, A Case Study: Procedia CIRP, Vol. 47, pp.376–381.
Ma, H., Chu, X., Lieu, G. and Xuan, D. (2017) ‘An integrated approach for design improvement based on analysis of time-dependent product usage data’, Journal of Mechanical Design, Vol. 139, No. 11.
Ma, J. and Kim, H.M. (2016) ‘Product family architecture design with predictive, data-driven product family design method’, Research in Engineering Design, Vol. 27, No. 1, pp.5–21. Ma, J., Kwak, M. and Kim, H.M. (2014) ‘Demand trend mining for predictive life cycle design’,
Journal of Cleaner Production, Vol. 68, pp.189–199.
Manyika, J., Chui, M., Brown, B., Bughin, J., Dobbs, R., Roxburgh, C. and Byers, A.H. (2011) Big
data: The next frontier for innovation, competition (Vol. 7). and productivity, Technical
report, McKinsey Global Institute.
Meirelles, I. (2013) Design for Information: An Introduction to the Histories, Theories, and Best
Practices Behind Effective Information Visualizations, Rockport publishers.
Miller, D. and Hartwick, J. (2002) ‘The problem of solutions: balancing clients and capabilities’,
Business Horizons, March/April, pp.3–12.
Ng, I., Parry, G., Smith, L., Maull, R. and Briscoe, G. (2012) ‘Transitioning from a goods-dominant to a service-goods-dominant logic: visualising the value proposition of Rolls-Royce’,
Journal of Service Management, Vol. 23, No. 3, pp.416–439.
O’Connor, G.C. and McDermott, C.M. (2004) ‘The human side of radical innovation’, Journal of
engineering and Technology Management, Vol. 21, Nos. 1/2, pp.11–30.
Pajo, S., Vandevenne, D. and Duflou, J.R. (2015) ‘Systematic online lead user identification-case study for electrical installations’, DS 80-10 Proceedings of the 20th International Conference
on Engineering Design (ICED’15), Vol 10: Design Information and Knowledge Management
Milan, Italy.
Pettersson, R. (2010) ‘Information design-principles and guidelines’, Journal of Visual Literacy, Vol. 29, No. 2, pp.167–182.
Quintana-Amate, S., Bermell-Garcia, P., Balcazar, L. and Tiwari, A. (2015) ‘A new knowledge sourcing framework to support KBE development’, DS 80-8 Proceedings of the 20th
International Conference on Engineering Design (ICED’15), Vol. 8: Innovation and
Creativity, Milan, Italy.
Schwaab, K. (2015) ‘The fourth industrial revolution: what it means, how to respond’, Foreign
Affairs, Vol. 12.
Severin, W. (1967) ‘Another look at cue summation’, Educational Technology Research and
Development, Vol. 15, No. 3, pp.233–245.
Simon, H.A. (1996) The Science of the Artificial, MIT Press, Boston.
Song, B., Yan, B., Triulzi, G., Alstott, J. and Luo, J. (2019) ‘Overlay technology space map for analyzing design knowledge base of a technology domain: the case of hybrid electric vehicles’, Research in Engineering Design, Vol. 30, No. 3, pp.405–423.