Official URL
DOI :
https://doi.org/10.1109/ICIP.2019.8803032
Any correspondence concerning this service should be sent
to the repository administrator:
tech-oatao@listes-diff.inp-toulouse.fr
This is an author’s version published in:
http://oatao.univ-toulouse.fr/24917
Open Archive Toulouse Archive Ouverte
OATAO is an open access repository that collects the work of Toulouse
researchers and makes it freely available over the web where possible
To cite this version: Malon, Thierry and Chambon, Sylvie and
Charvillat, Vincent and Crouzil, Alain Estimation of correspondent
trajectories in multiple overlapping synchronized videos using
correlation of activity functions. (2019) In: IEEE International
Conference on Image Processing (ICIP 2019), 22 September 2019 - 25
September 2019 (Taipei, Taiwan, Province Of China).
ESTIMATION OF CORRESPONDENT TRAJECTORIES IN MULTIPLE OVERLAPPING
SYNCHRONIZED VIDEOS USING CORRELATION OF ACTIVITY FUNCTIONS
Thierry Malon, Sylvie Chambon, Vincent Charvillat, Alain Crouzil
IRIT, Université de Toulouse, Toulouse, France
ABSTRACT
We present an approach for ranking a collection of videos with overlapping fields of view. The ranking depends on how they allow to visualize as best as possible, i.e. with significant details, a trajectory query drawn in one of the videos. The pro-posed approach decomposes each video into cells and aims at estimating a correspondence map between cells from differ-ent videos using the linear correlation between their functions of activity. These latter are obtained during a training session by detecting objects in the videos and computing the cover-age rate between the objects and the cells over time. The main idea is that two areas from two different videos that systemat-ically offer presence of objects simultaneously are very likely to correspond to each other. Then, we use the correspondence between cells to find the reformulated trajectory in the other videos. Finally, we rank the videos based on the visibility they offer. We show promising results by testing three aspects: the correspondence maps, the reformulation and the ranking.
Index Terms— Trajectory reformulation, video surveil-lance, multiple views, overlapping fields of view, matching
1. INTRODUCTION
The multiplication of multimedia devices allowing to record videos raises new challenges. Nowadays, it is easy to find multiple videos from the same event. Multiple views with overlaps offer a richer understanding of the scene compared to single view. However, manually watching each video is a long and tedious task. Consequently, there is a need in helping users to easily navigate through a collection of videos.
In recent years, numerous works proposed approaches to tackle the challenge of easing multiple video visualization. When camera calibration parameters are known and numer-ous images of the scene are available, a static 3D reconstruc-tion of the scene can be obtained by detecting and matching keypoints [1]. To incorporate the temporal aspect of syn-chronized videos, [2] proposed a 4D reconstruction of the scene with both the static parts and also the dynamic parts that are moving over time. These reconstructions capture ele-ments from multiple viewpoints and thus provide a good over-all representation and understanding of the scene. However, they cannot always be performed as they require camera
cali-bration parameters and low viewpoint variations between the cameras. When 3D reconstruction is not feasible, navigation through videos by switching over time to the one that best de-scribes the scene was investigated. In [3], scores are attributed to each view using the activity of the objects, their size, loca-tion and number, as well as particular events occurring. The higher the score, the most interesting the view. In this paper, we suppose that calibration, and so 3D reconstruction, is not possible, due to uncontrolled acquisition of the videos.
In video surveillance, investigators generally have hun-dreds of cameras to process, some of which can present over-laps in their fields of view. To navigate through the videos, they want to be able to manually formulate a query on ele-ments of interest and choose among a ranked list of videos that match the query. When dealing with overlapping videos, in [4], the user can query a region of interest of the current video and be redirected to the video that offers the best en-tropy regarding the objects contained in the queried region.
For cases where the camera views are disjoint, the authors of [5] proposed to jointly compute the camera network topol-ogy and the re-identification. They iteratively refine topoltopol-ogy by using re-identification and reversely. In the same context, [6, 7] proposed to study the structure of the camera network by estimating links between the disjoint cameras and the time delay between them. They cut each view into cells, measure the activity over time of each cell using a training set made of videos with detections and then merge cells with similar ac-tivity into regions. Their Cross Canonical Correlation Anal-ysis applied to functions of activity showed good results for estimating the spatial and temporal topology inference of a camera network. Consequently, we propose to estimate cor-respondences between multiple videos presenting overlaps by using functions of activity inspired by this measure.
Most approaches based on multiple cameras with over-lapping fields of view suppose that it is possible to estimate the camera calibration parameters. In general cases, i.e. with videos from surveillance cameras combined with smartphone videos, it becomes difficult to have a reliable estimation of these parameters. In this work, we do not compute calibration parameters. As far as we are concerned, in the same context, we can cite [8] where the lines of view of cameras present-ing overlapppresent-ing fields of view are retrieved from a trainpresent-ing set of videos by detecting the point on the ground plane of a
(a)
(b)
Input For each video For each video For each video pair
(c)
(d)
Input (user query)
(e)
Output
1 2
3
(f)
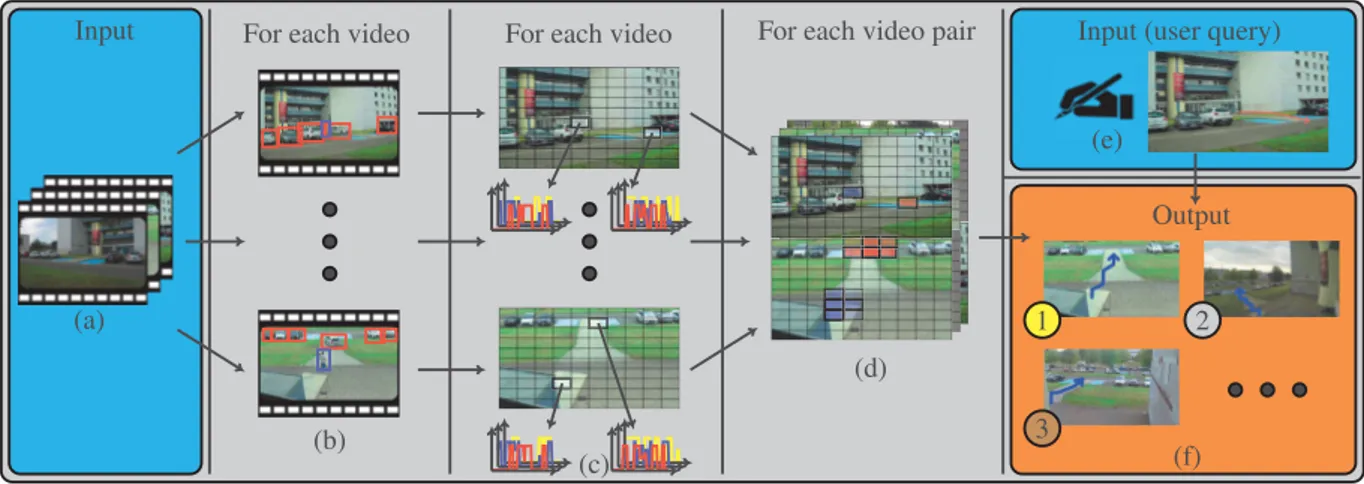
Fig. 1: General overview of the approach: (a) Collection of videos as input, (b) detection of objects and categories, (c) functions of activity computing, (d) correspondence maps computing, (e) user trajectory query, (f) video ranking based on visibility score.
detected object in a view at the moment when it appears in another view. In this paper, we also use a training phase.
The main contribution of this paper is to propose a new approach for reformulating a trajectory query drawn in one view into its corresponding trajectories in other overlapping views, and then for ranking these views regarding the visi-bility of the scene they offer. We first introduce functions of activity for estimating correspondence maps between video pairs. Then, when a user draws a query trajectory in one video, we propose a reformulation score to find the corre-sponding trajectories in the other overlapping videos. Finally, we define a visibility score to rank these matched videos re-garding how spread the trajectories are in each video as we assume that the longer the trajectory, the more interesting the view, i.e. the view shows more details about the trajectory than the initial view.
2. PROPOSED METHODOLOGY
We suppose that the videos are shot from static viewpoints and are temporally synchronized, i.e. that they start at the same timestamp and have the same duration. We have no cal-ibration parameters. The approach consists of the following steps, see Figure 1. For each video, see (a), we first detect the objects of interest and assign them a category, see (b) where red bounding boxes belong to vehicle and the blue one to a pedestrian, which can be done using ROLO [9]. Then, in (c), we decompose each view into cells (the grid on the figure), and associate to each cell a function of activity per object cat-egory defined as its occupation rate over time. Then, for each video pair, in (d), we assign to each cell of the first video a correspondence map regarding the correlation of its occupa-tion rate over time (two particular cells are highlighted in the top view as well as their corresponding cells in the bottom view). Our main idea is that, if two cells from two
differ-ent synchronized cameras are systematically simultaneously occupied, they are likely to correspond to the same 3D po-sition. Thus, when drawing a query trajectory in a view, in (e) (the red bold line), we list the cells crossed by this query and look for the corresponding cells in the other view. For each other view, the reformulated trajectory is obtained using the sequence of cells that has the best reformulation score, defined as a trade-off between maximizing correspondences and minimizing the distances between consecutive cells. A ranking of the videos about the visibility of the trajectory is finally returned in (f) based on the reformulation score and the visibility of the reformulated trajectory.
2.1. Correspondence maps
In this section, we define the notion of function of activity and how we compute the correspondence map from a region in one videos to its corresponding regions in another video.
Let V1and V2be two temporally synchronized camera views
with overlapping fields of view. We note dVω(t) the
ensem-ble of detections containing all the objects of category ω that are detected at time t in video V , used to learn the correspon-dence maps. As clusters of close pixels generally correspond
to the same region, we divide each view V into N cells cV
i of
identical size. The impact of N is measured in Section 3. The function of activity of category ω in a view V ,
de-noted aV,ωi , is the recovery rate of the cell by the detections of
category ω objects dV
ω over time. Note that each cell has one
function of activity per category of object (see Figure 1.(c)). We define the correspondence rate of category ω between two cells of two different videos as:
Cω(cV 1,ω i , c V2,ω i′ ) = max(0, corr(a V1,ω i , a V2,ω i′ )) (1)
two random variables. For each cell cV1,ω
i , we also define a
correspondence mapCω(cV
1,ω
i , V2) containing the
correspon-dences between cV1,ω
i and all the cells of V2. Figure 1.(d)
illustrates the correlation maps: a pair of views is depicted, and two cells are highlighted in blue and red (respectively for categories "person" and "car") in the top video. The bottom view shows another video with the correspondence maps of the two cells. The main idea for matching cells is that corre-sponding cells are expected to present correlated functions of activity. In fact, it is unlikely that a pair of non corresponding cells systematically presents the same activity over time. 2.2. Trajectory reformulation
We propose a trajectory reformulation scheme relying on the cell correspondences. A trajectory is defined as a succession
of connected 2D segments.We extract the sequenceS of M
cells(ci1, ..., ciM) that are crossed by the segments with no
consecutive identical cells.
To find the corresponding trajectory, we want to find the
successive indices of the cells in the other view(i′
1, ...,i′M)
that maximize the sum of the correlations with the successive crossed cells while ensuring a continuity in the reformulated trajectory. To this end, we penalize successive correspond-ing cells that are not adjacent regardcorrespond-ing their distance and we
define the reformulation score of the sequence of cellsS
be-tween views V1and V2as:
argmax (i′1,...,i′ M) 1 M M P k=1 Cω(cVik1, c V2 i′ k) 1 +M −1P k=1 max(0, ||i ′k− i′k+1|| − 1) (2)
The numerator favors cells of V2that have a good activity
correlation with the cells crossed by the query in V1while the
denominator penalizes consecutive cells that are not adjacent in the reformulated trajectory. We obtain the reformulated tra-jectory in the other view by joining the centers of the sequence
of cells of index(i′
1, ...,i′M).
2.3. Selection and ranking of videos
In this section, we explain the proposed method for select-ing the videos that are related to the queried view and rank-ing them regardrank-ing the visibility of the reformulated trajectory they offer. As stated before, investigators often have to treat dozens of videos at once. When focusing on a particular lo-cation, they may want to automatically navigate between the videos of the same scene, i.e. views presenting overlaps. It is very unlikely that a view with no overlap with the queried view contains any region presenting correlated activity with a region of the queried view for the whole duration. Thus, views where the trajectory query cannot be reformulated suf-fer from a low reformulation score and can be filtered using a
threshold σ. The remaining reformulated trajectories are then ranked regarding their visibility score that we define as the product of their total length and their reformulation score. We choose these criteria because we suppose that the longer the trajectory, the higher the number of details that can be seen.
3. EXPERIMENTS
We want to evaluate the quality of the correspondence maps, the trajectory reformulation and the ranking of the views that offer a better visualization. We used the ToCaDa dataset [10]. It contains 25 videos in which about 30 objects of 3 cate-gories (person, motorcycle and car) are present. Among all the videos, 15 views present large overlaps while the others are shooting non overlapping areas. The videos are tempo-rally synchronized and have the same duration (≈5 minutes). We first evaluate the quality of the correspondence maps between the 15 videos with overlaps by measuring how much the objects that cover cells of a video also covers the corre-sponding learned cells in the other videos. For each pair of
videos (V1, V2), we list the objects that simultaneously appear
in both videos and compute all the bounding boxes at times of simultaneous presence. Then, we define the correspondence
rate between each pair B1and B2of simultaneous bounding
boxes of a same object of category ω seen in V1and V2:
X (cV1 ,ωi ,c V2 ,ω j ) |cV1,ω i ∩ B1| |B1| |cV2,ω j ∩ B2| |B2| Cω(cVi1,ω, c V2,ω j ) ||C(cV1,ω i , V2)|| (3)
The first term evaluates how the bounding box in the first
cam-era is covered by the cell cV1,ω
i whereas the second term
eval-uates the same aspect for the corresponding cell cV2,ω
j with
the corresponding bounding box in the second camera. The last term is related to equation (1). The mean correspondence rate is obtained by averaging over all simultaneous bounding boxes of a same object, over all objects in a pair of videos and over every pair of videos. We used the provided category labels, detection and tracking of the bounding boxes of the ob-jects in each view to compute the correspondence maps of the cells. Figure 3 presents the correspondence rates for different setups and different number of cells. We tried to evaluate the behavior of the method when categories are not distinguished, when adding a temporal desynchronization of one second be-tween each pair of videos or when training is done on only half of the dataset. As expected, the results reveal that this step is quite sensible to perturbations. Also, distinguishing between the categories widely improves the correspondence map rate. Note that we do not expect high correspondence rates as the correspondence map of one cell in a video gener-ally covers a large amount of cells in the other videos. How-ever, we expect that this correspondence rate is sufficient for the next step evaluated: the quality of the reformulation.
Fig. 2: Best views ranking. 1st column: three trajectory queries are drawn in red, respectively for categories human, moto and car. 2nd to 4th columns: the top 3 views that offer both a high visibility score and where the reformulated trajectory occupies most space are returned in descending order. 5th column: an overlapping view with a low rank.
We drew 10 trajectory queries at the ground level in differ-ent overlapping views and applied the proposed reformulation method. To estimate a corresponding trajectory of reference, i.e. to be compared with, we computed the homographies be-tween the ground plane of each pair of overlapping views by using the corners of the blue parking space. Then, we mea-sured the Dynamic Time Warping (DTW) distance [11], in pixels, between the two trajectories (obtained by applying the homography and using our method). Figure 4 presents the
mean DTW distance on videos of size 960× 540 for
differ-ent numbers of cells. Again, as expected, the reformulation becomes reliable when the number of cells raises and these results validate the quality of the proposed reformulation.
For the best view ranking, the views that present no over-lap with other videos are correctly filtered when using σ = 0.3 as almost no correspondence can be learned due to the absence of systematic simultaneous presence of objects. Fig-ure 2 presents the top 3 best views proposed for different tra-jectory queries drawn in different views. An overlapping view with a low visibility score is also presented and mostly cor-responds to views where the trajectory is not fully visible or short due to the viewpoint of the camera. Among the top 5 views returned on our 10 trajectory queries, 72% of the views give as much as or more visibility to the trajectory.
4. CONCLUSION
From a collection of videos with no calibration, the proposed method allows to successfully rank a subset of videos that present overlaps in their fields of view regarding the visibility they offer of a trajectory query. Future work may deepen this method by relaxing the constraint of synchronization and es-timating the time delay between different videos, using pho-tometric information of the objects and exploiting the neigh-borhood of the cells to compute the correlation maps.
0 10 20 30 40
0 0.2 0.4 0.6
Number of cells per axis
Mean
correspondence
rate baselinenoctg
desync lowtrn
Fig. 3: Mean correspondence rate on the ToCaDa dataset [10] for different number of cells and different setups: baseline, without distinguishing the categories (noctg), with a 1 second desynchronization between the videos (desync) and training on only half the dataset (lowtrn).
0 10 20 30 40
60 80 100
Number of cells per axis
Mean
reformulation
distance
(px)
Fig. 4: Mean reformulation DTW distance in pixels for dif-ferent number of cells.
5. REFERENCES
[1] S. Agarwal, N. Snavely, I. Simon, S. M. Seitz, and R. Szeliski, “Building Rome in a day,” in IEEE In-ternational Conference on Computer Vision, 2009. [2] A. Mustafa, H. Kim, J.-Y. Guillemaut, and A. Hilton,
“Temporally coherent 4D reconstruction of complex dy-namic scenes,” in IEEE Conference on Computer Vision and Pattern Recognition, 2016.
[3] F. Daniyal, M. Taj, and A. Cavallaro, “Content and task-based view selection from multiple video streams,” Mul-timedia tools and applications, 2010.
[4] A. Carlier, L. Calvet, P. Gurdjos, V. Charvillat, and W. T. Ooi, “Querying multiple simultaneous video streams with 3D interest maps,” in Visual Content Indexing and Retrieval with Psycho-Visual Models. 2017.
[5] Y.-J. Cho, S.-A. Kim, J.-H. Park, K. Lee, and K.-J. Yoon, “Joint person re-identification and camera net-work topology inference in multiple cameras,” Com-puter Vision and Image Understanding, 2019.
[6] C. C. Loy, T. Xiang, and S. Gong, “Time-delayed corre-lation analysis for multi-camera activity understanding,” International Journal of Computer Vision, 2010. [7] C. C. Loy, T. Xiang, S. Gong, et al., “Incremental
activ-ity modeling in multiple disjoint cameras,” IEEE Trans-actions on Pattern Analysis and Machine Intelligence, 2012.
[8] S. Khan and M. Shah, “Consistent labeling of tracked objects in multiple cameras with overlapping fields of view,” IEEE Transactions on Pattern Analysis and Ma-chine Intelligence, 2003.
[9] G. Ning, Z. Zhang, C. Huang, X. Ren, H. Wang, C. Cai, and Z. He, “Spatially supervised recurrent convolutional neural networks for visual object tracking,” in IEEE In-ternational Symposium on Circuits and Systems, 2017. [10] T. Malon, G. Roman-Jimenez, P. Guyot, S.
Cham-bon, V. Charvillat, A. Crouzil, A. Péninou, J. Pinquier, F. Sèdes, and C. Sénac, “Toulouse campus surveillance dataset: scenarios, soundtracks, synchronized videos with overlapping and disjoint views,” in ACM Multi-media Systems Conference, 2018.
[11] Z. Zhang, K. Huang, and T. Tan, “Comparison of
similarity measures for trajectory clustering in outdoor surveillance scenes,” in IEEE International Conference on Pattern Recognition, 2006.