Official URL: https://link.springer.com/chapter/10.1007/978-3-319-67910-5_30 DOI : https://doi.org/10.1007/978-3-319-67910-5_30
Any correspondence concerning this service should be sent
to the repository administrator: [email protected] This is an author’s version published in:
http://oatao.univ-toulouse.fr/191010
Open Archive Toulouse Archive Ouverte
OATAO is an open access repository that collects the work of Toulouse researchers and makes it freely available over the web where possible
To cite this version: Mnasri, Sami and Nasri, Nejah and Van den Bossche, Adrien and Val, Thierry A hybrid ant-genetic algorithm to solve a real deployment problem: a case study with experimental validation. (2017) In: International Conference on Ad Hoc
Networks and Wireless (AdHoc-Now 2017), 20 September 2017 - 22 September 2017 (Messina, Italy).
A Hybrid Ant-Genetic Algorithm to Solve a Real
Deployment Problem: A Case Study with Experimental
Validation
Sami Mnasri1(✉) , Nejah Nasri2, Adrien Van Den Bossche1, and Thierry Val1 1 University of Toulouse, UT2J, CNRS-IRIT-IRT, Toulouse, France
{Sami.Mnasri,vandenbo,val}@irit.fr 2 ENIS, LETI, University of Sfax, Sfax, Tunisia
Abstract. In this paper, we investigate the problem of deploying 3D nodes in a wireless sensor network. The aim is to choose the ideal 3D locations to add new nodes to an initial configuration of nodes, while optimizing a set of objectives. In this regard, our study proposes a new hybrid algorithm which stems from the ant foraging behavior and the genetics. It is based on a recent variant of the genetic algorithms (NSGA-III) and the Ant Colony Optimization algorithm. The obtained numerical results and the simulations compared with experiments prove the effectiveness of the proposed approach.
Keywords: 3D indoor redeployment · DL-IoT · Prototyping · Testbed · ACO · NSGA-III
1
The Problem of 3D Indoor Deployment of Nodes (in WSN)/Things
(in IoT)
The effectiveness of WSN (wireless sensor networks) is strongly influenced by the deployment process and the positioning of sensor nodes. In a WSN, deploying nodes is a strategy that aims to define the number of nodes, their positions and the network topology. A WSN is said to be three-dimensional if the variation in the height of the deployed sensors is not negligible with respect to the length and the width of the deploy‐ ment zone. Indeed, the 2D model loses its relevance for terrestrial networks, as for marine or airborne deployments, where the 2D model does not reflect the real topography of the zone. Many research challenges in three-dimensional spaces have not been explored yet as much as for two-dimensional networks. In this paper, we are interested in improving the initial deployment by adding a set of nodes in a deterministic way. Coverage is the most important objective to be met when deploying a WSN. It is an essential subject in the design of a WSN. Coverage is generally interpreted as how a network of sensors will supervise the area of interest. The increase of the number of nodes cannot always provide a total degree of coverage, and it is also costly to maintain high-density_networks. As a result, other methods need to be applied to avoid these problems and to improve coverage after the initial random deployment. The sensor
localization is the most relevant factor in connection with the coverage. Localization is relevant if there is uncertainty about the nodes exact location. Indeed, in WSN, the information about location is crucial especially when there is an unusual event. In this case, the sensor node that detects this event needs to locate it and then reports the location of that event to the sink node.
Another concept is closely related to our problem, it is the IoT (Internet of Things). The IoT is a scenario in which entities (devices, people or robots) are connected and have a unique identifier for each. They are able to transfer data over the network without human or automatic intervention. These objects communicate using protocols such as the Bluetooth or the 802.15.4 as it is the case in our experiments. WSN is the bridge which links the real world to the digital one. It is responsible for the hardware commu‐ nication to convey the real world values detected by the wireless connected things (sensor nodes) to the Internet. While the IoT is responsible for data processing, manip‐ ulation and decision making. In our study we are interested in the DL-IoT (DeviceLayer-IoT) [1] which is a network of collection used to collect data from the sensors nodes disseminated in the network environment. Thus, our approach are valid for both WSN and IoT contexts.
For most deployment modellings, the problem of optimal placement of sensor nodes is proved to be NP-hard [2]. Therefore, this problem cannot be solved by deterministic methods, even for little number of nodes. Thus, we propose a new hybrid algorithm based on NSGA-III [3] and ACO (Ant Colony Optimization) algorithm [4] to solve it.
2
Related Works, Main Motivations and Contributions
In [5, 6], the authors propose a state-of-the-art on multi-objective approaches resolving the 3D deployment problem. Various methodologies are proposed, among others, genetic algorithms (GAs) and particle swarms (PSO). Nevertheless, no comparison using simulations or experiments between these approaches is provided in these works. In [7], Qu et al. suggest a redeployment approach based on GA and PSO. The objective is to maximize the range of detection, and to minimize the number of mobile nodes and energy consumption. However, no mathematical modeling is given for the problem. Besides, no modifications are proposed for the tested algorithms. Also, only the 2D case is considered (not the 3D one). In [8], Matsuo et al. propose a 3D deployment with a radio propagation model in disaster areas using on a hybrid algorithm based on genetic algorithm and local search. However, the behavior of the tested algorithms is not eval‐ uated with known evaluation metrics such as Inverted Generational Distance (IGD) and Hypervolume (HV). In order to minimize the number of thermal sensors, the authors in [9] solve the problem of placing thermal sensors in the smart grid using a gappy proper orthogonal decomposition (GPOD-GA) algorithm. Nevertheless, the proposed approach allows only the optimization of a single objective and its evaluation is not based on metrics such as IGD and HV. In [10], the authors propose three strategies to resolve the deployment in terrain-aware by maximizing the coverage and minimizing the mobility cost. These strategies are based on a normalized genetic algorithm (NGA), and artificial immune system (AIS) algorithm and a particle swarm optimization (PSO) algorithm.
On the other hand, their approaches suffer from a disadvantage that concerns the high execution time of AIS and NGA.
These approaches suffer from several shortcomings. Among others, the inadequacy and inefficiency in the case of many-objective problems and real-world ones, both known for their complexity. In this work, the suggested contributions mainly concern: – The proposition of a new algorithm with a justified hybridization which benefits from
the advantages of the two algorithms ACO and NSGA-III.
– The performance of the proposed algorithm is compared with those of the ACO and NSGA-III algorithms using the HV metric, followed by a comparison between the simulation results and the real prototyping experiments. The interpretation of the obtained results is also provided.
– The use of the empirical context and the real measurements constitute a validation of the findings of the authors of the original algorithms (ACO and NSGA-III) which are validated only by tests on theoretical problems (DTLZ and ZDT).
The rest of the paper is organized as follows: in Sect. 2, the related works and the main contributions are presented. In Sect. 3, the new hybridization scheme is detailed. In Sect. 4, the performance of the AcNSGAIII is evaluated using numerical results. In Sect. 5, the simulation tests are compared to the experiments. Finally, in Sect. 6, a conclusion and different perspectives are listed.
3
Adapting the ACO and GAs for the 3D Indoor Deployment
Problem
3.1 NSGA-III Algorithm
NSGA-III [3] is a recent algorithm, proposed as an extension of NSGA-II [11]. It uses a reference point based approach to solve many objective problems (MaOPs). NSGA-III use the same concept of weight vector generation in MOEA/D [12] to determine a set of reference points scattered over the objective space. At every generation of each solution, the values of the objective function are normalized to [0, 1]. Then, a reference point is associated with each solution based on its perpendicular distance to the reference line. Assigning a reference point to each solution ensures the uniform repartition of the reference points across the normalized hyper-plane. The generated offspring is combined with the parent to create a hybrid population. Afterwards, the hybrid population is divided into a set of non-domination levels according to a non-dominated sorting proce‐ dure. The next parents as composed of the solutions in the first level so on and so forth. A niche-preservation operator is used to select solutions in the last acceptable level where the solutions associated with a less crowded reference line are more likely to be to be selected. For the majority of test problems, NSGAIII which is proposed especially for many-objective optimization shows a superior performance compared to other methods such as MOEA/D and NSGA-II. Algorithm 1 illustrates the NSGA-III algo‐ rithm.
3.2 Ant Colony Optimization Algorithm
The ACO algorithm was introduced by [4] in order to resolve the problems of hard CO (combinatorial optimization). It is a bio-inspired approximate algorithm which aim to obtain good solutions with reasonable computational cost (time) when resolving CO problems. Moreover, it is a meta-heuristic which is considered as probabilistic and population-based. The ACO stems from the foraging behavior of the real ants. Indeed, the ants aim at finding the shortest path between its nest and the source of food. Instead of using visual information’s, ants use a chemical substance named ‘pheromone’ which is left behind their trails. So, in the ACO, the artificial ants (called agents) imitate their natural counterparts in order to resolve the problems by finding the optimal solutions. The ACO algorithm is illustrated in Algorithm 2. Indeed, firstly, when the collection begins, the shortest route leading to food is not known. Thus, each ant pursues randomly a route and place pheromone. As the collection progress, ants continue putting the pher‐ omone. As a consequence, all traveled routes contain this substance. Then, because the pheromone evaporates overtime, if an ant wants to travel, it chooses the route with the highest rate of pheromone, which corresponds to the shortest among all routes. There‐ fore, overtime, only one route will remain (the shortest one).
3.3 The Proposed AcNSGA-III: A Hybrid Framework for NSGA-III and Ant System
Despite its efficiency, the NSGA-III has some difficulties when solving mono-objective and two-objective optimization problems. These difficulties concern the low selection pressure that NSGA-III introduce to non-dominated solutions of a population when resolving two-objective problems. Moreover, they concern the small population size and the random selection process when resolving mono-objective problems [13]. Also, the ACO algorithm has a main drawback which concerns the convergence into the local optima [14].
Therefore, the idea is to propose a well-justified hybridization scheme using the two algorithms to take advantage of their strengths and to remedy their drawbacks. When hybridizing these two algorithms, most of the studies [15, 16] use the standard and basic version of the genetic algorithm. Besides, most of these studies sequentially execute the two algorithms (the standard GA then the ACO or the opposite). Thus, the final solution of one of the two algorithms is the initial solution of the other. Although this basic scheme of integration enhances the ACO convergence rate, this latter remains converging excessively which makes the problem of local optimum unsolvable. In our study, we propose a platform where the two algorithms (NSGA-III and ACO) run at the same time and interact with the same population. Thus, the ant algorithm steps are injected into the implementation of the original NSGA-III with incorporation of several modifications of the original NSGA-III. Among these modifications, the initial popula‐ tion of the NSGAIII which becomes the population built by the ants in the initial phase of the ACO. It should be mentioned that this is first time NSGA-III and ACO are inte‐ grated into a hybrid platform. Moreover, this is the first platform using a hybrid genetic algorithm and ACO to resolve the problem of 3D indoor deployment of nodes. The proposed algorithm, called AcNSGA-III is illustrated in Algorithm 3. It is a hybrid ant-Genetic algorithm which performs an ACO optimal selection of nodes, a dynamic pher‐ omone updating and a mutation strategy. It accelerates the global convergence in order to speed up the local search which allows finding faster the suitable solutions of the 3D deployment problem. The global search ability and the randomness of the genetic oper‐ ators are guaranteed which ensure conducting the operation of the genetic operator into
generating routes by the ants if the ACO converges quickly. This allows to the latter finding the closing conditions and exits. Finally, since there is a low probability that ants and the NSGAIII process produce the same individual in the same iteration: the indi‐ vidual is added to the population unless it does not exist into it.
The procedure Each_ant_builds_a_solution() allows to construct the candidate solutions using a model of pheromone which is a tunable probability of distribution over the space the solution. In our case a solution is a feasible repartition of nodes in the 3D space. The procedure Update_pheromone() allows the use of the candidate solutions to update the values of the pheromone in order to ensure moving towards future better solutions. As an optimization, the operation of these two procedures can be summarized and replaced by the algorithmic sequence illustrated in Algorithm 4.
4
Numerical Results of the Algorithms
In this section, we present the parameters setting of the algorithms and the results using performance indicators. Different metrics can be used. In our case, although the Hyper‐ volume (HV) [17] is a metric with an expensive computational cost, it is recommended because it is useful when assessing real world problems without the need of a prior knowledge of the true Pareto-front. Furthermore, when resolving a particular problem, the parameters setting has a major influence on the algorithm behavior. The used para‐ metres are as follows:
– The size of the population (NS): 300 (Thus, Npop = 150).
– The operators of reproduction: It would be best to perform a recombination operation using near parent solutions in the case of MaOPs. Therefore, a large distribution index SBX operator (simulated binary crossover) is used. The recombination probability is PrOx = 0.8 using a distribution index τr = 45. The mutation probability using the bit-flip operator, is PrMt = 2 * 10−3 using a distribution index τm = 25.
– The number of runs: in order to guarantee statistical confident results, each algorithm is executed 25 runs using a different initial population in each execution.
– The constraints number: 5. – The number of ants (NbA): 350
– The pheromone minimum threshold (MaxTP): 1 – The pheromone maximum threshold (MinTP): 15 – The pheromone exponent (ExP): 0.4
– The pheromone evaporation coefficient (EvP): 0.25
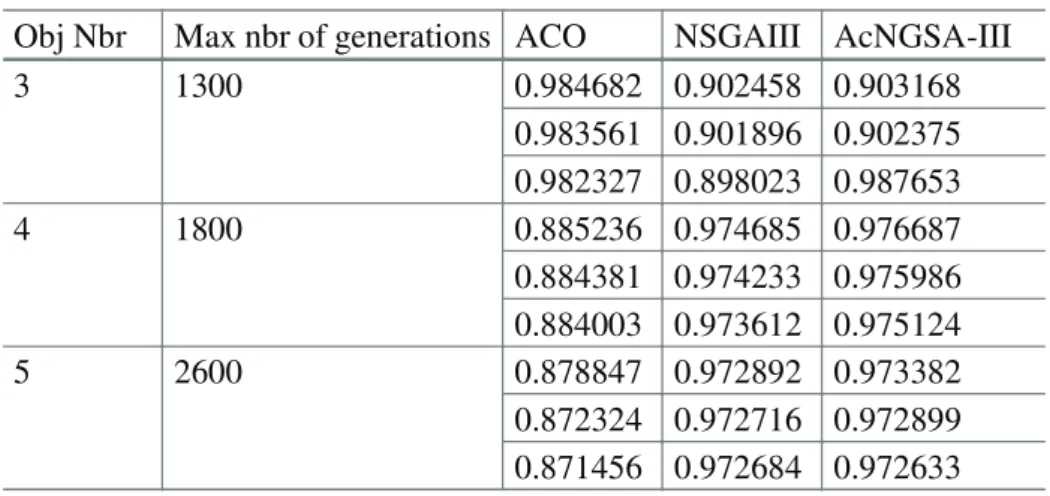
– The number of objectives and the termination condition (the maximum number of generations) are as shown in Table 1. For each instance, the best performance is demonstrated using shaded background.
The AcNGSA-III outperforms the ACO and the NGSA-III in the most of the instances which proves its efficiency. Another constatation is that the ACO is better than the NSGA-III for three objectives, while the latter one is better when the number of objectives is higher than three. This is is congruent with the observation of its authors [3] which asserts that the NSGAIII is dedicated to resolve many-objectives problems. Also, due to the increasing complexity of the problem when the number of objectives
increases, for all algorithms, better HV values are obtained with smaller number of objectives.
Table 1. HV (Best, average and worst values)
Obj Nbr Max nbr of generations ACO NSGAIII AcNGSA-III
3 1300 0.984682 0.902458 0.903168 0.983561 0.901896 0.902375 0.982327 0.898023 0.987653 4 1800 0.885236 0.974685 0.976687 0.884381 0.974233 0.975986 0.884003 0.973612 0.975124 5 2600 0.878847 0.972892 0.973382 0.872324 0.972716 0.972899 0.871456 0.972684 0.972633
5
Comparing Simulations and Experimentations
This section aims to provide a comparison between the simulation and the experimental tests of the 3D deployment scheme in indoor WSN while satisfying different objectives. We are interesting in testing the behavior the tested evolutionary optimization algo‐ rithms (ACO, NSGA-III) and the new suggested one (AcNSGA-III).
5.1 Simulation/Experiments Parameters and Working Environment
The algorithms are tested on an Intel core Intel Core i5-6600 K 3.5 GHz computer. Our model is based on the implementation of a 433 MHz physical layer, a non-coordinated CSMA/CA access method of the IEEE 802.15.4 protocol, and a routing layer based on the reactive AODV (Ad-hoc On-demand Distance Vector) protocol. The following parameters are considered in our simulations/experiments:
The following tools are used:
– OMNeT++ 4.6 [18] a free C++ platform to simulate and develop network protocols. – JMetal 4.5.2 [19] a java platform, which aims to develop and test different
meta-heuristics solving problems of multi-objective optimization.
– OpenWiNo [1] an open tool for emulating IoT and WSN protocols. It is used for prototyping protocols (in different layers) and evaluating their performances. – Arduino 1.6.1 [20] an open software/hardware platform for modules prototyping,
the WiNo nodes use it in transferring programs via serial links. – Teensyduino 1.2.1 an Arduino add-on to run sketches.
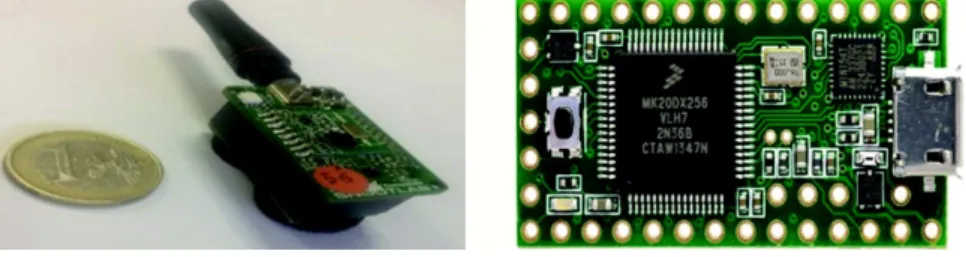
Figure 1 demonstrates the Teensy WiNo deployed nodes.
Fig. 1. The Teensy WiNo deployed nodes
5.2 Experimental Validations
The same architecture (number and type of nodes) of the 3D deployment is used both for simulations and experiments. A constant number (11) of fixed nodes with known positions is used. Also, the number of nomad nodes to be added is fixed to three. Their positions are determined with the tested algorithms. Similarly for mobile nodes, only one node is used as a trigger for the first message. In simulations, the positions of the initially deployed fixed nodes are chosen according to the distribution law used by OMNet++ which tries to uniformly distribute nodes starting from the center of the region of interest. In experiments, these positions are chosen according to the applicative objectives of the users in the building. This may lead to the non-coverage of certain zones especially at the borders if the number of fixed nodes is too small. The execution scenario is as following: In simulations, an initial message is sent from the mobile node to a random destination d; once d is found by the routing protocol, d becomes the source and a new destination is selected… etc. This cycle is repeated until a stop condition is satisfied. Among others, a maximal time for simulations. In experiments, the mobile node moves in the building and sends messages to its neighbors (nodes). Concerning the connectivity of nodes, a connectivity matrix between nodes is established. This matrix is deducted from empirical results derived from our experiments. As a conse‐ quence, the same initial connectivity links of the experiments are used. Subsequently, in order to model the dynamism of the network in simulations, these connectivity links are set to perturbations which allows modifying the initial connectivity links. Theses perturbations concern the calculation of the RSSI rates between the nodes. Indeed, a matrix of RSSI rates extracted from experiments is used initially. Then, this matrix is
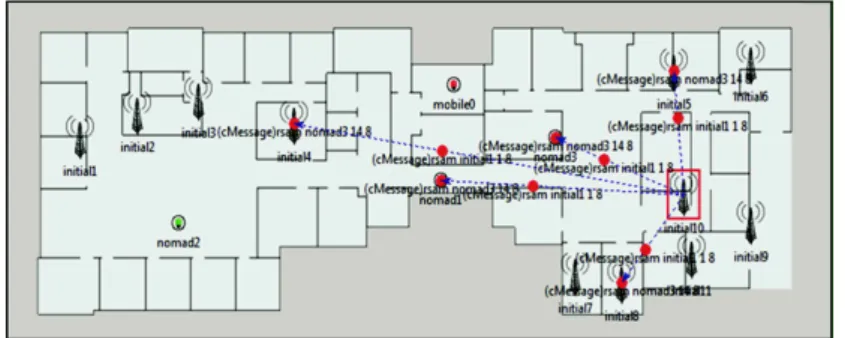
set to a perturbation (±30 for each value) in order to have new connectivity relations between nodes each time. Figure 2 represents the distribution of the nodes according to the OMNet++ interface in the simulations. Nodes named initial-i represents the fixed nodes and nodes named nomad-i represents the nomad nodes. Since comparing two algorithms is only possible through the use of a statistical test and due to the stochastic nature of the tested evolutionary algorithms, it is necessary to perform any test over many executions to obtain a well based judgment concerning their performance. Thus, all average values in this section, are computed based on 25 executions of the algorithms. Figure 3 shows the 3D deployment scheme of the experiments. Red nodes are the fixed nodes. Blue ones are the added nomad nodes.
Fig. 2. The simulation scenario
Fig. 3. 3D deployment scheme of the experiments
In the following, the different measures (RSSI, FER, etc.) are taken in both simulation and experiments.
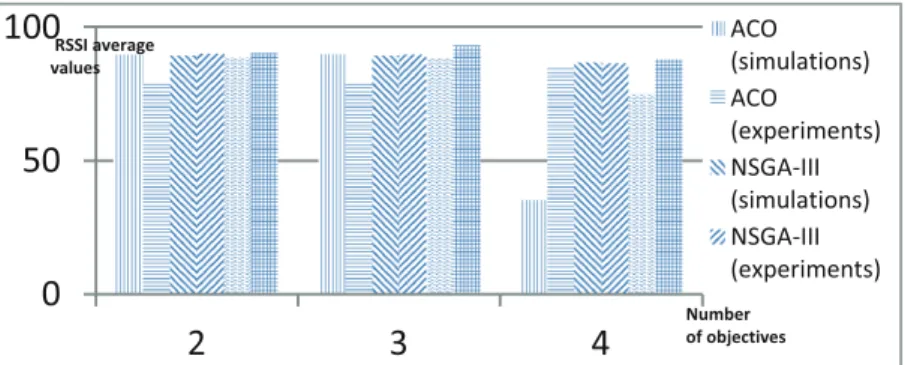
Comparing the RSSI rates. In order to measure the localization, the RSSI metric is used since the used localization model is based on hybridization between the RSSI and the DVHop (Distance-VectorHop) localization protocol. Thus, the higher the RSSI, the better the localization is. A neighbor can be added to the neighborhood table of a node only if the RSSI value of the detected node is greater than a predefined threshold. The theoretical value of this threshold is set to 90. Initially, RSSI levels are based on our empirical experiments. Then, as mentioned before, in order to guarantee dynamism within the network, disruption of the value of RSSI is introduced via a random function. Figure 4 shows, for different number of objectives considered by the tested algorithms, the average of the RSSI rates measured for all the nodes in connection with (detected by/detecting) the mobile node.
Fig. 4. Comparing the average RSSI rates
Comparing the FER rates. To measure coverage, we use the FER as a metric to assess the quality of links between nodes. Thus, the lower the FER, the better the coverage is. Although the FER values are less variable than those of the RSSI, for each node’s pair {node C, node i}, an average value extracted from four values is taken with an interval of 10 s between the four values. Initially, FER rates are based on our empirical experiments. Afterwards, to guarantee dynamism within the network, disruption of the FER values is introduced via a random function (±0.04 to ±0.2). Figure 5 shows the average FER rates measured for all nodes in connection with (detected by /detecting) the mobile node.
Fig. 5. Comparing the average FER rates
Comparing the number of neighbors. In order to assess the network connectivity, the number of neighbors of the target (the mobile node) is measured. Figure 6 shows the average of the number of neighbors of the mobile node per objective.
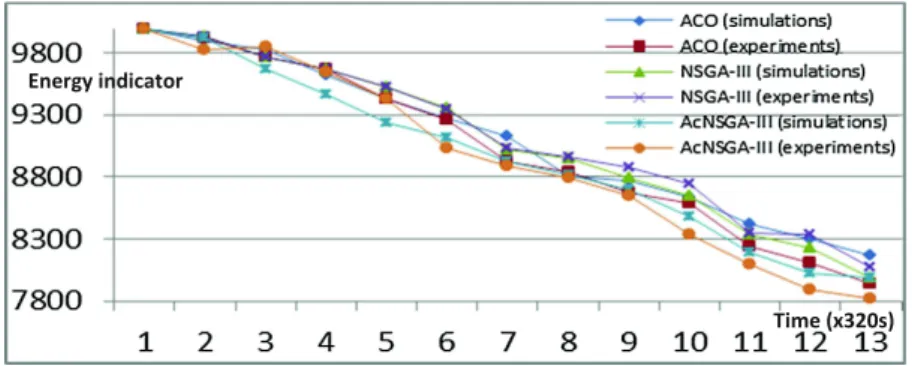
Comparing the energy consumption and the network lifetime. Figure 7 shows the variation of the energy level of the network according to the time. Indeed, for the different tested algorithms, according to the number of the fixed nodes, an average of the energy indicator of all nodes of the network is measured after adding nomad nodes.
Fig. 7. Comparing the average energy consumption levels
Figure 8 illustrates the lifetime of the network. It shows for different number of objectives, the time in which the first node of the network is switched off.
Fig. 8. Comparing the average lifetime
5.3 Discussion and Interpretations
After comparing the simulations and the experiments, different interpretations can be considered:
– The obtained results (Figs. 4, 5, 6, 7 and 8) show conformity with the results of experimentation, notably with regard to the coverage and localization rates. This proves the accuracy of the models of simulation and the effectiveness of the proposed approach in different contexts. Indeed, our work represents a proof by experimenta‐ tion and simulations of the observations which has been proved by the authors of the tested algorithms (NSGAIII for example) only by tests on instances of theoretical test problems.
– In several cases, lower RSSI averages are recorded after adding the nomad nodes. Despite this decrease indicating that the RSSI rates of the added nodes are lower than the RSSI values of the fixed nodes, the localization rate, the coverage rate and the
number of neighbors are improved. Given the objectives set by our approach, this decrease in RSSI averages is understandable, since adding a node in a location ×1 so that it will be close to several nodes with a lower RSSI value will be better than adding it in a location ×2 with a higher RSSI value but smaller number of neighbors. – The error rates (FER) are more important in experiments then in simulations. This is due to the influence of the activities of persons in the building during experiments (for example opening and closing doors) which generates the perturbation of the signal.
– By comparing the efficiency of the tested algorithms, as proved by numerical results (Sect. 4), the simulation/experimental results show that this efficiency is relative to the number of objectives to be optimized. Table 1 shows that for less than three objectives, the ACO is more efficient than NSGAIII, while the latter is more effective than ACO if the number of objectives exceeds three. This is explained by the fact that the ACO is dedicated for multi-objective problems, while the authors of NSGAIII propose this latter as an adaptation of the NSGAII for many-objective problems having more than three objectives. However, the AcNSGA-III has an almost stable behavior and is not influenced by the variation of the number of objectives.
6
Conclusion and Perspectives
In this paper, we proposed a hybrid algorithm called AcNSGA-III based on NSGA-III and ACO to resolve the problem of 3D indoor deployment in WSN. In order to prove the efficiency of the new algorithm, the performance of the above mentioned algorithms is assessed using the Hypervolume metric, then by simulations and experimental tests while considering five objectives. The proposed algorithm outperforms the traditional NSGA-III and ACO. Different improvements may be incorporated to our approach: We can further include the dynamic redeployment of nodes and the existence of obstacles in the 3D space while considering different other objectives, such as the network connectivity. Moreover, as a perspective, we seek to intensify the real deployed network by adding new nodes in order to investigate the influence of the network density on results. Also, the implementation of a more realistic energy model based on the manage‐ ment of the BO and SO values [21] of the 802.15.4 CSMA/CA protocol.
References
1. Van den Bossche, A., Dalce, R., Val, T.: OpenWiNo: an open hardware and software framework for fast-prototyping in the IoT. In: Proceedings 23rd International Conference on Telecommunications, Thessaloniki, Greece, pp. 1–6, 16–18 May 2016. doi:10.1109/ICT. 2016.7500490
2. Cheng, X., Du, D.Z., Wang, L., Xu, B.: Relay sensor placement in wireless sensor networks. ACM/Springer J. Wirel. Netw. 14(3), 347–355 (2007). doi:10.1007/s11276-006-0724-8 3. Deb, K., Jain, H.: An evolutionary many-objective optimization algorithm using
reference-point-based nondominated sorting approach, part I: solving problems with box constraints. IEEE Trans. Evol. Comput. 18(4), 577–601 (2013). doi:10.1109/TEVC.2013.2281535
4. Dorigo, M., Maniezzo, V., Colorni, A.: Ant system: optimization by a colony of cooperating agents. IEEE Trans. Syst. Man Cybern. Part B (Cybern.) 26(1), 29–41 (1996). doi: 10.1109/3477.484436
5. Aval, K.J., Abd Razak, S.: A review on the implementation of multiobjective algorithms in wireless sensor network. World Appl. Sci. J. 19(6), 772–779. ISSN 1818-4952 (2012). doi: 10.5829/idosi.wasj.2012.19.06.1398
6. Mnasri, S., Nasri, N., Val, T.: An overview of the deployment paradigms in the wireless sensor networks. In: Proceedings International Conference on Performance Evaluation and Modeling in Wired and Wireless Networks, Tunisie, 04–07 November 2014
7. Qu, Y.: Wireless sensor network deployment. Ph.D. dissertation, Florida International University, Miami, Florida, USA (2013)
8. Matsuo, S., Sun, W., Shibata, N., Kitani, T., Ito, M.: BalloonNet: a deploying method for a three-dimensional wireless network surrounding a building. In: Proceedings of the Eighth International Conference on Broadband and Wireless Computing, Communication and Applications, pp. 120–127 (2013). doi:10.1109/BWCCA.2013.28
9. Jiang, J.A., Wan, J.J., Zheng, X.Y., Chen, C.P., Lee, C.H., Su, L.K., Huang, W.C.: A novel weather information-based optimization algorithm for thermal sensor placement in smart grid. IEEE Trans. Smart Grid 99, 1–11 (2016). doi:10.1109/TSG.2016.2571220
10. Sweidan, H.I., Havens, T.C.: Coverage optimization in a terrain-aware wireless sensor network. In: Proceedings of the 2016 IEEE Congress on Evolutionary Computation, Vancouver, BC, pp. 3687–3694 (2016). doi:10.1109/CEC.2016.7744256
11. Deb, K., Pratap, A., Agarwal, S., Meyarivan, T.: A fast and elitist multiobjective genetic algorithm: NSGA-II. IEEE Trans. Evol. Comput. 6(2), 182–197 (2002). doi: 10.1109/4235.996017
12. Zhang, Q., Li, H.: MOEA/D: a multiobjective evolutionary algorithm based on de-composition. IEEE Trans. Evol. Comput. 11(6), 712–731 (2007). doi:10.1109/TEVC. 2007.892759
13. Ibrahim, A., Rahnamayan, S., Martin, M.V., Deb, K.: EliteNSGA-III: an improved evolutionary many-objective optimization algorithm. In: Proceedings IEEE Congress on Evolutionary Computation, Vancouver, BC, Canada, pp. 973–982, 24–29 July 2016. doi: 10.1109/CEC.2016.7743895
14. Sim, K.M., Sun, W.H.: Ant colony optimization for routing and load-balancing: survey and new directions. IEEE Trans. Syst. Man Cybern. Part A: Syst. Humans 33(5), 560–572 (2003).
doi:10.1109/TSMCA.2003.817391
15. Shen, H.: A study of welding robot path planning application based on Genetic Ant Colony Hybrid Algorithm. In: Proceedings IEEE Advanced Information Management, Communicates, Electronic and Automation Control Conference, Xi’an, China, pp. 1743– 1746, 3–5 October 2016. doi:10.1109/IMCEC.2016.7867517
16. Huang, P., Chen, J.: Improved CCN routing based on the combination of genetic algorithm and ant colony optimization. In: Proceedings 3rd International Conference on Computer Science and Network Technology, Dalian, China, pp. 846–849, 12–13 October 2013. doi: 10.1109/ICCSNT.2013.6967238
17. While, L., Hingston, P., Barone, L., Huband, S.: A faster algorithm for calculating hypervolume. IEEE Trans. Evol. Comput. 10(1), 29–38 (2006). doi:10.1109/TEVC. 2005.851275
18. The OMNeT platform (2016). https://omnetpp.org/omnetpp. Accessed 9 June 2016 19. The jMetal platform (2015). http://jmetal.sourceforge.net/. Accessed 2 Mar 2015
20. The Arduino platform (2017). https://www.arduino.cc/en/main/software. Accessed 5 Jan 2017
21. Farhad, A., Farid, S., Zia, Y., Hussain, F.B.: A delay mitigation dynamic scheduling algorithm for the IEEE 802.15.4 based WPANs. In: Proceedings International Conference on Industrial Informatics and Computer Systems, Sharjah, UAE, pp. 1–5, 13–15 March 2016. doi:10.1109/ ICCSII.2016.7462430