Science Arts & Métiers (SAM)
is an open access repository that collects the work of Arts et Métiers Institute of
Technology researchers and makes it freely available over the web where possible.
This is an author-deposited version published in: https://sam.ensam.eu
Handle ID: .http://hdl.handle.net/10985/18856
To cite this version :
Rabiae ARIF, Guillaume FROMENTIN, Frédéric ROSSI, Bertrand MARCON - Investigations on
drilling performance of high resistant austenitic stainless steel - Journal of Manufacturing
Processes - Vol. 56, p.856-866 - 2020
Any correspondence concerning this service should be sent to the repository
Administrator : archiveouverte@ensam.eu
Investigations on drilling performance of high resistant austenitic stainless
steel
Rabiae Arif
a,b,*
, Guillaume Fromentin
a, Frédéric Rossi
a, Bertrand Marcon
aaArts et Metiers Institute of Technology, LaBoMaP, UBFC, HESAM Université, Cluny, F-71250, France bSaint Jean Tooling, Saint Jean d’Ardières, F-69220, France
A R T I C L E I N F O Keywords:
Stainless steel Drilling
Cutting edge radius Coating Tomography Strain hardening Quick-Stop Test Cutting geometry A B S T R A C T
The aim of the investigations presented in this research work is to optimize the cutting geometry for drilling of Heat Resistant Austenitic Stainless Steel (HRASS) based on the tool life and strain hardening generated on the work material during cutting process. In particular, an attempt has been made to understand the effect of cutting edge preparation on both the cutting forces and the strain hardening of the work material. Besides, chips influtes are also analyzed by tomography technique to better understand their evacuation in-situ in correlation with the cutting forces. A Quick-Stop Device (QSD) in drilling is also employed to analyze the influence of the cutting edge radius, the coating material, and the cuttingfluid nature on the strain hardened layer using micro hardness filiations.
1. Introduction
Nowadays HRASS is an attractive engineering material in engine automotive applications due to its outstanding innate properties among which a high mechanical resistance at high temperature even in cor-rosive environment. However, machining of this difficult-to-cut mate-rial presents significant problems since they present a high ductility requiring large plastic deformation to generate the chip formation [1]. HRASS materials exhibit also high rates of strain hardening during machining with, for instance, a tendency to form build up edges [2,3]. Moreover, in drilling it has been demonstrated that the cutting edges cut permanently the strain hardened layer remaining from the previous cut [4,5]; in fact, the hardened layer generated is larger than the cut thickness. To improve the machinability of HRASS in drilling, the cut-ting geometry in correlation with the strain hardening should be opti-mized. A large number of parameters may influence the strain hard-ening appearing in the subsurface layer. It had been concluded by many researchers that intense cutting conditions in drilling enlarge the depth of the hardened layer [5–7]. It is also well-known that the cutting edge shape affects significantly the material flow, the cutting forces, and the temperature [8]. Several scientific works focused on the optimization of
the stainless steels drilling based only on the cutting conditions (cutting speed Vcand the feed fz) [9–11]. Others have been interested on cutting
fluid efficacity during turning of this range of materials (AISI 304) in order to reduce friction coefficient and therefore reducing the
machining temperature which may enhance the tool resistance (redu-cingflank wear) which lead to better surface quality [12]. Otherwise, few studies investigate the effect of the cutting edge preparation and its influence on the machinability of such material and on the tool life.
For the above mentioned reasons, the motivation of the present study resides in assessing the effect of the cutting edge preparation on the cutting forces and tool wear in relationship with the strain hard-ening they generate during drilling of HRASS. In this context, several parameters are studied. Firstly, the effect of the cutting edge radius, the cutting edge profile through 3 different drill geometries, and the coating material over both the cutting forces and the tool wear are studied in standard drilling configuration in order to analyze their di-rect effect on the tool life. In addition, the effect of the local cutting edge profile is also analyzed based on global and local cutting forces approaches as fully described in [13–16]. In particular, the influence of the cutting edge preparation on the strain hardening remaining on the machined subsurface layer is also studied by using Quick-Stop Test (QST) in drilling using the same apparatus than in [4]. Finally, the influence of the cutting edge radius, the coating type, and the cutting fluids on the evolution of the hardened layer is investigated to complete the previous analysis from the first step. Both strategies, standard drilling with forces measurements and QST, being complementary and compulsory to fully investigate and mitigate the HRASS drilling issues.
⁎Corresponding author at: Arts et Metiers Institute of Technology, LaBoMaP, UBFC, HESAM Université, Cluny, F-71250, France.
E-mail address:rabiae.arif@ensam.eu(R. Arif).
2. Experimental procedure and materials 2.1. Experimental set-up
To look after the forces developed during machining of HRASS and the tool life while drilling, all experiments are carried out in standard drilling configuration on a DMC 65 V CNC 3-axis machining center with a spindle of 25 kW equipped with a 840D Siemens numerical controller as shown inFig. 1. Cutting forces are measured with a Rotating Cutting force Dynamometer (RCD) Kistler type 9123C. Besides, three NC analog outputs are followed to know the actual feed rate Vf, the spindle torque
Mc, and the drill vertical position z. All those analog signals, forces and
operating drilling parameters, are recorded using a National Instrument data acquisition system (NI X6341 PCIe).
2.2. Study parameters
All drilling tests are performed with coated WC-Co twist drills with 5.1 mm diameter and internal lubrication at 32 bar with 8% water-based emulsion or straight oil. In this research work, three cutting geometries are compared: P0, P1 and P2 with different cutting edges preparations and different monolayer coating materials: AlCrN, TiAlSiN and TiAlN having the same thicknesses (∼3 μm). In order to compare results and analyze the effect of each studied parameter, the spindle speed is set to N=3308 rpm (Vc= 53 m/min on drill diameter) and the
feed per tooth is fz= 0.06 mm/rev/th; these cutting conditions are
maintainedfixed for all drilling tests. All drilled holes are blind with a depth of 14 mm.
2.3. Work material
In this research work, HRASS material is used in all experiments. In industrial context, this material is known by the reference 1.4837, and is generally used for applications requiring high mechanical resistance at elevated temperatures. It contains principally 24% of Cr and 12% of Ni and slight quantity of Nb and Si. The microstructure of HRASS is mainly composed of a dendritic austenitic phaseγ and hard carbides like CrxCyand NbC in the eutectic. All workpiece plates used are
ob-tained by casting process under the same conditions to target a bulk material hardness of 260± 10HB, those plates being milled to thefinal dimensions of 200 × 200 × 30 mm3allowing to machine∼1260 holes
per plate (both faces being used). Other samples, from the same stack of cast workpiece, are shaped by turning for Quick-Stop Test (QST) to
cylinders of 20 mm diameter by 40 mm height.
2.4. Cutting edge preparation and measurement
Cutting edge stability is enhanced by creating a defined rounding to eventually reduce the tool wear by chipping phenomenon. Three levels of cutting edge radius rβ are proposed and they are obtained by
brushing using an abrasive brush with filaments of extruded nylon containing polycrystalline diamond (PCD). In fact, compared to other technologies, the brushing process is relatively simple and provides high accuracy and repeatability to produce a rounded cutting edge in short time [17]. All brushing tests are realized on the CNC machine type VOLLMER VGRIND 360 to enhance the process repeatability and to reach as much as possible the same level of rβalong the cutting edge as
the pressure applied by the brush is maintained uniformly. It should be noticed that 1 pass corresponds to a one run back of the brush onto the cutting edge and the different levels of rβare qualified by the number of
run back brush passages. The brushing direction is going from the rake face to the clearance face and the brush follows the cutting edge ac-cording to the point angle in order to have the same pressure along the cutting edge.
Brushing parameters used are illustrated inFig. 2(b) and summar-ized inTable 1where N is the rotation speed of the brush, apis the
infeed, Vp is the feed velocity, φ is the cutting edge inclination. As
shown inFig. 2(a) the cutting edge is divided into 5 zones. Firstly drills are scanned using Alicona InfiniteFocusSL focus-variation microscope. The 3D model is then exploited thanks to commercial software in-tegrated with the Alicona microscope system. Finally, the cutting edge radius rβfor each defined zone is determined by a circle fitted from
points selected on the cutting edge radius [17]. Afterwards, rβis
aver-aged along the cutting edge and denoted rβ-aveas shown inFig. 3. In
addition, to check the actual coatings thicknesses, for each zone, rβis
measured before and after coating deposition. According to the mea-surements a slight rβ-aveincrease of up to a maximum of 3μm is
no-ticeable after coating.
3. Investigation of drill parameters on the tool life 3.1. Investigation of the cutting edge radius
3.1.1. Influence of the cutting edge radius on the mechanical tool load In drilling tests, only the feed force and the torque, respectively denoted Ff-aveand Mc-ave, are recorded and averaged during steady-state
of drilling (between the tool tip fully engaged and the feed slowing down before lifting). For each level of rβ-ave, three twist drills are used to
compute averaged quite robust trends. All drills are compared under identical cutting conditions with internal cooling (8% water-based emulsion), and for the same drilling length depending on the realized holes number (holes of 14 mm depth).Fig. 4presents a comparison of the average cutting forces Ff-aveand Mc-avecomputed during steady-state
Fig. 1. Set-up of drilling experiment for wear tests.
Fig. 2. a) Cutting edge zones definition for the drill P0 b) Schematic of the brushing configuration.
of each hole for the different cutting edge radius. According toFig. 4, the cutting edge preparation has a significant effect on the average cutting forces. Increasing rβ-aveby 12μm (from 1 brushing pass to 3
passes) induces a rise of the feed force Ff-aveand the torque Mc-ave
re-spectively by 17% and 46%. This is attributed to the trend to increase the amount of ploughed material along the cutting edge when
increasing rβ-ave, leading to high plastic deformation in front of the
cutting edge and consequently higher mechanical tool loads [18]. It is also observed high values of the torque Mc-avefor thefirst drillings and
especially during the break-in stage; phenomenon principally attributed to the drills corners which contain a chamfer (zone 5) as can be seen in
Fig. 2(a).
3.1.2. Analysis of tool wear and tool failure in correlation with tomography analysis
The tool wear is also quantified for each level of the cutting edge radius.Fig. 5shows the evolution of theflank wear Vbmaxobserved on
the clearance face. The Vbmaxis measured at the drill corners as the tool
wear increases progressively from the drill center to its corners due to cutting speed variation along the cutting edge [19]. Theflank wear is carefully measured for both cutting edges using an optical microscope Keyence type VHX 1000E with a built-in-camera and an integrated PC equipped with a commercial digital image processing software. For each drill, the Vbmaxevolution for thefirst cutting edge is presented by
continuous line while the second one is presented with dashed line. As seen inFig. 5, the tool wear can develop rapidly in the initial state (break-in period), then it grows progressively and uniformly throughout the steady-state wear rate until reaching its limiting value. Moreover, the wear evolution observed for the drills with 3 passes of brushing (rβ-ave= 34μm) is very higher compared to the one observed
on drills with 1 (rβ-ave= 22μm) and 2 passes of brushing (rβ-ave=
27μm). This contributes also to the increase of the cutting forces ob-served when using drills with 3 passes of brushing.
As seen before, drills with 2 passes of brushing generate a relatively higher level of cutting forces compared to drills with 1 pass of brushing whereas they exhibit less worn than them. Hence, it can be concluded that 2 passes of brushing deliver better behavior stability to the cutting edges when drilling of HRASS.
It is important to notice that two drills broke between the three repetitions for drills with 1 pass and 3 passes of brushing. To investigate this phenomenon and understand the reason of the tools breakage, in-situ analysis of the chip formation and evacuation by tomography
Table 1
Brushing parameters: brush type Ringlock Ø = 63 mm with a thickness of 13 mm and abrasive Korfil-E grain 320.
Drill geometry N (rpm) ap(mm) Vp(mm/ min) φ (°) Number of brush pass P0 4000 0.9 300 90 1 P0 4000 0.9 300 90 2 P0 4000 0.9 300 90 3
Fig. 3. The average cutting edge radius measured along the cutting edge of the drill P0 before and after the AlCrN coating.
Fig. 4. Effect of the cutting edge radius on the global cutting forces during wear tests - N =3308 rpm, fz= 0.06 mm/rev/th.
Fig. 5. Effect of the cutting edge radius rβ-aveon the maximalflank wear
technique are performed (since it is not easy to observe them in dril-ling). This non-destructive assessment method based on X-ray radiation allows the 3D reconstruction of the cutting tool and of the chips in-situ without extraction of the broken drills and the chips from the hole. Firstly, to obtain samples suitable for tomography, the broken drills tip stuck inside the workpiece with the formed chips are cored from the workpiece using electro-erosion drilling technique. Tomography tech-nique is principally based on X-ray detector which captures the es-caping X-ray radiation as two-dimensional radiographic image. In fact,
several radiographic images are recorded in sequence with the mea-sured drills in various positions. The drills are placed on rotating table which rotating gradually step by step. The tomography system used is X5000 type North Star Imaging with Perkin Elmer detector 2048 × 2048 square pixels allowing a resolution of 15μm. 1440 images are composing the 3D reconstruction of each drill scan.Fig. 6(a) pre-sents an example of tomography analysis showing the state of the cutting edges after the drills breakage with an unfolded images showing the chips evacuation on bothflutes of one drill. WhileFig. 6(b) shows the 3D reconstruction of drills after they broke to ensure the state of cutting edges after the drills breakage.
Fig. 6(c) illustrates the evolution of the instantaneous cutting forces (Ffand Mc) for the drill geometry P0 prepared with 3 passes of brushing
(rβ-ave= 34μm). According to the drills unfolded tomography images
(Fig. 6(a)), one can observe a large jamming of the chips in theflutes which explains the instantaneous increase of the cutting forces; parti-cularly the torque increases by about 545% leading to the brutal drills breakages. Nevertheless, the cutting edges aren’t damaged, as shown in
Fig. 6(b) sustaining that the drills breakages are not generated by any cutting edge damage, caused by premature wear, but only to the chip jamming avoiding its normal evacuation. Consequently, for drills with 3 passes of brushing, where the ratio rβ-ave/h is close to 0.7 (h being the
cut thickness) is unfavorable to cut HRASS material in drilling. In other words, when using high level of cutting edge radius, the work material tends to be cut by a negative rake angle which lead to a high chip thickness and moreover worsen by a poor chip evacuation. The zone denoted M inFig. 6(c) corresponds to a random evolution of the feed force Ffgenerated by the drills advance after their breakage. In
con-clusion, the cutting edge preparation affects significantly the cutting forces, the tool wear behavior, and consequently the tool life. High size of cutting edge radius generates high level of feed force Ffand torque
Mc. The same tendency is found concerning the tool wear behavior.
Nevertheless, small level of cutting edge radius (1 brushing pass) gen-erates small levels of cutting forces but accompanied by a significant increase in tool wear. Drills after 2 brushing passes display a better mechanical stability, despite the light increase of the feed force in comparison to drills with 1 pass of brushing. In the next section, we opted for 2 passes of brushing (rβ-ave= 27μm) for the cutting edge
preparation of all the drills to limit the wear effects.
3.2. Investigation of cutting edge profile
Three twist drills P0, P1 and P2 with three cutting edge profiles have been compared in terms of cutting forces (Fig. 7). In particular, global cutting forces have been analyzed based on the average values of cutting forces in mechanical steady-state of drilling. Furthermore, local cutting forces have been also analyzed, during drill tip penetration, based on the global cutting forces decomposition along the main cutting edge. It is worth noting that the three drills have the same mean cutting edge radius (rβ-ave= 27± 1.5μm) and the same coating (AlCrN).
Con-cerning the cutting edge shape of each drill as illustrated inFig. 8(a), P0
Fig. 6. (a) Chip jamming in theflutes with (b) the 3D reconstruction observed by tomography for the broken drills prepared by 3 brush passes with (c) the instantaneous evolution of the cutting forces measured during the breakage - N =3308 rpm, fz= 0.06 mm/rev/th.
contains double straight edges for the central/inner edge (edges [AB] and [BC]) and the principal/outer edge (edge [CD]) with a chamfer at the drill corners. While drills P1 and P2 contain only one straight edge at the central edge (edges [AB] and [A"B"]), with concave geometry for the principal edge (edges [BC] and [B"C"]). The difference between P1 and P2 resides on the corner geometry. In fact a small radius is created at drill corners for P2.
3.2.1. Global cutting forces
As explained before, the global cutting forces are measured and averaged in the steady-state of drilling for each drill. The global cutting forces evolutions generated by the 3 different drills geometries during wear tests are described inFig. 8. It can be seen that the drill P0 gen-erates the highest level of the feed force Ff-avecompared to drills P1 and
P2. This is attributed to the chisel edge of P0 which is very large compared to P1 and P2. However, it is observed that the evolution slope of Mc-aveis relatively higher for P2 in comparison to P0 and P1.
Fur-thermore, it is also seen that drills P0 and P2 generate a high torque during break-in stage. This is mainly attributed to the reinforcement geometry used for the corners. In fact, using a chamfer at drill corners induces a high torque during thefirst drillings if compared to the use of a small radius to reinforce the drill corners. In the next subsection, the linear local cutting forces are analyzed and correlated with the local cutting geometry of each cutting edge profile to better understand the differences between the different drills cutting geometry.
Theflank wear has also been compared for the three studied drills (P0, P1 and P2). Fig. 9shows the progression of the maximumflank wear with the number of drilled holes. According to the results, it is seen that theflank wear rate was very high for the P1 drill while the flank wear rate development for P0 and P2 is less than P1. From this outcome, it could be concluded that both of corner reinforcements (radius or chamfer at drill corner) can reduce theflank wear during drilling of HRASS. For example using a radius at drill corners mitigates theflank wear by ∼13% as it can be seen inFig. 9. Despite the high level of cutting forces generated by drills P0 and P2 compared to the drill P1, they generate less worn thanks to the corner reinforcement.
3.2.2. Linear local cutting forces analysis
In drilling, the global cutting forces could be decomposed on the main cutting edge during the drill tip penetration. It should be noticed that drill margins are not engaged, so their effect is not taken into ac-count in this analysis. The main goal of this analysis is to investigate the effect of each Elementary Cutting Edge (ECE) of the different cutting edge profiles on the local linear cutting forces evolutions. This metho-dology is deeply explained in [13–16].Fig. 10(a) shows the evolution of the rake angleγnalong the cutting edge. Indeed, the 3D shape of each of
Fig. 8. Effect of the cutting edge profiles on the global cutting forces during wear tests - N =3308 rpm, fz= 0.06 mm/rev/th.
Fig. 9. Effect of the cutting edge profile on the maximal flank wear evolution during wear tests Vbmax– N =3308 rpm, fz= 0.06 mm/rev/th.
Fig. 10. Influence of the cutting edge profiles on the evolution of the local linear cutting forces along the cutting edge of each drill - N =3308 rpm, fz= 0.06 mm/rev/th.
the drills used is measured by Alicona InfiniteFocusSL focus variation microscope. The rake angle is then measured directly on the 3D surface model using a self-developed macro implemented in CATIA software [11]. Fig. 10(b) presents the evolution of local linear cutting forces respectively Ffl and Fcl along the cutting edge according to the drill
radius R. For all studied drills, it is seen that Ffland Fclare very high at
the chisel edge before decreasing progressively from the drill center to the corners. It is also observed that ECEs of P0 generate high level of local linear cutting forces at the drill center. This is attributed to the rake angle of the chisel edge which is very negative (∼–64°) compared to drills the ones of P1 and P2 (∼–48°) as illustrated inFig. 10(a). In fact, the chisel edge is thefirst to penetrate the work material. The P0 rake angle, which is strongly negative, generates an important increase of the cutting forces at the drill center [13]. Additionally, it is also shown that the ECEs of the outer edges of P1 and P2 generate a smaller linear local feed force. From these observations, it could be concluded that a cutting edge with concave geometry on the principal edge (edges [B'C'] and [B"C"] for P1 and P2) allows reducing the cutting forces compared to straight or convex edges as demonstrated also in Ref. [2]. 3.3. Evaluation of coatings performance
This subsection aims to examine and compare the performances of three twist drills with three different coating materials: AlCrN, TiAlN, TiAlSiN under the same cutting conditions mentioned previously in the first section. AlCrN, TiAlN and TiAlSiN are coated onto the substrate (drills) surface by Physical Vapor Deposition (PVD) technique. The cutting forces (Ffand Mc) and the tool wear are exploited to evaluate
the different coating materials behavior and tool life eventual en-hancement. Three repetitions of wear tests are performed for each coating.Fig. 11displays a comparison of the evolution of the feed force Ffand the torque Mcaccording to the number of holes realized for the
different coating materials. As it can be seen from the results, the effect of the coating materials becomes more significant at the end of the wear tests. In fact, for the three coatings tested, the cutting forces increase gradually with the number of holes performed due to the progressive drill wear. In comparison with the other coatings tested, the TiAlN coating generates an increase of feed force and torque respectively by
∼17% and ∼54%. Thus, the cutting forces evolution slope for drill with TiAlN coating is higher compared to the drill with AlCrN and TiAlSiN. To resume, the feed forces Ffproduced by the TiAlN coating
increases by∼17% after 1160 holes while it increases only by about ∼10% for the two other coatings. When focusing in the torque, the AlCrN and TiAlN coatings, even though they generate a quit low evo-lution of Ff(∼10% and ∼17%), they lead to a drastically high torque
increase by about∼55%; this last being a lot when compared to the TiAlSiN coating which only generates an increase of 6%. It is worth noting that the percentages given are calculated based on the difference between the averages of the teenfirst holes (number 0–10) with the ten last ones (number 1150–1160).
As shown inFig. 12the coatings performances are also evaluated by measuring theflank wear Vbmaxat the drills corners of two drills edges
using a Keyence microscope (already described before). As it can be seen, the flank wear by abrasion increases progressively with the number of holes for all the considered coatings. According to Aldo Braghini et al. [20], the abrasion is generally represented by scratches on theflank face parallel to the cutting direction. Basically, the abrasion phenomenon is caused by the high friction between theflank face of the cutting tool and the hard carbides existing in the workpiece like CrxCy
and NbC [21]. Concerning the performance of the different coatings tested, it is seen that the evolution of Vbmax for the TiAlN coating is
more noticeable compared to the ones with TiAlSiN and AlCrN coat-ings.
Others analysis were performed using a Scanning Electronic Microscope (SEM) with Energy Dispersive Spectroscopy (EDS) in order to evaluate the adhesion of each coating material. EDS analysis in
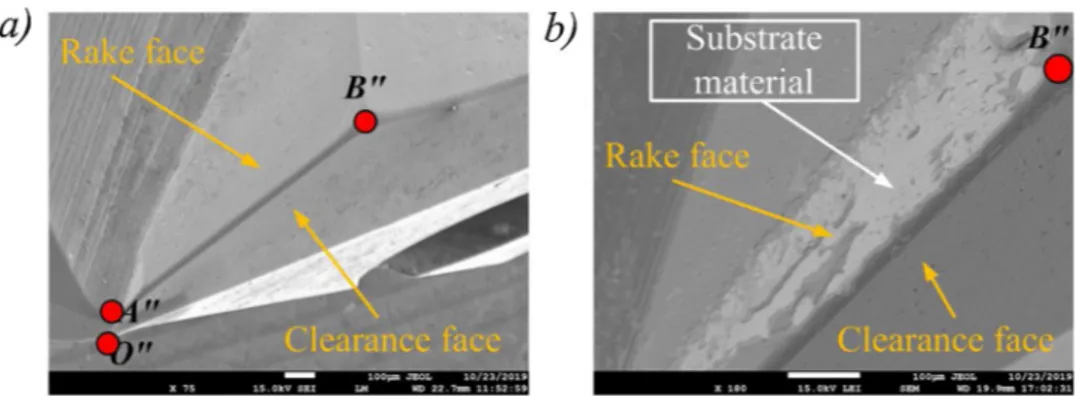
Fig. 13show that the TiAlN coating has totally disappeared from the rake face of the central edge after drilling the 1st hole. This demon-strates that the TiAlN coating loses its function instantly during thefirst hole. Consequently, the substrate material is no longer protected from adhesion and leading to higher friction coefficients. This can also ex-plain the increase of cutting forces observed when using drills with TiAlN coating (cf.Fig. 11). Nevertheless, a slight loss of coating is no-ticeable for the AlCrN coating and even for the TiAlSiN coating which is the least affected coating along the lip after one hole drilled. To resume, this last shows better wear resistance when drilling of HRASS compared to other coatings tested.
To better understand the causes of the drills wear behavior, others analyses were performed with EDS as illustrated inFig. 14 and the element dosage summed up inTable 2. Drills with TiAlSiN coating have been taken as an example in this analysis.
From these SEM images it is observed a large adhesion of the work material on the rake face of drills (EDS2), crater wear is also present but it is not larger than the flank wear. This last is generally caused by abrasion with the hard carbides from the work material [21]. A layer
Fig. 11. Influence of the coatings on the global cutting forces during wear tests -N =3308 rpm, fz= 0.06 mm/rev/th.
Fig. 12. Effect of the coatings on the maximum flank wear evolution for the three during wear tests - N =3308 rpm, fz= 0.06 mm/rev/th.
containing Fe, Cr and Ni (work piece material according to EDS2) ad-heres to the rake face of the drill. This can be explained by the amount of heat generated around the cutting zone [22]. However, the regions of the worn area that are not covered by adhered work material corre-spond to the tool material (EDS3 and EDS4). This shows that the coating no longer exists below the adhered layer of the work material. Due to the relative movement between the chip and the drill, the ad-hered layer of the work material is cyclically removed and replaced by another one. It is reasonable to suppose that hard carbides removed from the workpiece/chip material and the drill itself scrub on the rake and clearance faces generating a new wear by abrasion [20]. This combination between adhesion and abrasion is called attrition ac-cording to [23]. This phenomenon particularly occurs on the rake face at the contact tool/chip zone and for low cutting speeds and dis-continuous/irregular contact with the tool [21].
4. Study of strain hardening during drilling
To enhance the machinability of HRASS in drilling process, tool life and strain hardening are the major points that should influence them-selves and need to be mastered. It has been demonstrated in a previous study [4] that HRASS have a clear tendency to strain hardening due to multi-pass of the cutting edge. In fact, the hardened layer thickness generated can be twice to three times larger than the actual cut thick-ness [4,5]. This phenomenon may affect the tool wear especially in
drilling process. It is well-known that strain hardening is a result of a large plastic deformation appearing around the cutting zone due to the compressive stresses applied by the tool on the workpiece [5,7,24]. It has been also demonstrated that the strain hardening is very sensitive to tool wear [4] resulting in a significant increase of both the sublayer hardness and its depth under the machined surface. Hence, it is im-portant to understand the relationship between the cutting edge pre-paration, the tool/workpiece/chip contact conditions, and the strain hardening induced. In order to characterize the effect of the cutting
edge radius rβ, the coating materials and the cuttingfluids types on the
hardened layer evolution, a Quick-Stop Test (QST) is used during drilling tests to instantly stop the cutting process while keeping the chip, the work material, and the tool in position without affecting the machined surface during the spindle deceleration. The QST perfor-mance had been verified and employed in previous studies as described in [4].
4.1. Influence of cutting edge radius
As before, three sizes of cutting edge radius were prepared for carbide P2 geometry twist drills, coated with AlCrN, based on the number of brush passage (1 pass, 2 passes and 3 passes) on the cutting edge with the brushing parameters mentioned previously inTable 1. After QST, the specimens were prepared to analyze the machined subsurface layer in the hole bottom along the cutting edge. To char-acterize the hardened layer, micro hardness were performed by Knoop indenter that allows measurements close to the subsurface edges. Micro hardness filiations with 15 points are carried out with a distance of 40μm between two successive points and an offset of 30 μm from the subsurface edge. A small load of 50 g is used to reduce the influence of hard carbides existing underneath the analyzed zone. Threefiliations of micro hardness are performed on the subsurface layer generated by each defined zone [O"A"], [A"B"] and [B"C"], then they are fitted by one-phase exponential decay function, presented by continuous curves for
Fig. 13. SEM images of the rake face on P2 drill with TiAlN coating: (a) before and (b) after the 1st hole.
Fig. 14. SEM images of P2 drill with TiAlSiN coating: (a) adhered work material on the rake face and abrasion on the clearance face, (b) crater wear. Table 2
Elements dosage (% wt) by EDS analysis after 1160 holes for the P2 drill with TiAlSiN coating in different drill areas close to the cutting edge.
Fe Cr Ni Al W Mo Si Ti Mn EDS1 4.7 3.4 1.7 1.7 0.4 0.1 4.8 83.3 0.1 EDS2 59.3 25.5 12.3 0.2 0.1 0 1.4 1.5 0.1 EDS3 11.3 6.6 1.9 0.3 76.9 0 0.2 2.6 0.3
each analyzed zone as plotted inFig. 15. Then, the thickness of the hardened layer generated by each cutting edge zone is determined at 105% of the asymptote defined for each fitted curve. This method is applied for all micro hardness measurements in this section.
Fig. 15shows the evolution of strain hardening for the three levels of cutting radius: 22, 27 and 34μm (values averaged along the cutting edge). The results indicate that the strain hardening evolution and the hardened layer increase thickness hwalong the cutting edge and with
the cutting edge radius. For example, when increasing the cutting edge radius by∼10 μm for the edge [A"B"], the hardness of the generated layer and the hardened layer thickness increase respectively by∼14% and∼111 μm as shown inFig. 16(a) and (b). This tendency could be explained by the ploughing force which increases for high cutting edge radius; this raises the plastic deformation remaining on the machined subsurface layer. In addition to the ploughing phenomenon generated by high cutting edge radius, the increase of the subsurface hardness accompanying this phenomenon may also contribute to the increase of cutting forces as seen previously during wear tests in Fig. 4(Section
3.1.1). It is also interesting to note that local cutting parameters affect strongly the subsurface hardness and the hardened layer thickness hw.
Indeed, it could be seen fromFig. 16that the edge [B"C"] generated by the 2 brushing pass and the edge [O"A"] generated by 1 pass of brushing have a similar level of cutting edge radius. However, a large gap in
subsurface (91 HK0.05) hardness and hardened layer thickness (142μm) is noticeable due to the difference of local cutting parameters between the two edges. In fact, the chisel edge [O"A"] contains a ne-gative rake and clearance angle compared to the edge [B"C"] which contains a positive rake angle. Additionally, the variation of local cut-ting velocity along the cutcut-ting contributes also to increase the gap of strain hardening between two edges. In other words, the local cutting velocity is almost null for the edge [O"A"] (drill center) leading to high cutting mechanical load and consequently a high level of strain hard-ening in comparison to the edge [B"C"] where the local cutting velocity reaches its maximum.
4.2. Influence of the coating materials
The influence of two coating types, AlCrN and TiAlSiN (Fig. 17), on the evolution of the hardened layer is also investigated. TiAlN coating is not studied here because of its poor wear resistance as seen previously in the subsection 3.7.Fig. 18shows the effect of the coating material on the strain hardening evolution whileFig. 19(a) and (b) illustrate re-spectively the effect of the coating material on the hardened layer thickness and the surface hardness induced by each defined zone on the cutting edge. Results show a slight decrease of the hardened layer thickness hw when TiAlSiN coating is applied instead of AlCrN. This
observation may be attributed to the roughness of the coating on the cutting edge as illustrated inFig. 17that affects the friction conditions
between the tool and the workpiece as well as the chip formation. In-deed, AlCrN coating has a rougher surface characterized by a Ra= 0.57μm compared to the TiAlSiN coating with Ra= 0.16μm. For
the edge [O"A"], it should be noticed that the difference of the cutting
Fig. 15. Influence of the cutting radius on the evolution of the strain hardening along the cutting edge - N =3308 rpm, fz= 0.06 mm/rev/th.
Fig. 16. Influence of the cutting edge radius on (a) the averaged hardness of the machined subsurface and (b) the evolution of strain hardened layer thickness along the cutting edge.
edge radius (5μm) between the two coated drills has also contributed to decrease the hardened layer thickness for AlCrN coating; this last statement explains the large gap of -73μm observed between the two studied coatings for the edge [O"A"].Fig. 19(a) further indicates that drilling of HRASS with TiAlSiN coating generates an increase up to 14% of the subsurface hardness in the close vicinity of the machined surface (∼30 μm) along the cutting edge in comparison to the AlCrN coating. In correspondence with the wear tests performed, it has be shown previously in Section3.3that drilling with TiAlSiN coating allows re-ducing both the cutting forces and theflank wear. From this observa-tion, it could be concluded that increasing the subsurface hardness may enhance the machinability of HRASS [25]. In fact, increasing the sub-surface hardness may reduce the adhesion caused by the austenitic phase of the work material and the built-up edge which causes chipping and poor edge retention.
4.3. Influence of the cutting fluid type
The influence of the cutting fluids on the evolution of hardened layer along the cutting edge is also investigated. Two cuttingfluids are tested: straight oil VALONA type MS 7009 HC with kinematic viscosity of 9 m2/s and water-based emulsion from Blaser at 8%. In order to
avoid any wear influence a new WC-Co twist drill is used for each cuttingfluid. It should be noticed that the two drills have an identical characteristics: cutting edge profile P2, cutting edge radius about 27μm, and TiAlSiN coating. As before,Fig. 20shows the evolution of the strain hardening and the hardened layer thickness along the cutting edge for each cuttingfluid whileFig. 21(a) and (b) illustrate respec-tively the effect of cutting fluid type on the evolution of the subsurface hardness and the hardened layer. Results indicate that straight oil in-duce a slight decrease of the hardened layer thickness hw(up to–29 μm
along the cutting edge) compared to the soluble oil. This could be at-tributed to the friction at the hole-bottom since the straight oil reduces the friction at the tool/workpiece interface compared to the water-based emulsion which consequently decreases in the same manner the plastic deformation at the hole-bottom. It is interesting to note that the
Fig. 17. SEM images comparing the roughness of (a) AlCrN and (b) TiAlSiN on the edge [A"B"] before QST drilling test.
Fig. 18. Coating effect on the strain hardening evolution along the cutting edge - N =3308 rpm, fz= 0.06 mm/rev/th.
Fig. 19. Influence of the coating material on (a) the averaged hardness of the machined subsurface, and (b) the evolution of strain hardened layer thickness along the cutting edge.
cutting edge radius between the two drills are different and may con-tribute to the gap in hwobserved between the two studied cuttingfluids.
Indeed, the drill used for water-based oil have rβslightly larger than the
one used for the straight oil tests; the difference in cutting edge radius (1st order influence) could hide the influence of the cutting fluid which is a second order parameter when focusing on the workpiece stain hardening. Concerning the subsurface hardness, the cuttingfluid type doesn’t exhibit any significant effect as can be seen inFig. 21(a). 5. Conclusion
Experimental investigations were conducted to analyze the effect of the cutting edge preparation (cutting edge radius, cutting edge profiles and coating) on both the tool wear and the strain hardening generated on the work material during drilling of heat resistant stainless steel.
The highlights, drawn from the study, are as follows:
▪ Drilling HRASS is very sensitive to the cutting edge radius; in-creasing the edge radius by 12μm generates an increase of the feed force and the torque respectively by 17% and 46%.
▪ A high cutting edge radius leads to jamming chips in the flutes, leading to high cutting forces, especially the torque Mc(+545%),
and consequently to the premature drill breakage.
▪ Coating has a pronounced effect not only on cutting forces and tool wear but also on the subsurface hardness when drilling HRASS. Indeed, TiAlSiN coating possesses high abrasion resistance and good adherence to substrate material compared to AlCrN and TiAlN coatings
▪ The use of a concave geometry for the principal edge [B"C"] allows reducing the cutting forces. On the other hand, as theflank wear is maximal at the drill extremities, due to the cutting velocity variation along the main cutting edge, using a small radius at drill corners can mitigate the flank and provide more geometrical stability when drilling of HRASS.
▪ The work material strain hardening, generated by multi-pass of the cutting edges at the hole bottom, increases along the cutting edge both of the subsurface hardness and the depth of the hardened layer with the cutting radius increasing
▪ Regarding the coating type effect, the strain hardened layer is not very sensitive to it while the subsurface hardness exhibits a clear sensitivity to the coating materials. Indeed, TiAlSiN induces an in-crease of the subsurface hardness in comparison to AlCrN. This may enhance the machinability in drilling of HRASS, or equivalent ma-terial, as seen during the wear tests in Section3.3when drilling with TiAlSiN and confirmed as well by Astakhov in chapter 1 of [25]. ▪ Finally, strain hardening is little sensitive to the cutting fluid type.
For the hardened layer thickness, a small decrease is observed when using straight oil instead of water-based emulsion. This trend is principally attributed to both the difference of cutting edge radius between the two drills used and the friction reduction at the inter-face between the tool and the workpiece.
To resume, even if the coating and the cuttingfluid types have an effect on the strain hardening evolution, the cutting edge radius re-mains by far the main parameter investigated driving the hardening, the cutting forces and thus the tool life.
Declaration of interests
The authors declare that they have no known competingfinancial interests or personal relationships that could have appeared to in flu-ence the work reported in this paper.
Acknowledgements
The authors wish to place their sincere thanks for Patrick Blandenet
Fig. 20. Effect of lubrication on the strain hardening evolution along the cut-ting edge - N =3308 rpm, fz= 0.06 mm/rev/th.
Fig. 21. Influence of the cutting fluid nature on (a) the averaged hardness of the machined subsurface, and (b) the evolution of strain hardened layer thickness along the cutting edge.
from Saint Jean Tooling Company, for his financial support given throughout the realization of this project. A special thanks to Véronique Bouvier from Saint Jean Industries and all collaborators from Saint Jean Tooling for their guidance and technical supports. The authors ac-knowledge the highly technical support of Denis Lagadrillère from AM VALOR for the SEM images and analysis.
References
[1] Krolczyk G, Legutko S, Nieslony P, Gajek M. Study of the surface integrity micro-hardness of austenitic stainless steel after turning. Teh Vjesn 2014;21(6):1307–11. [2] Heiler R, Zeilmann RP, Estel G, Kauer T, Köller M. Drilling in heat resistant cast
stainless steel din 1.4848 for turbocharger housings. 2013.
[3] Roland H, Panosso ZR, Göran E, Oliver C. Threading in heat resistant cast stainless steel din 1. 4848 for turbocharger housings.Вестник MГCУ 2013;12 Accessed: Feb. 22, 2017. [Online]. Available: http://cyberleninka.ru/article/n/threading-in-heat-resistant-cast-stainless-steel-din-1-4848-for-turbocharger-housings.
[4] Arif R, Fromentin G, Rossi F, Marcon B. Investigations on strain hardening during cutting of heat resistant austenitic stainless steel. ASME J Manuf Sci Eng 2020(March).https://doi.org/10.1115/1.4046612.
[5] Dolinšek S. Work-hardening in the drilling of austenitic stainless steels. J Mater Process Technol 2003;133(1–2):63–70.https://doi.org/10.1016/S0924-0136(02) 00245-5.
[6] Yi HY, Yan FK, Tao NR, Lu K. Work hardening behavior of nanotwinned austenitic grains in a metastable austenitic stainless steel. Scr Mater 2016;114(March):133–6.
https://doi.org/10.1016/j.scriptamat.2015.12.021.
[7] M’Saoubi R, Chandrasekaran H. Role of phase and grain size on chip formation and material work hardening during machining of single and dual phase steels. Ironmak Steelmak 2004;31(June (3)):258–64.https://doi.org/10.1179/
030192304225012141.
[8] Koehler W. Analysis of the high performance drilling process: influence of shape and profile of the cutting edge of twist drills. J Manuf Sci Eng 2008;130(5).https://doi. org/10.1115/1.2951932. p. 51001.
[9] Sultan AZ, Sharif S, Kurniawan D. Procedia Manuf 2015;2(Janaurary):202–7.
https://doi.org/10.1016/j.promfg.2015.07.035.
[10] Routio M, Säynätjoki M. Tool wear and failure in the drilling of stainless steel. J Mater Process Technol 1995;52(1):35–43.https://doi.org/10.1016/0924-0136(94) 01441-3.
[11] Krolczyk G, Legutko S, Stoić A. Influence of cutting parameters and conditions onto surface hardness of Duplex Stainless Steel after turning process. Teh Vjesn
2013;20(6):1077–80.
[12] Singh RK, et al. Effect of multi-walled carbon nanotubes based nanofluid on surface roughness and cutting temperature in turning operation using minimum quantity lubrication. IOP Conference Series: Materials Science and Engineering vol. 377. 2018. p. 12017.
[13] Arif R, Fromentin G, Rossi F, Marcon B. Mechanical analysis of local cutting forces and transient state when drilling of heat-resistant austenitic stainless steel. Int J Adv Manuf Technol 2019:1–12.
[14] Bonnet C, Benmohammed B, Poulachon G, Rech J, Girard Y. CFRP drilling model: fiber orientation influence on mechanical load and delamination. Adv Mat Res 2011;223:111–21.
[15] Poutord A, Rossi F, Poulachon G, M’Saoubi R, Abrivard G. Study of the local forces along a cutting edge when drilling Ti6Al4V - comparison of methods. Int J Mach Mach Mater 2016;18(5–6):621–33.https://doi.org/10.1504/IJMMM.2016. 078976.
[16] Claudin C, Poulachon G, Lambertin M. Correlation between drill geometry and mechanical forces in MQL conditions. Mach Sci Technol 2008;12(March (1)):133–44.https://doi.org/10.1080/10910340801918275.
[17] Denkena B, Biermann D. Cutting edge geometries. CIRP Ann 2014;63(Janaurary (2)):631–53.https://doi.org/10.1016/j.cirp.2014.05.009.
[18] Biermann D, Wolf M, Aßmuth R. Cutting edge preparation to enhance the perfor-mance of single lip deep hole drills. Procedia CIRP 2012;1(Janaurary):172–7.
https://doi.org/10.1016/j.procir.2012.04.030.
[19] Attanasio A, Faini F, Outeiro JC. FEM simulation of tool wear in drilling. Procedia CIRP 2017;58(Janaurary):440–4.https://doi.org/10.1016/j.procir.2017.03.249. [20] Junior AB, Diniz AE, Teixeira Filho F. Tool wear and tool life in end milling of 15–5
PH stainless steel under different cooling and lubrication conditions. Int J Adv Manuf Technol 2009;43(7–8). p. 756.
[21] Diniz AE, Machado ÁR, Corrêa JG. Tool wear mechanisms in the machining of steels and stainless steels. Int J Adv Manuf Technol 2016;87(9–12):3157–68.https://doi. org/10.1007/s00170-016-8704-3.
[22] Tieu AK, Fang XD, Zhang D. FE analysis of cutting tool temperaturefield with adhering layer formation. Wear 1998;214(February (2)):252–8.https://doi.org/10. 1016/S0043-1648(97)00250-0.
[23] Sandvik A. Modern metal cutting. Sandvik Coromant Technical Editorial Department. 1st edn. Sweden: Tofters Tryckeri; 1994.
[24] Griffiths BJ. White layer formations at machined surfaces and their relationship to white layer formations at worn surfaces. J Tribol 1985;107(April (2)):165–71.
https://doi.org/10.1115/1.3261015.
[25] Davim JP. Machinability of advanced materials. John Wiley & Sons Incorporated; 2014.