Validation des caractéristiques biologiques et fonctionnelles des
communautés benthiques associées à des habitats côtiers dans
l’Arctique canadien
Mémoire présenté
dans le cadre du programme de maîtrise en océanographie en vue de l’obtention du grade de maître ès sciences (M.Sc.)
PAR
© Valérie Cypihot
Composition du jury :
Gesche Winkler, présidente du jury, UQAR-ISMER
Philippe Archambault, directeur de recherche, Université Laval
Kimberly L. Howland, codirectrice de recherche, Fisheries and Oceans Canada Mathieu Cusson, examinateur externe, Université du Québec à Chicoutimi
UNIVERSITÉ DU QUÉBEC À RIMOUSKI Service de la bibliothèque
Avertissement
La diffusion de ce mémoire ou de cette thèse se fait dans le respect des droits de son auteur, qui a signé le formulaire « Autorisation de reproduire et de diffuser un rapport, un mémoire
ou une thèse ». En signant ce formulaire, l’auteur concède à l’Université du Québec à
Rimouski une licence non exclusive d’utilisation et de publication de la totalité ou d’une partie importante de son travail de recherche pour des fins pédagogiques et non commerciales. Plus précisément, l’auteur autorise l’Université du Québec à Rimouski à reproduire, diffuser, prêter, distribuer ou vendre des copies de son travail de recherche à des fins non commerciales sur quelque support que ce soit, y compris l’Internet. Cette licence et cette autorisation n’entraînent pas une renonciation de la part de l’auteur à ses droits moraux ni à ses droits de propriété intellectuelle. Sauf entente contraire, l’auteur conserve la liberté de diffuser et de commercialiser ou non ce travail dont il possède un exemplaire.
« Personne ne sait comment sont exactement les choses quand on ne les regarde pas »
REMERCIEMENTS
D’abord, je tiens à remercier mon directeur, Phil, tu as su voir mon intérêt et mon potentiel et together with my co-supervisor, Kim, you both have trusted me to be in charge of this amazing project and given me the liberty to make mistakes and to grow from this experience. Kim, thank you for always asking the right questions to push the science further. Merci aux nombreux collaborateurs du projet : Chris McKindsey, Gesche Winkler, Nathalie Simard, Anaïs Lacoursière-Roussel, Jesi Goldsmit, merci pour vos commentaires et suggestions qui ont aidé à façonner ce projet. Je n’aurais jamais pu réaliser ce projet sans l’aide de mes assistants de terrain, Antoine Dispas et Noémie Leduc, merci d’avoir sué en brassant des sédiments. Sans vous, j’y serais encore ! Thank you LeeAnn Fishback and employees of the Churchill Northern Study Centre without whom we would have been eaten by polar bears. Thanks also to Heather Clark who patiently arranged many aspects of this field work. Merci, Laure et Lisa, vous avez contribué à rendre mon travail au laboratoire agréable et permis de distinguer la tête du cul ! Merci aux membres du labo benthos : Cindy sans qui il n’y aurait peut-être pas de labo benthos, mes collègues de maîtrise (Peter Schmidmayer, Mylène Dufour, Gonzalo Bravo) et les nombreux étudiants qui ont contribués à une ambiance unique. Merci à mes amis de Rimouski, qui m’ont permis de décrocher de la vie d’étudiante. Merci à Joanie et Jean-Michel, Claudie, Fred et Paméla !! En terminant, j’aimerais remercier ma famille, Maman et Papa, Marc, Marie-Ève et Sebina, merci de toujours être là pour m’écouter et m’encourager dans mes choix ! Et finalement merci Francis, je ne pourrai jamais te remercier assez d’avoir accepté de me suivre dans cette folle aventure que sont les études supérieures. Merci de permettre que l’on fasse notre vie là où nous mènent mes études. Merci de me challenger tout le temps et de me pousser à m’améliorer dans tous les aspects de ma vie.
AVANT-PROPOS
Mon amour pour les sciences remonte à aussi loin que je me souviens. J’ai depuis fort longtemps cette vive curiosité de comprendre comment fonctionne le monde qui m’entoure. Cette fascination profonde s’est d’ailleurs toujours présentée de façon plus intense pour le monde du vivant. C’est la fragilité et l’équilibre précaire qui soutient la vie qui me touchent particulièrement. Naturellement, les océans, qui sont relativement méconnus et particulièrement vulnérables me sont apparu comme le sujet de recherche qui comblait le plus ma curiosité. Par la suite, ce sont des rencontres avec des passionnés qui ont alimenté ma flamme pour l’écologie marine et plus précisément pour les invertébrés benthiques. D’abord, c’est lors d’une conférence que j’ai fait la rencontre d’un chercheur passionné et de son sujet de recherche qui l’est tout autant. J’ai assisté à une conférence donnée par Philippe Archambault et ce fut une véritable révélation pour moi, je savais désormais ce que je voulais faire dans la vie. Je me suis par la suite assurée de prendre toutes les décisions qui me mèneraient vers ce but. J’ai également croisé le chemin de chercheurs qui m’ont confirmé que c’était la voie que je désirais suivre. C’est le cas des professeurs du Bamfield Marine Science Centre ainsi que de Pierre Brunel dont la passion était contagieuse.
Ce projet de maîtrise s’inscrit donc de façon très naturelle dans mon cheminement en recherche. J’ai pu développer des compétences qui me serviront pour le restant de ma carrière. En commençant par les cours théoriques et pratiques complets qui sont donnés par l’ISMER. Par la suite, j’ai eu la chance de pouvoir concevoir en partenariat avec mes directeurs et leurs collaborateurs, un projet de recherche unique et ambitieux. J’ai pu y développer mon autonomie, notamment lors du travail sur le terrain qui ne fut pas de tout repos. Je n’aurais toutefois jamais réalisé ce projet sans être conseillée et épaulée par une panoplie de gens merveilleux et enthousiaste.
Ce projet n’aurait jamais vu le jour sans le soutien financier du Conseil de recherches en sciences naturelles et en génie du Canada, de Pêches et Océans Canada, de Savoir Polaire
Canada, du réseau de centre d’excellence du Canada ArcticNet, de Québec Océan et de l’UQAR-ISMER.
Dans les 3 dernières années, ce projet a été présenté dans plusieurs congrès qui m’ont permis d’échanger et de partager mes résultats avec la communauté scientifique.
Article
Cypihot, V., P. Archambault, K. L. Howland. (En rédaction). Validation of the biological and functional characteristics of benthic communities in association with coastal habitats in the Canadian Arctic
Affiches et présentations orales
Cypihot, V., P. Archambault, K. L. Howland. (2016). Les habitats côtiers sont-ils tous aussi importants ? Assemblée générale annuelle de Québec-Océan. Rimouski, Canada, 8 - 9/11/2016. (Affiche)
Cypihot, V., P. Archambault, K. L. Howland. (2016). Are all coastal habitat as important? ArcticNet Annual Scientific Meeting. Winnipeg, Canada, 5 - 9/12/2016. (Affiche) Cypihot, V., P. Archambault, K. L. Howland. (2017). Biological characterization of coastal
benthic communities in Churchill, Manitoba. Benthic Ecology Meeting, Myrtle Beach, USA, 12-16/05/2017. (Présentation orale)
Cypihot, V. P. Archambault, K. L. Howland. (2017). A quest for the most functionally diverse coastal habitat of Subarctic Canada. Arctic Change, Québec, Canada, 11-15/12/2017. (Présentation orale)
Cypihot, V., P. Archambault, K. L. Howland. (2018). Les habitats côtiers de l’Arctique canadien : une caractérisation biologique et fonctionnelle. Colloque du département de biologie de l’Université Laval, Québec, Canada, 21-22/03/2018. (Présentation orale). Cypihot, V., P. Archambault, K. L. Howland. (2018). Evaluating the structure and functions
of benthic coastal habitats in Churchill, Manitoba. World Conference on Marine Biodiversity, Montréal, Canada, 13-16/05/2018. (Présentation orale).
RÉSUMÉ
Les habitats côtiers fournissent des conditions uniques qui permettent à une diversité d’espèces spécifiques de s’y établir. Toutefois, dans l’Arctique canadien, cet habitat devra faire face à un nombre grandissant d’impacts dans le futur, tels que des déversements de pétrole et des espèces envahissantes. Dans ce contexte, des méthodes d’échantillonnage efficaces et peu coûteuses sont requises afin d’obtenir des données de références sur les espèces arctiques et les environnements côtiers dans les endroits éloignés. Le projet Emergency Spatial Pre-SCAT (shoreline cleanup assessment technique) for Arctic Coastal Ecosystems (eSPACE) a permis le développement d’une classification des habitats à l’aide de vidéographie qui utilise des paramètres tels que le substrat et la géomorphologie. Afin de vérifier la relation entre cette classification des habitats et la composition biologique, l’objectif de cette étude était de caractériser les communautés benthiques côtières et les habitats qui y sont associés dans la région de Churchill, Manitoba. Les sous-objectifs étaient de (1) valider la classification vidéographique des habitats de Wynja et al. (2015) à l’aide de données biologiques en vérifiant que la classification des habitats de Wynja et al. (2015) peut expliquer les caractéristiques des communautés benthiques et (2) d’évaluer la composition fonctionnelle et de la diversité fonctionnelle des habitats à l’aide d’indices de diversité fonctionnelle. Pour se faire, les communautés benthiques ont été échantillonnées dans six habitats différents (Roche-mère, Blocs, Jetée de blocs, Mixed tidal, Sédiments mixtes et Sable). Dans chaque habitat, 4 segments de 100 m, sélectionnés aléatoirement, ont été échantillonnés à marée basse dans la zone intertidale. Les résultats montrent que les habitats classifiés se distinguent par leur composition biologique et fonctionnelle. De plus, la diversité fonctionnelle varie selon les classes d’habitat, ce qui permet d’obtenir de l’information sur les différences dans le fonctionnement de l’écosystème des habitats échantillonnés. Les résultats de cette étude permettront d’utiliser les habitats côtiers comme indicateurs de la composition biologique et fonctionnelle en Arctique, facilitant ainsi la prise de décision et de mieux cibler la conservation d’espèces rares ou de traits fonctionnels uniques.
Mots clés : Habitats côtiers, Communautés benthiques, Arctique, Classification d’habitats, Traits fonctionnels, Diversité fonctionnelle, Structure des communautés
ABSTRACT
Coastal habitats provide unique conditions as it is the location of strong land and ocean interactions which allow a specific diversity of species to establish. However, in the Canadian Arctic, this unique habitat may experience a growing number of impacts such as oil spills and aquatic invasive species. In this context, effective, low-cost sampling methods are required to obtain baseline data on Arctic species and coastal environments in remote areas. The Emergency Spatial Pre-SCAT (shoreline cleanup assessment technique) for Arctic Coastal Ecosystems (eSPACE) project developed a classification of habitats by videography using parameters such as substrate and geomorphology. In order to verify the relationships between this habitat classification and the biological composition, the objective of this study was to characterize coastal benthic communities and associated habitats in Churchill, Manitoba. Specific objectives were to (1) to ground truth Wynja et al. (2015) videographic classification of habitat with biological data by verifying if the videographic habitat classification used by Wynja et al. (2015) explained benthic community characteristics and to (2) evaluate the functional composition and the functional diversity of sampled habitats through functional traits diversity metrics. Benthic communities were collected in six different habitats (Boulder, Bedrock, Boulder-strewn tidal flat, mixed sediment, mixed tidal flat and Sand). In each habitat, 4 different 100 m segments, selected randomly, were sampled at low tide in the intertidal zone. Results show differences in classified habitats based on their biological and functional composition. Also, functional diversity varies according to different habitat classes, which provides information on the differences in ecosystem functioning of the sampled habitats. Results of this study will allow the use of coastal habitats as indicators of biological and functional composition in the Arctic. This will help in decision-making and could support easier targeting of conservation of rare species or unique functional traits.
Keywords: Coastal habitats, Benthic communities, Arctic, Habitat classification,
TABLE DES MATIÈRES
REMERCIEMENTS ... ix
AVANT-PROPOS ... xi
RÉSUMÉ ... xiii
ABSTRACT ... xv
TABLE DES MATIÈRES ... xvii
LISTE DES TABLEAUX ... xix
LISTE DES FIGURES ... xxi
INTRODUCTION GÉNÉRALE ... 1
LES HABITATS COTIERS... 1
FACTEURS DE RISQUES EN ARCTIQUE ... 1
LES HABITATS COMME INDICATEURS ... 2
LES TRAITS FONCTIONNELS ... 4
LE PROJET ESPACE ... 5
LA RÉGION DE CHURCHILL ... 6
OBJECTIFS ET HYPOTHÈSES ... 7
VALIDATION DES CARACTÉRISTIQUES BIOLOGIQUES ET FONCTIONNELLE DES COMMUNAUTÉS BENTHIQUES ASSOCIÉES À DES HABITATS CÔTIERS DANS L’ARCTIQUE CANADIEN ... 9
2.1 PREAMBULE ... 9
2.2 VALIDATION OF THE BIOLOGICAL AND FUNCTIONAL CHARACTERISTICS OF BENTHIC COMMUNITIES IN ASSOCIATION WITH COASTAL HABITATS IN THE CANADIAN ARCTIC ... 10
2.3 INTRODUCTION ... 10
2.5 RESULTS ... 20 2.6 DISCUSSION ... 40 2.7 CONCLUSION ... 45 CONCLUSION GÉNÉRALE ... 47 ANNEXE I ... 55 ANNEXE II ... 56 ANNEXE III ... 72 ANNEXE IV ... 73 RÉFÉRENCES BIBLIOGRAPHIQUES ... 74
LISTE DES TABLEAUX
Table 1. Description of habitats according to Environment Canada shorelines types ... 16 Table 2. Functional traits and their modalities ... 19 Table 3. Nested PER-ANOVA results testing for the effect of Habitat classes (bedrock, boulder, boulder-strewn tidal flat, mixed sediment, mixed tidal flat, sand) and Segment nested in Habitat factor (random with 4 segments per habitat) on mean invertebrate community characteristics: richness (S), density (N), biomass, Shannon-Wiener diversity (H’), Pielou’s evenness (J’) and taxonomic distinctness (∆*). To meet assumptions, PER-ANOVAs were permuted (9999). Significant effects (p < 0.05) are indicated in bold. ... 23 Table 4. Nested PERMANOVA results and pairwise tests testing for the effect of Habitat classes (bedrock, boulder, boulder-strewn tidal flat, mixed sediment, mixed tidal flat, sand; n=60) and Segment nested in Habitat factor (random with 4 segments per habitat) on invertebrate community composition (√ density, √ biomass and presence or absence). Significant effects (p <0.05) are indicated in bold. ... 26 Table 5. Top 3 taxa contributing most to dissimilarity between each pair of Habitat classes based on presence-absence data. ... 28 Tableau 6. Nested PERMANOVA results and pairwise tests testing for the effect of Habitat classes (bedrock, boulder, boulder-strewn, mixed sediment, mixed tidal flat, sand; n=60) and Segment nested in Habitat factor (random with 4 segments per habitat) on community functional traits composition (√ density, √ biomass and presence or absence). Significant effects (p <0.05) are indicated in bold. ... 35 Table 7. Top 3 traits contributing most to dissimilarity between each pair of Habitat classes based on presence-absence data. ... 377 Table 8. Nested PER-ANOVA results testing for the effect of Habitat classes (bedrock, boulder, boulder-strewn, mixed sediment, mixed tidal flat, sand; n=60) and Segment nested in Habitat factor (random with 4 segments per habitat) on mean species and functional diversity metrics: functional richness and functional
dispersion. To meet assumptions, PER-ANOVAs were permuted (9999). Significant effects (p <0.05) are indicated in bold. ... 38
LISTE DES FIGURES
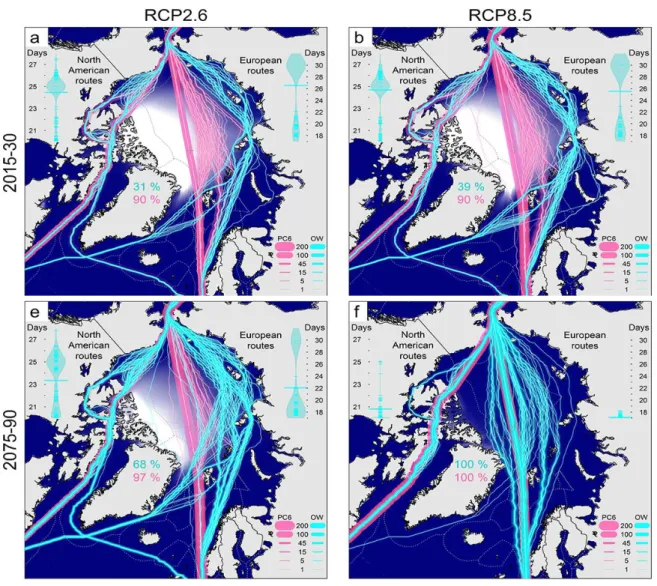
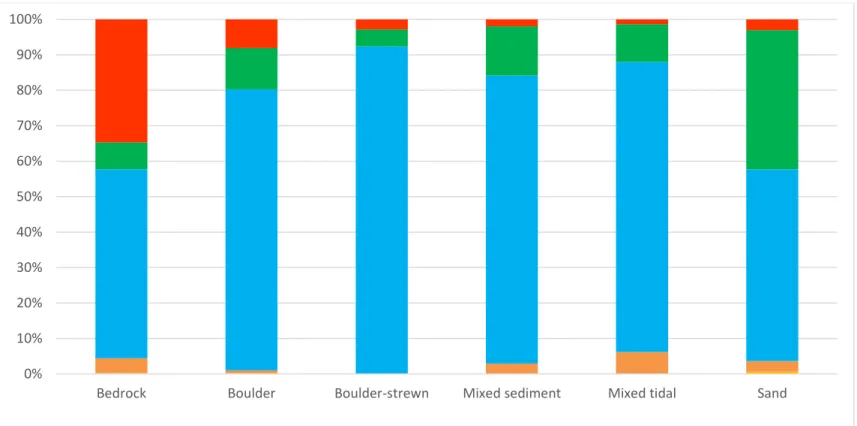
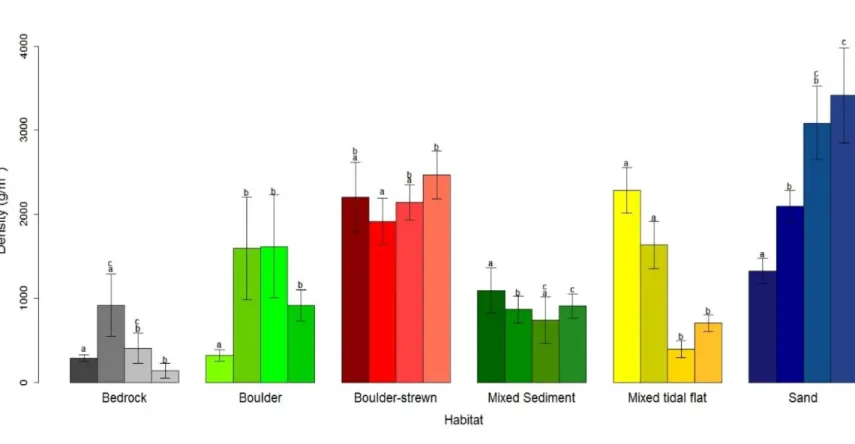
Figure 1. Modélisation démontrant l’augmentation du transport maritime en Arctique selon deux scénarios climatiques (RCP 2.6; 8.5) et pour deux périodes (2015-2030 et 2075-2090). Les lignes bleues représentent le transport en eau libre (OW) tandis que les lignes roses représentent le transport effectué par des transporteurs polaires de classe 6 (PC6); la largeur de la ligne indique le nombre de transits utilisant une même route. Les pourcentages indiquent le potentiel transarctique pour les deux classes de transport. Modifié de Melia et al. (2016). ... 3 Figure 2. Mean (± SE) invertebrates community characteristics for the six habitat classes (n=60). (a) density (ind. m-2); (b) biomass (g m-2); (c) richness (no. of taxa quadrat-1); (d) Shannon-Wiener’s diversity index (H’); (e) Pielou’s evenness index (J’); (f) taxonomic distinctness (Δ*). Different letters (a-c) above bars indicate significant differences (p <0.05) based on pairwise comparisons (see Table 2). ... 24 Figure 3. Mean (± SE) algal community characteristics for the six habitat classes (n=60). (a) biomass (gm-2); (b) Shannon-Wiener’s diversity index (H’); (c) richness (no. of taxa quadrat-1); (d) Pielou’s evenness index (J’). Different letters (a-c) above bars indicate significant differences (p <0.05) based on pairwise comparisons. ... 25 Figure 4. Non-metric multidimensional scaling (nMDS) ordination on centroids of community composition from six habitat classes (bedrock, boulder, boulder-strewn tidal flat, mixed sediment, mixed tidal flat and sand; n=60). Based on Sorenson similarity on presence or absence data. Circles were hand drawn to improve visualization. ... 27 Figure 5. Average composition of algal biomass for each Habitat classes (Bedrock, Boulder, Boulder-strewn tidal flat, Mixed sediment, Mixed tidal flat and Sand). ... 29 Figure 6. Mean (± SE) density (ind. m-2) for each segment of the six habitat classes (Bedrock, Boulder, Boulder-strewn, Mixed sediment, Mixed tidal flat; n=15). Different letters (a-c) above bars indicate significant differences (p<0.05) based on pairwise comparisons. ... 31
Figure 7. Non-metric multidimensional scaling (nMDS) ordination on centroids of community composition in relation to salinity (marine-Hudson Bay (high salinity) vs. estuarine-Churchill River (low salinity)) based on Gower (S19) on density data. ... 322 Figure 8. Non-metric multidimensional scaling (nMDS) ordination on centroids of functional traits composition of six habitat classes (bedrock, boulder, boulder-strewn tidal flat, mixed sediment, mixed tidal flat and sand). Based on Sorenson similarity on presence or absence data. ... 366 Figure 9. Mean (± SE) functional diversity metrics for the six habitat classes (n=60) on biomass data. (a) Functional richness; (b) functional dispersion. Different letters (a-b) above bars indicate significant differences (p <0.05) based on pairwise comparisons (see Table 7)... 39
INTRODUCTION GÉNÉRALE
LES HABITATS COTIERS
Les habitats côtiers fournissent des conditions uniques permettant à une diversité d’espèces de s’établir et ils sont une ressource essentielle au niveau économique, social et culturel (Rickets et Hildebrand, 2011). C’est un emplacement d’intenses interactions terre-océan influençant autant les processus marins que terrestres (Knox, 2000; Ray et McCormick-Ray, 2004; Roff et Zacharias, 2011). La zone intertidale est une zone de transition entre ces environnements, définie par la zone affectée par les marées (Knox, 2000). Les effets de la forte relation entre le règne terrestre et le règne marin ont été démontrés dans plusieurs études (Polis et al., 1997; Granek et al., 2009; Rabalais et al., 2009; Ruttenberg et Granek, 2011). L’Arctique canadien changeant rapidement, les environnements côtiers devront faire face à un nombre grandissant d’impacts attribuables à l’évolution des changements climatiques (IPCC, 2014). La montée du niveau de la mer redessine la côte par des inondations, de l’érosion, l’intrusion d’eau et la formation de lagunes côtières salines (Shaw et al., 1998; Proshutinsky et al., 2001; FitzGerald et al., 2008; Nicholls et Cazenave, 2010).
FACTEURS DE RISQUES EN ARCTIQUE
Partout sur terre, une augmentation de la concentration de CO2 dans l’air provoque
d’importants changements dans le climat. En Arctique, on observe une diminution importante du couvert de glace depuis plusieurs décennies (Parkinson et DiGirolamo, 2016). Les modèles prédisent que l’océan Arctique pourrait être libre de glace en été d’ici 2030 (Jahn et al., 2016). Les changements climatiques combinés à la diminution de l’étendue de la glace et à l’augmentation de la durée de la saison libre de glace pourraient causer une augmentation des activités anthropiques et du développement côtier en Arctique. Ce développement sera favorisé par l’ouverture de nouvelles routes pour le transport maritime,
en raison de l’augmentation de la durée de la saison navigable et d’un accès plus facile aux eaux de l’Arctique, ce qui provoquera en une augmentation du transport maritime (Smith et Stephenson, 2013; Gavrilchuk et Lesage, 2014; Melia et al., 2016; Figure 1). En effet, on remarque déjà que les activités de transport maritime ont doublées en Arctique dans la dernière décennie (Lasserre et al. 2017). De tels changements devraient, selon les prédictions, augmenter la pression des propagules et favoriser l’établissement et la survie des espèces aquatiques exotiques transportées à partir de régions plus tempérées (Niimi, 2004; Arctic Council, 2009; Lockwood et al., 2016; Ware et al., 2016). De plus, la combinaison d’une augmentation du transport maritime et du développement pourrait augmenter les risques de déversements de pétrole dans l’Arctique, notamment selon des exports prévus de plus de 40 millions de tonnes de pétrole par année d’ici 2020 (Borgerson, 2008; Arctic Council, 2009; Khan et al., 2014; Marchenko et al., 2015).
LES HABITATS COMME INDICATEURS
Afin de gérer efficacement les écosystèmes côtiers, il est essentiel d’être en mesure de prioriser certains écosystèmes (ex. lors d’un déversement de pétrole). Ceci nécessite une bonne connaissance des écosystèmes et plus précisément, des séries de données temporelles et spatiales. En Arctique canadien, relativement peu d’études ont été réalisées sur les environnements côtiers afin d’obtenir ces données de bases nécessaires à la gestion des écosystèmes en cas d’incidents. Ces données sont parfois difficiles à acquérir en raison du coût élevé de l’échantillonnage, associé au caractère éloigné des régions de l’Arctique canadien. Dans ce contexte, des méthodes d’échantillonnage efficace et peu coûteuse sont requises afin d’accélérer l’obtention de ces données de base.
Figure 1. Modélisation démontrant l’augmentation du transport maritime en Arctique selon deux scénarios climatiques (RCP 2.6; 8.5) et pour deux périodes (2015-2030 et 2075-2090). Les lignes bleues représentent le transport en eau libre (OW) tandis que les lignes roses représentent le transport effectué par des transporteurs polaires de classe 6 (PC6); la largeur de la ligne indique le nombre de transits utilisant une même route. Les pourcentages indiquent le potentiel transarctique pour les deux classes de transport. Modifié de Melia et al. (2016).
Afin de faciliter la gestion des écosystèmes, un nombre grandissant d’études utilisent les habitats comme prédicteur des caractéristiques des communautés biologiques. Les habitats sont d’ailleurs utilisés comme unité en écologie depuis plusieurs années (ex. Noss et al., 1987; Dalleau et al., 2010; Brown et al., 2011) puisqu’ils sont le reflet des patrons dans les écosystèmes et qu’ils expriment les stratégies et les interactions des populations
(Southwood, 1977). Les études utilisant les habitats comme indicateurs dans les environnements marins sont variées et considèrent différentes caractéristiques des communautés telles que la composition de la communauté, la diversité, la composition et la diversité fonctionnelles (ex. Törnroos et al., 2013; Caldow, 2015; Coleman et al., 2015). Aussi appelée la cartographie de l’habitat marin (Marine habitat mapping ou MHM), l’exploration des liens entre les organismes benthiques et la cartographie marine permet de mieux définir les priorités de conservation et de gestion (Cogan et al., 2009). Ces études sont réalisées autant sur les plates-formes océaniques (ex. Rattray et al., 2009; Buhl-Mortensen et al., 2015), dans les zones côtières (ex. Brown et Collier, 2008); ou dans les zones intertidales/littorales (ex. Banks et Skilleter, 2002; 2007; Lauer et Aswani, 2008; Chust et al., 2008). Plus précisément, la création de cartographie des habitats benthiques permet de mieux comprendre la distribution des ressources afin de répondre aux pressions anthropiques (création de réserves marines, aquaculture, exploitation des ressources pétrolières).
De plus, l’utilisation d’invertébrés benthiques reliée à la cartographie des habitats marins est intuitive en raison des caractéristiques de ces organismes. En effet, les invertébrés benthiques vivant soit à la surface des sédiments (épifaune) ou dans les sédiments (endofaune) sont des organismes qui à large échelle s’établissent généralement en association à des facteurs environnementaux qui constituent la définition même des habitats. Soit la température, la salinité, la profondeur, la disponibilité des ressources ainsi que le substrat (Levin et al., 2001; Macpherson, 2002; Lercari et Defeo, 2006).
LES TRAITS FONCTIONNELS
L’évaluation fonctionnelle des communautés à travers une analyse des traits fonctionnels est utilisée dans un nombre croissant d’études dans le but d’approfondir notre compréhension des écosystèmes et de leur réponse aux changements (ex. Airoldi et al., 2008;
Gamfeldt et al., 2015; Coleman et al., 2015). Cette technique permet d’évaluer de nombreux taxons ou perturbations et pourraient permettre une détection de signaux de modification des fonctions dans l’écosystème avant la détection du changement chez les espèces (Mouillot et
al., 2013). Les traits fonctionnels sont ainsi un indicateur écologique pouvant être utilisé dans
les environnements marins. Toutefois, davantage de recherche est nécessaire afin de mieux comprendre les communautés fonctionnelles et l’application des analyses de traits fonctionnels (Beauchard et al., 2017). Les fonctions et processus associés aux différents traits peuvent être classés en deux catégories : (1) les traits réponse qui expliquent les patrons d’occupation de l’habitat. Pouvant, par exemple, expliquer la présence de certains organismes dans un habitat donné. La croissance, la survie, la reproduction et la mobilité sont des tous des traits réponse et, (2) les traits d’effet qui expliquent l’effet de l’activité d’une espèce sur son habitat. Les services écosystémiques et les ingénieurs des écosystèmes sont définis par des traits tels que la création d’habitats (ex. mélange des sédiments/bioturbation) et l’approvisionnement en nourriture (Beauchard et al., 2017). Il existe peu d’études sur la composition en traits fonctionnels d’espèces vivant dans la zone intertidale en Arctique. Krumhansl et al. (2016) ont utilisé les traits fonctionnels afin d’évaluer l’impact anthropique sur les écosystèmes benthiques en Arctique. Ils ont observé une réduction du fonctionnement écologique dans les environnements côtiers et des modifications similaires à celles observées dans les environnements non arctique alors que les communautés benthiques côtières de l’Arctique et leur réponse aux activités anthropiques sont moins connues. Notre étude vise à poursuivre l’acquisition de données de base sur les traits fonctionnels répertoriés dans les habitats de l’Arctique canadien.
LE PROJET ESPACE
Afin d’utiliser les habitats comme indicateurs des communautés, une classification des habitats est nécessaire. Dans l’Arctique canadien, les habitats côtiers ont été classifiés par vidéographie dans le cadre du projet eSPACE (Emergency Spatial Pre-SCAT (shoreline
cleanup assessment technique) for Arctic Coastal Ecosystems). Cette classification des
à partir d’un hélicoptère et a permis l’identification de 25 habitats littoraux distincts (ex. plage de sable, roche-mère, blocs). De l’information sur le substrat, la végétation et la géomorphologie côtière a été utilisée afin de bonifier les connaissances des côtes en Arctique en cas de déversement de pétrole et en prévision d’une augmentation du développement économique en Arctique (Wynja et al., 2015). Ce projet d’Environnement Canada visait notamment à acquérir de l’information afin d’être en mesure de prioriser des zones à nettoyer en se basant sur la susceptibilité à long terme en plus de la présence d’espèces ou d’habitats importants. La classification développée par Wynja et al. (2015) pourrait également être utilisée dans un contexte différent, par exemple, pour la planification d’utilisation locale des côtes, la localisation d’espèces rares ou envahissantes, lors d’études sur l’érosion ou simplement dans le but d’obtenir des données de bases sur les côtes en Arctique. Dans le cadre de leur étude, bien qu’il y ait un volet où sont définis les habitats sensibles, aucun de ces habitats n’a été validé sur la base de la communauté biologique, ce qui n’était pas leur objectif. En effet, des paramètres utiles à la classification des habitats tels que la géomorphologie et le substrat ne fournissent aucune information sur la biologique des habitats.
LA RÉGION DE CHURCHILL
La région choisie dans le cadre de cette étude est la région de Churchill au Manitoba. C’est une région dont les côtes ont été classifiées par le projet eSPACE et où une grande variété de classes d’habitats sont représentées (voir Annexe I). Le port de Churchill était le port le plus actif de l’Arctique canadien (Chan et al., 2012), avant sa fermeture en 2016. La région de Churchill est plus chaude que plusieurs autres régions de l’Arctique, ce qui augmente les risques d’introduction d’espèces aquatiques exotiques (Goldsmit et al., 2014). Au moment où notre étude fut initiée, avant la fermeture du port, Churchill était considéré comme une potentielle porte de sortie pour les exportations de pétrole par bateau (Trynacity, 2017). De plus, du propane était envoyé par bateau vers Churchill suite à la fermeture récente de la voie ferrée menant à Churchill (Martin, 2017), ce qui augmente les risques de
déversements de pétrole ou de propane. Ces inquiétudes pourraient être d’autant plus d’actualité si le statut du port venait à changer.
OBJECTIFS ET HYPOTHÈSES
Dans ce contexte, le but de ce projet était de caractériser les communautés benthiques côtières et les habitats qui y sont associés dans la région de Churchill au Manitoba. Les objectifs spécifiques étaient :
(1) de valider la classification vidéographique des habitats de Wynja et al. (2015) avec des données biologiques en;
(a) vérifiant que la classification des habitats développée par Wynja et al. (2015) peut expliquer les caractéristiques des communautés benthiques telles que la composition en espèces, la biomasse, la diversité et pourrait ainsi être utilisée en tant que prédicteur biologique et,
(b) validant visuellement que la classification basée sur la vidéographie est représentative des données terrain.
(2) d’évaluer la composition fonctionnelle et la diversité fonctionnelle des habitats échantillonnés à l’aide d’indices de diversité.
Les hypothèses étaient que :
(1) les classes d’habitats déterminées par le projet eSPACE peuvent être utilisée afin de prédire les caractéristiques des communautés benthiques, ce qui se reflètera par une faible variabilité pour un même habitat (ex. entre différents segments d’un habitat) et par une variabilité plus élevée entre les différentes classes d’habitat. Plus précisément, les caractéristiques biologiques des communautés seront similaires pour un même habitat et devraient varier entre les classes d’habitat et,
(2) de façon similaire, les classes d’habitat pourront être utilisées afin de prédire la composition fonctionnelle, ce qui permettra d’utiliser la diversité fonctionnelle comme indicateur du fonctionnement de l’écosystème et donc de mieux définir les classes d’habitat. Dans un contexte d’un Arctique canadien en rapide évolution où les besoins en gestion des habitats côtiers pourraient augmenter en lien avec le développement lié à l’augmentation du transport maritime et du développement minier causé par les changements climatiques. L’établissement d’un lien entre la classification des habitats et les caractéristiques biologiques et fonctionnelles des communautés permettrait de faciliter la caractérisation des zones intertidales difficiles d’accès et d’obtenir une meilleure définition des habitats.
Il existe un nombre limité d’études s’intéressant aux communautés benthiques dans la zone intertidale dans l’Arctique et aucune des études répertoriées ne visait à identifier le lien entre les communautés benthiques côtières et leur habitat. L’étude présentée dans ce mémoire présente une avancée importante sur nos connaissances des communautés associées aux habitats intertidaux dans la région de Churchill visant à améliorer la compréhension des communautés intertidales en Arctique afin de les gérer plus efficacement.
VALIDATION DES CARACTÉRISTIQUES BIOLOGIQUES ET FONCTIONNELLES DES COMMUNAUTÉS BENTHIQUES ASSOCIÉES À
DES HABITATS CÔTIERS DANS L’ARCTIQUE CANADIEN
2.1 PREAMBULE
Cet article, intitulé « Validation of the biological and functional characteristics of benthic communities in association with coastal habitats in the Canadian Arctic », a été rédigé par moi-même ainsi qu’en collaboration avec mon directeur Philippe Archambault (Université Laval) et ma codirectrice Kimberly Howland (ministère des Pêches et des Océans). Nous avons tous les trois participé à définir les objectifs de ce projet. En tant que premier auteur, ma contribution à ce travail a été la participation à la planification logistique et à l’échantillonnage ainsi que la réalisation de l’ensemble des analyses et de la rédaction de cet article. Philippe Archambault et Kimberly Howland m’ont guidé dans la réalisation de toutes ces tâches. De plus, la planification logistique n’aurait pas été la même sans la contribution de Chris McKindsey (ministère des Pêches et de Océans) qui a fait la liaison avec Environnement Canada pour l’acquisition des données sur les habitats côtiers et qui a contribué à la méthode d’échantillonnage. De plus, j’aimerais souligner la contribution de Gesche Winkler dans la révision du devis de recherche ainsi que l’apport de nos collaborateurs d’Environnement Canada qui ont fourni les données sur les habitats côtiers sans lesquelles ce projet n’aurait jamais vu le jour.
2.2 VALIDATION OF THE BIOLOGICAL AND FUNCTIONAL CHARACTERISTICS OF BENTHIC COMMUNITIES IN ASSOCIATION WITH COASTAL HABITATS IN THE CANADIAN ARCTIC
2.3 INTRODUCTION
Coastal habitats provide unique conditions which allow a diversity of species to establish and they are an essential economic, social and cultural resource (Rickets and Hildebrand, 2011). It is a location of intense land and ocean interactions where both marine and terrestrial processes have strong influence (Knox, 2000; Ray and McCormick-Ray, 2004; Roff and Zacharias, 2011). The intertidal zone is the transition zone between these environments and is defined as the zone affected by tides (Knox, 2000). Effects of the strong relationship between terrestrial and marine realms have been shown in many studies (Polis et al., 1997; Granek et al., 2009; Rabalais et al., 2009; Ruttenberg and Granek, 2011). In a rapidly changing Canadian Arctic, coastal environments are expected to undergo a growing number of impacts due to climate change evolution (IPCC, 2014). Sea-level rise is already redesigning coastlines through flooding of low lands, erosion, saltmarsh intrusion and formation of new beaches and saline coastal lagoons (Shaw et al.,1998; Proshutinsky et al., 2001; FitzGerald et al., 2008; Nicholls and Cazenave, 2010). Climate change together with the decrease in ice extent and duration is also expected to result in an increase in human activities and coastal development in the Arctic. Development permitted by the opening of new shipping routes and easier access to Arctic’s waters is expected to result in an increase in project and shipping activities (Smith and Stephenson, 2013; Gavrilchuk and Lesage, 2014). Indeed, shipping activity in the Canadian Arctic has already doubled in the past decade (Lasserre et al. 2017). Such changes are predicted to increase propagule pressure and favour establishment and survival of aquatic invasive species transported from more temperate regions (Niimi, 2004; Arctic Council, 2009; Lockwood et al., 2016; Ware et al., 2016). The combined increase in shipping and development is also expected to increase risks of oil spills in the Arctic, with a predicted export of up to 40 million tons of oil and gas per year by 2020 (Borgerson, 2008; Arctic Council, 2009; Khan et al., 2014; Marchenko et al., 2015).
In this context, effective, low-cost sampling methods are required to obtain baseline data on Arctic species and coastal environments that are difficult to collect in this type of environment. The Emergency Spatial Pre-SCAT (shoreline cleanup assessment technique) for Arctic Coastal Ecosystems (eSPACE) project has developed a classification of habitats identified by videography. Visually recorded information on substrates, vegetation and coast morphology were used to classify habitats in order to increase knowledge of the Arctic coasts in case of an oil spill and in support of future economic development in the Arctic (Wynja et al., 2015). Environment Canada pre-SCAT assessment was initiated to allow prioritization of areas for cleanup based on “susceptibility to long-term damage, as well as significant wildlife or important habitats present”. The classified habitats used by Wynja et al. (2015) could also serve other purposes such as local shoreline planning, identification of suitable habitat types for rare or invasive species, erosion studies and generating baseline information on Arctic coasts. While they did include preselected sensitive ecosystems in their classification, none of those were validated for biological communities, as it was not their objective. Indeed, the parameters used such as geology, geomorphology and vegetation are useful in classifying habitats, however, this type of data is broad and does not provide direct information on the biology of various habitats. Churchill in Manitoba is one of the regions where the habitats were classified by the eSPACE. Prior to the closure of its port, at the time this study was initiated, Churchill was under consideration as a gateway for bulk shipping of oil (Trynacity, 2017) and propane supplies are currently being shipped to Churchill after the recent shut down of the rail line (Martin, 2017), thus hydrocarbon spills were also a potential risk. Should the future status of the port change, this could be a renewed concern.
In the management of coastal ecosystems, the ability to prioritize is essential considering the extent of habitat that could be affected by oil spills and the reality of limited resources available to face this type of incident. It is thus important to assess zones which are more at risks of losing rare ecosystem functions and habitat types. Multiple studies have applied different methods to facilitate management. One of these methods is the use of indicators such as habitats. In a growing number of studies, habitats are used as predictors for biological community characteristics. Habitats been used as a unit in ecology for many
years (ex. Noss et al., 1987; Dalleau et al., 2010; Brown et al., 2011). They are the reflection of patterns in ecosystems, such as the expression of population strategies and their interactions (Southwood, 1977). Studies using habitats as predictors in the marine environment are varied and different characteristics of the communities have been considered, namely, community composition, diversity, functional composition and functional diversity (Törnroos et al., 2013; Caldow, 2015; Coleman et al., 2015).
Besides, functional assessment of communities, functional trait analysis has been used in a growing number of studies to deepen our understanding of ecosystems and their responses to change (ex. Airoldi et al., 2008; Gamfeldt et al., 2015; Coleman et al., 2015). This is a rapid method to evaluate a wide suite of taxa and disturbances and could provide early signals of the loss of functions before species loss happens (Mouillot et al., 2013) thus serving as an ecological indicator in management of marine environments. However, more research is needed in the understanding of functional communities and the applicability of functional trait analysis (Beauchard et al., 2017). Associated functions and processes can be classified in two main categories: (1) response traits are those associated with habitat occupancy patterns (e.g., growth, survival, reproduction, mobility) and (2) effect traits are those that can explain the effect of species’ activity on their habitat. Those species can provide ecosystem services and can be ecosystem engineers and they are associated with traits such as habitat creation (e.g. sediment mixing/bioturbation) and food provision (Beauchard et al., 2017). Intertidal studies on species functional traits composition on Arctic coastal ecosystems are scarce. Although Krumhansl et al. (2016) used species traits to assess human impacts on benthic ecosystems in the Arctic. They found reduced ecological functioning at near-shore sites and shifts in traits which are associated with loss in ecosystem functions. Those shifts were similar to those described in non-Arctic environments even though we know less about near-shore benthic communities of the Arctic and their response to human activities. Our study will thus provide an interesting baseline on functional traits found in different Arctic habitats.
In this context, the goal of this project was to characterize coastal benthic communities and associated habitats in Churchill, Manitoba. The specific objectives were: (1) to ground truth Wynja et al. (2015) videographic classification of habitat with biological data by
(a) verifying if the videographic habitat classification used by Wynja et al. (2015) explained benthic community characteristics such as species composition, biomass, diversity and thus could serve as biological indicator,
(b) visually validating if the classification based on videography was representative of the biological and geomorphological ground data.
(2) to evaluate the functional composition and the functional diversity of sampled habitats through diversity metrics.
Hypotheses were that:
(1) the habitat classes assigned by the eSPACE project can be used to predict benthic community characteristics, reflected through low within habitat variability (i.e., between segments within habitats) and high among habitat classes variability. More precisely, characteristics of the biological community will be similar within a given habitat class and should vary among habitat classes and,
(2) similarly, the habitat classes will allow to predict functional composition thus permitting the use of functional diversity as an indicator of ecosystem functioning and in a more complete definition of habitat classes.
Showing the link between different habitat classes and the community’s biological and functional characteristics will allow for a quick assessment of habitats. This could be applied to management of a rapidly changing Canadian Arctic, for example, in case of an oil spill where a rapid cleanup decision needs to be made based on the available information.
2.4 METHODOLOGY
Study site
The study was conducted in Churchill, Manitoba in the summer 2016. Macroinvertebrates and algae were collected in order to get more complete information on different Arctic coastal habitats and to verify the relationships between habitat classification and biological composition. Churchill was chosen since its coastlines had been classified by the eSPACE project and a wide variety of habitat classes were represented (see Annex I). The port of Churchill was the most active port in the Canadian Arctic prior to its closure in 2016 (Chan et al., 2012) and the environment is warmer than many regions in the Arctic thus risk of aquatic invasive species introductions is high (Goldsmit et al., 2014).
Sampling
Six distinct habitat classes based of Wynja et al. (2015) were sampled (Table 1). For each habitat class, four randomly selected 100 m segments were visited at low-tide. Sampling only occurred when tides were lower than 1 m based on tide tables. A photo was taken of each segment and a visual characterization of the intertidal zone was made to assess the Wynja et al. (2015) classification of habitats. In each segment, the visual characterization was done by assessing the percentage of each type of habitat corresponding to the descriptions in Wynja et al. (2015). For each segment, 15 quadrats (0.5 m X 0.5 m) were randomly tossed in the lower mediolittoral zone parallel to the coastline. Quadrats were stratified among visually characterized habitat types to be representative of the variability within each segment (e.g. if there was 25% sand, 10% boulder and 65% pebbles/cobbles, 3 quadrats were tossed in sand, 2 quadrats in boulder and 10 quadrats were tossed in pebbles/cobbles). For each segment, time was recorder and a habitat characterization through a broad scan survey was realized. For each quadrat, coordinates were recorded and a photograph of the sampled quadrat (labelled) was taken. Then, epifauna was collected in two stages: first, the canopy composed of algae was manually collected and brought back for weight measurements and second, all remaining organisms were collected. Then, to collect
infauna, a smaller quadrat (0.25 m X 0.25m) was thrown inside the previous quadrat and sediments were dug up to 15 cm depth and sieved in a combination of stacked sieve buckets ranging between 1000–4000 μm. Additionally, every visible species of algae or macroinvertebrate within the 100 m segments were recorded during a one-hour beach walk throughout the low tide period by a trained observer. To standardize sampling effort, in each segment, the 100 m of shoreline was always measured through linear distance in parallel to the water line (Archambault and Bourget, 1996). Samples were preserved in 4% seawater-formaldehyde solution buffered with sodium tetraethyl-borate or frozen for later identification in the laboratory. All organisms were counted and identified to the lowest possible taxonomic level. Taxonomic names were verified using the World Register of Marine Species (WoRMS, 2018). Biomass was based on formaldehyde wet mass (after thawing) at 0.001 g precision for macroinvertebrate and 1 g precision for algae. All biomasses were reported in metre-square.
We visually validated the classification of habitat from the eSPACE project. While most sampled habitats were well classified, we found a habitat that was completely misclassified. The Marsh habitat we sampled was not a Marsh habitat described by Wynja et al., 2015 which has “a shoreline periodically or permanently flooded, marshes have no trees or bushes (<25%), and in-season vegetation (>25% local vegetation density) can be seen emerging above water”. The habitats that we explored did not have a shoreline periodically or permanently flooded, there were no trees or bushes or in-season vegetation in a proportion of >25% local vegetation density. In fact, this habitat was similar to the mixed tidal flat habitat except it was covered by a higher density of Fucus algae. Since the habitat did look different from the other sampled habitat, it was sampled and named posteriorly as Boulder-strewn tidal flat. It was named following advice from a geographer (Antoine Boisson, pers. comm., 2018)
Table 1. Description of habitats according to Environment Canada shorelines types.
Habitat Description
Bedrock Bedrock shorelines are impermeable outcrops of consolidated native rock. Boulder
beach/bank
An unconsolidated accumulation of boulders occurs in the shore zone. Boulders are, by definition, >256 mm in diameter.
Boulder-strewn tidal flat*
The tidal flat is composed of sand or mud, plus (>10%) of boulders. Small amounts (<10%) of granules, pebbles, cobbles, silts or clay may be present.
Mixed sediment beach
The beach is composed of sand plus any combination (>10%) of granules, pebbles, cobbles, and boulders. The interstitial spaces (voids) between the coarse pebble or cobble fractions are infilled with sand or granules.
Mixed tidal flat
The tidal flat is composed of sand or mud, plus any combination of coarse sediments (>10%) such as granules, pebbles, cobbles, and boulders.
Sand beach The beach is composed of sand for which the grain-size diameter is in the range of 0.0625 to 2.0 mm. Small amounts (<10%) of granules (2–4 mm in diameter), pebbles, cobbles, boulders, silts, or clay may be present.
*Boulder-strewn was not originally in the classification used by Wynja et al. (2015). It was used to replace shorelines classified as Marsh but which did not correspond to the visual validation.
Source: Wynja et al., 2015
Functional traits data compilation
Functional traits were divided into 9 categories for a total of 40 trait modalities (Table 2). Traits were selected based on available data for taxa found in the study and traits used previously in the literature (Oug et al., 2012; Krumhansl et al., 2016; Beauchard et al., 2017). Traits were assigned to taxa when the information was available after a meticulous search among peer-reviewed journals, grey literature, taxonomic texts and online databases (WoRMS, 2017; Polytraits, 2017; Encyclopedia of Life: TraitBank, 2017; MarLIN: BIOTIC, 2017) (see Annex II). Taxa with insufficient information were removed from the analysis. A modified fuzzy coding approach (Chevenet et al., 1994) was used to assign scores for each trait. The original fuzzy coding methodology assigns a number from 0 to 3 according to
affinity of traits modalities to account for multiple possibilities of modalities (e.g. Gammarid amphipods might have multiple life habits such as crawlers and swimmers). For example, in this case, scores of 1 and 2 would be attributed to either crawler or swimmer (with the higher score assigned to the dominant modality), respectively, for life habits for a total of 3. This method requires knowledge of which modality is dominant for each species. However, we argue that the precise information needed to make such decisions is rarely sufficient. Our modified scoring assigns a number between 0 and 1 to equally distribute weight between presence of trait modalities (e.g. for gammarid amphipods life habits, we would give a score of 0.5 for crawlers and 0.5 for swimmers and 0 to all other modalities).
To test for differences in functional composition among habitat in functional trait analysis, a community-weighted mean matrix is calculated by multiplying a site by species matrix and a species by traits matrix. Weighting was done for density, biomass and presence or absence. Functional diversity was measured using the two following indices: functional richness which is the volume of the functional space occupied by the community (Villéger et al., 2008) and functional dispersion which is the mean distance in traits space of individuals from the centroids of all species (Laliberté and Legendre, 2010). Functional diversity indices were calculated with the FD package (Laliberté and Legendre, 2010) in R.
Statistical analyses
The effect of habitats on benthic community characteristics and functional diversity indices were tested with a permutational analysis of variance (PER-ANOVA) using Habitat as a fixed factor (six levels: Bedrock, Boulder, Boulder-strewn tidal flat, Mixed Sediment, Mixed tidal flat, Sand) and Segment as a random factor nested within the Habitat factor (4 segments per habitat). Data was combined to include both epifauna and infauna after reporting densities in metre-square for each. Mean community characteristics considered in this study were density (ind. m-2) and biomass (g. m-2) which were averaged based on the 15
quadrats within each segment. The following diversity metrics were calculated based on invertebrate density data: Shannon-Wiener’s diversity (H’, loge), Pielou’s evenness (J’),
characteristics were tested for invertebrates and algae separately and no density data could be collected for algae. Functional richness and functional dispersion were calculated based on both density and biomass and using data for both invertebrates and algae. Post-hoc pairwise comparisons were applied to test differences in invertebrates’ community characteristics between habitats. A separate analysis of richness was done to include diversity data collected for each segment with the timed beach walk.
Using the same statistical design as above, multivariate analyses were carried out on community composition and functional composition for square-root transformed biomass and density data. Gower similarity (S19) was chosen in this analysis because it excludes double zeros. We made the assumption that absence of a species in samples does not mean it is not present and if so, absence of species in more than one site (double zero) does not make those sites similar (Legendre and Legendre, 2012). Presence or absence data was used with Sorenson similarity (S8) (Clarke and Gorley, 2006). Permutated analysis of variance (PERMANOVA) was used to test for differences in community composition and functional composition between habitats with 9999 permutations followed by post-hoc pairwise comparisons. Non-metric multidimensional scaling (nMDS) was used to illustrate ordination of samples using standardized distances. For better visualization, distances among centroids were calculated on PCO axes for each segment of the habitats. Homogeneity of dispersions within groups was tested using PERMDISP. Identification of the top 3 taxa contributing most to the dissimilarity between habitats was done using a similarity percentage test (SIMPER) on a Bray-Curtis similarity matrix. A Pearson correlation and Draftsman’s plot were performed on community-weighted mean matrices to explore correlations among traits.
Algae Habitat-forming Exposed
Adult life habit Attached/sessile
Tubicoulous/permanent tubes
Burrower
Surface crawler
Swimmer
Body size Small <2 cm
Medium >2 cm <5 cm
Large >5 cm
Trophic mode Suspension/filter feeder
Scraper/grazer Surface/deposit feeder Subsurface/deposit feeder Dissolved matter/symbionts Scavenger Carnivore/omnivore Photoautotroph Robustness Fragile Intermediate Robust
Sediment mixing /bioturbation None
Diffusive/active burrower
Gallery burrower
Surface dweller
Tube burrower
Life span <1 year
1–5 years
>5 years
Reproductive frequency Less than once a year
Once a year
More than once a year
Reproductive techniques Asexual (budding)
Broadcast spawner
Demersal eggs
Brooder/viviparous
Oviparous
Larvae type Planktotroph (feeding larvae)
To explain intra-habitat variability, salinity was investigated using indicators (marine-Hudson Bay vs. estuarine Churchill River). The effect of salinity on community composition (presence or absence data) was tested with a permutated analysis of variance (PERMANOVA) with Salinity as a fixed factor (two levels: high salinity (marine-Hudson Bay) and low salinity (estuarine-Churchill River)) with 9999 permutations.
To test non-randomness significance between community-weighted mean matrix and species composition matrix, a Procrustes test (protest) was performed using non-averaged data. Results are expressed as a correlation-like statistic derived from symmetric Procrustes sum of squares.
PER-ANOVAs, PERMANOVAs, nMDS, diversity metrics and Draftsman’s plots were performed using PRIMER-E software version 6 (Clarke and Gorley 2006). Functional diversity, Procrustes test (vegan) and Pearson’s correlations (pgirmess package) were calculated in R version 3.3.3. Statistical significance at α <0.05 was used for all tests.
2.5 RESULTS
Community characteristics of coastal habitats
As predicted, results of univariate PER-ANOVAs showed an effect of Habitat on all mean invertebrate community characteristics but there was also an effect of Segment on every mean invertebrate community characteristic (Table 3). Density (N) of benthic invertebrates in Boulder-strewn and Sand was higher than most sampled habitats (PER-ANOVA; F(5,18,336) = 7.72, p <0.001; Figure 2a). Sand also had higher biomass of
invertebrates compared to all other habitats, while Boulder-strewn was higher than Bedrock and Mixed Sediment (Figure 2b). For Shannon-Wiener’s diversity index (H’) and richness (S), Boulder-strewn, Mixed tidal flat and Sand had higher values than Bedrock, Boulder and Mixed sediment (Figure 2c-d). Pielou’s evenness (J’) and taxonomic distinctness (∆*) values for Bedrock were lower than most habitats.
Results of univariate PER-ANOVAs on algal community characteristics showed a significant effect of Habitat on mean algal biomass, richness, Shannon-Wiener’s diversity and Pielou’s evenness (Figure 3). There was also a significant effect of Segment on richness. Algal biomass in the Boulder-strewn tidal flat was higher than in all other habitats (PER-ANOVA; F(5,16, 185) = 7.13, p <0.01). For richness (S), Bedrock, Boulder and Boulder-strewn
tidal flat had higher values than Mixed sediment, Mixed tidal and Sand (PER-ANOVA; F(5,18, 336) = 8.45, p <0.001). For Shannon-Wiener’s diversity (H’) and Pielou’s evenness (J’)
Bedrock had higher values than all other habitats (PER-ANOVA H’; F(5,18, 336) = 5.46, p
<0.01).
Overall richness was also investigated. It included data for both invertebrates, algae as well as the data from the timed beach walk. Results were similar to invertebrate richness with higher richness in Mixed tidal flat, Boulder-strewn and Sand (see Annex III).
Communities composition of coastal habitats
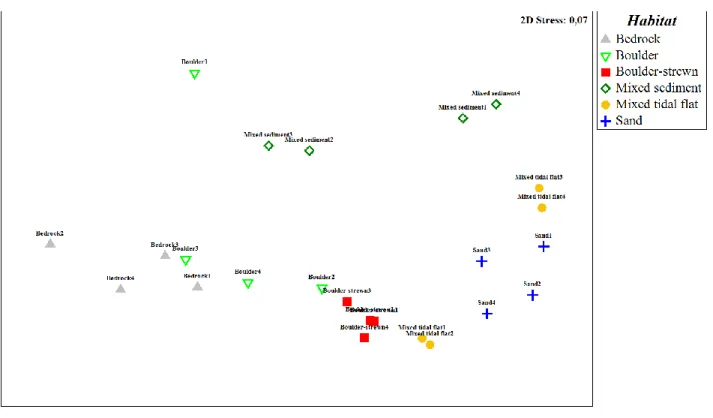
Results of multivariate PERMANOVAs demonstrated an effect of Habitat on invertebrate community composition (density, biomass and presence or absence) (Table 4). Pairwise comparisons were significant mostly for Boulder-strewn and Sand but varied between density, biomass and presence-absence. nMDS representation of community composition on centroids of segments illustrated a strong grouping by habitat class with Boulder-strewn tidal flat, Bedrock and Sand segments grouping most tightly while communities in Mixed sediment and Boulder segments were more variable (Figure 4). Communities in Sand and Mixed tidal segments also overlapped slightly.
SIMPER analysis on presence or absence data showed dissimilarity between each habitat combination with different taxa contributing to the dissimilarity between habitats (Table 5). For example, a high average presence of Macoma balthica in Mixed tidal flat and Sand and a low average presence of this species in Bedrock, Boulder, Boulder-strewn and Mixed sediment explained about 9-13% of the dissimilarity between those habitats.
average presence in Bedrock and Boulder explaining dissimilarities with all other habitats.
Littorina taxa (Littorina saxatilis and Littorina sp.) were highly present in Boulder-strewn
habitats and less present in Boulder, Mixed sediment, Mixed tidal flat and Sand, while
Mytilus sp. had a high average presence in Boulder and Boulder-strewn locations, explaining
dissimilarities with all other habitats. Nematodes and oligochetes were present in Mixed sediment explaining the dissimilarities between this habitat and all other habitats.
For the algal communities, results of multivariate PERMANOVAs demonstrated an effect of Habitat on biomass (PERMANOVA; F(5,16,185) = 2.44, p =0.032) and an effect of
both Habitat and Segment on presence-absence (PERMANOVA; F(5,16,185) = 2.68; 3.39, p
=0.022; p <0.001). Algal composition of all habitats were dominated by three Fucus taxa, with Fucus distichus distichus having the highest biomass in all habitats (Figure 5). The highest biomass of Fucus distichus evanescens was found in Sand while Bedrock had the highest biomass of Fucus sp. (Figure 5). This could be because specimens in this habitat are smaller and not identifiable to species level. Diatoms were found in low biomass in all habitats with the exception of Boulder-strewn. Other taxa of algae were of extremely low biomass and thus not visible in this graph.
boulder-strewn tidal flat, mixed sediment, mixed tidal flat, sand) and Segment nested in Habitat factor (random with 4 segments per habitat) on mean invertebrate community characteristics: richness (S), density (N), biomass, Shannon-Wiener diversity (H’), Pielou’s evenness (J’) and taxonomic distinctness (∆*). To meet assumptions, PER-ANOVAs were permuted (9999). Significant effects (p < 0.05) are indicated in bold
Variables Source df MS F p S Habitat 5 236.96E+00 9.060 <0.001 Segment(Habitat) 18 26.15E+00 5.470 <0.001 Error 336 4.78E+00 N Habitat 5 3.06E+07 7.720 <0.001 Segment(Habitat) 18 3.96E+06 4.548 <0.001 Error 336 8.71E+05
Biomass Habitat 5 8.93E+05 12.622 <0.001
Segment(Habitat) 18 7.07E+04 5.590 <0.001 Error 336 1.27E+04 H' Habitat 5 3.81E+00 8.074 <0.001 Segment(Habitat) 18 0.47E+00 3.073 <0.001 Error 336 0.15E+00 J’ Habitat 5 0.47E+00 2.867 0.039 Segment(Habitat) 18 0.16E+00 3.104 <0.001 Error 336 0.05E+00 Δ* Habitat 5 6514.40E+00 4.765 0.007 Segment(Habitat) 18 1367.20E+00 2.523 <0.001 Error 336 541.86E+00
Figure 2. Mean (± SE) invertebrates community characteristics for the six habitat classes (n=60). (a) density (ind. m-2); (b) biomass (g m-2); (c) richness (no. of taxa quadrat-1); (d) Shannon-Wiener’s diversity index (H’); (e) Pielou’s evenness index (J’); (f) taxonomic distinctness (Δ*). Different letters (a-c) above bars indicate significant differences (p <0.05) based on pairwise comparisons (see Table 2)
Figure 3. Mean (± SE) algal community characteristics for the six habitat classes (n=60). (a) biomass (gm-2); (b) Shannon-Wiener’s diversity index (H’); (c) richness (no. of taxa quadrat-1); (d) Pielou’s evenness index (J’). Different letters (a-c)
community composition (√ density, √ biomass and presence or absence). Significant effects (p <0.05) are indicated in bold
Density Biomass Presence or absence
Source Habitat Segment(Habitat) Error Habitat Segment(Habitat) Error Habitat Segment(Habitat) Error
Df 5.*** 18.*** 333.**** 5.*** 18.*** 333.**** 5.*** 18.*** 333,****
MS 7175.1** 1173.6** 325.8*** 4643.8** 1139.9** 345.13** 38629.0** 5167.8** 1034.8***
F 6.116 3.603 4.075 3.303 7.478 4.994
p(perm) <0.001 <0.001 <0.001 <0.001 <0.001 <0.001
Pair-wise tests ttttt p(perm) ttttt p(perm) ttttt p(perm)
Bedrock, Boulder 1.18 0.246* 1.63 0.070* 1.73 0.028*
Bedrock, Boulder-strewn 4.06 0.015* 3.29 0.003* 4.04 0.016*
Bedrock, Mixed Sediment 1.62 0.103* 1.58 0.094* 3.13 0.028*
Bedrock, Mixed Tidal 1.77 0.039* 1.53 0.072* 3.37 0.031*
Bedrock, Sand 4.00 0.019* 3.49 0.008* 5.22 0.026*
Boulder, Boulder-strewn 2.75 <0.001* 0.88 0.618* 2.09 0.013*
Boulder, Mixed Sediment 1.41 0.090* 1.47 0.082* 1.87 0.054*
Boulder, Mixed Tidal 1.23 0.151* 0.68 0.874* 2.36 0.004*
Boulder, Sand 3.21 0.016* 2.39 0.015* 3.59 0.020*
Boulder-strewn, Mixed Sediment i 3.26 <0.001* 2.40 <0.001* 2.43 0.003*
Boulder-strewn, Mixed Tidal 1.77 0.003* 1.88 <0.002* 2.28 0.002*
Boulder-strewn, Sand 3.73 0.019* 3.73 0.011* 4.22 0.011*
Mixed Sediment, Mixed Tidal 1.57 0.023* 1.15 0.249* 1.93 0.017*
Mixed Sediment, Sand 3.33 0.017* 2.51 0.016* 2.75 0.021*
Mixed Tidal, Sand 2.00 0.028* 1.94 0.024* 1.03 0.340*
Figure 4. Non-metric multidimensional scaling (nMDS) ordination on centroids of community composition from six habitat classes (bedrock, boulder, boulder-strewn tidal flat, mixed sediment, mixed tidal flat and sand; n=60). Based on Sorenson similarity on presence or absence data. Circles were hand drawn to improve visualization