Science Arts & Métiers (SAM)
is an open access repository that collects the work of Arts et Métiers Institute of
Technology researchers and makes it freely available over the web where possible.
This is an author-deposited version published in: https://sam.ensam.eu
Handle ID: .http://hdl.handle.net/10985/13355
To cite this version :
Cécile NICOLI, Jean-François CARTON, Alexis VAUCHERET, Philippe JACQUET - Deoxidation
Impact on Non-Metallic Inclusions and Characterization Methods - Journal of casting and
materials engineering - Vol. 1, n°4, p.97-102 - 2018
Deoxidation Impact on Non-Metallic Inclusions
and Characterization Methods
Cécile Nicoli
a, b, c*, Jean-François Carton
b, Alexis Vaucheret
a, c, Philippe Jacquet
a, c a LaBoMaP, Arts et Métiers ParisTech, 71250 Cluny, Franceb CastMetal, 1 Boulevard de la Boissonnette, 42110 Feurs, France
c Université de Lyon, ECAM Lyon, INSA-Lyon, LabECAM, F-69005 Lyon, France
*e-mail: cecile.nicoli@ecam.fr
Received: 22 September 2017/Accepted: 13 December 2017/Published online: 31 January 2018 This article is published with open access at AGH University of Science and Technology
Abstract
Deoxidation is an unavoidable step in the elaboration of steel. The study of its influence could improve the quality of low-car-bon steel (0.20–0.25 wt.% of carlow-car-bon). There are many deoxidation methods, and the most-common one consists of adding aluminum. Although it is a classic method, determining the optimal process parameters (quantity, yield, etc.) could be very sensitive. Deoxidation plays a determining role on inclusion cleanliness, especially on sulfide morphology. In order to control the efficiency of deoxidation, different techniques can be used. In this paper, an automated counting procedure on a scanning electron microscope with a field emission gun (FEG-SEM) is presented. This method was applied on samples cast in our lab-oratory under different deoxidation conditions. According to this, the resulting inclusion population is correlated with the aluminum content to find the optimal process parameters.
Keywords:
sulfide morphology, deoxidation, non-metallic inclusions, low carbon steel, SEM- FEG 1. INTRODUCTION
One constant improvement taking place in metallurgy is steel cleanliness. During steelmaking after melting, one im-portant step is deoxidation. This step is accomplished by adding elements that react with oxygen to form oxides [1]. These will migrate into the slag casted. Several alloys can be used for deoxidation [2]. In this study, the aim is to de-oxidize as simply as possible and still have good steel clean-liness. The choice was made to add aluminum at different steps of the process. Aluminum is already being used in fac-tories as the only deoxidizer [3]. The addition of aluminum will form Al2O3, which can create solid inclusions that are
deleterious for steel mechanical properties such as impact toughness and fatigue. Aluminum also has an impact on the shape of the MnS inclusions [4–6]. The aluminum residu-al content should not fresidu-all below 0.015 wt.% to prevent the apparition of Type II MnS – the worst type for mechanical properties [6, 7].
There are three types of sulfide inclusions [8]. Type I is spherical, gray, and randomly distributed, and it is the least-deleterious of the three types. Type II is elongated, gray or yellowish, and aligned more or less discontinuous-ly; this is the most-deleterious for steel. Type III is polyhe-dral, gray, and located at the triple seals of the solidification grains. Examples of sulfide inclusions are shown in Figure 1.
Fig. 1. Example of sulfur inclusion: a) Type I, ×800; b) Type II, ×500; c) Type III, ×500 [9]
98 Deoxidation Impact on Non-Metallic Inclusions and Characterization Methods
There are also oxide inclusions; these are round and black not at all easy to see with an optical microscope. Other types of inclusions exist, but they are not found in this grade of steel.
The study of deoxidation will be done through a chem-ical analysis and counting. The use of a spectrometer and SEM-FEG will allow us to observe its effects. In order to do this, a casting protocol must be established, and a compar-ison with existing methods is necessary.
2. EXPERIMENTS 2.1. Steel elaboration
The specification of the steel used is G20 Mn5 (AFNOR) or 1.6220 (AISI) and its composition is described in Table 1.
During this work, ingots are poured in green sand molds in our laboratory. The melting takes place in a medi-um-frequency induction furnace with a maximum power of 100 kW and capacity of 10 liters. The volume of the cast-ings is 2.1 liters: sufficiently small to remain on the lab-oratory scale but sufficiently large to maintain a certain representativeness of the industrial parts. The ingot was previously designed by a numerical simulation thanks to the QuikCAST software: it takes 10 secs to fill the mold and about an hour to solidify. The ingot’s dimensions are presented in Figure 2.
All cast ingots are analyzed in the laboratory via two main characterization techniques: spark spectrometry (for their chemical composition) and FEG microscopy (for the quantification of the inclusion population). This meth-od will be detailed in Paragraph 2.2.
In order to demonstrate the influence of deoxidation on the inclusion property, it was necessary to set up a casting
protocol to control and vary the deoxidation of the steel. For this, two types of deoxidation were carried out in this study:
• According to industrial processes that currently use 1 kg of Al per ton of steel, some aluminum was added directly inside the furnace to kill the bath.
• Additional varying quantities of aluminum were added inside the ladle to play a role in the microstructure.
Two meltings were made in this study; the protocol of the aluminum addition is described in Table 2. For Melting 1, aluminum was added only in the ladle, so Step 2 from Figure 3 is skipped. For the first pouring, aluminum was placed at the bottom of the ladle, and for the second and third pouring, it was added in the middle of the ladle.
Table 1
Specification of steel used in this study
C Si Mn P S Cr Mo Ni Al
0.17–
0.23 <0.4 1.00–1.50 0.035 0.035 <0.40 <0.10 <0.40 <0.020
Table 2
Method to Al addition in steel
Melting 1 Melting 2 Test Al addition Test Al addition Furnace,
g Ladle, g Furnace, g Ladle, g
1 0 Bottom 8.7 4 60 0
2 0 Middle 7.0 5 60 Middle 32 3 0 Middle 7.3 6 60 Middle 17.5
– – – 7 60 Middle 8.4
Fig. 3. Foundry process with specific deoxidation
Step 1: before heating loading the 10-liters furnace
Step 2: aluminium
addition Step 3: pouring melt steelin ladle and Al addition Step 4: pouring in mold
60 kg ingots: grade G20 Mn5
Heating (2h) until total melting
Aluminum: 1 kg/ton.
For 60 kg of steel, 60 g of aluminium added Aluminum is melted The bath is killed
Al addition
Fig. 2. Ingot dimensions
Theoretical values L = 175 mm l = 140 mm e = 40 mm Dms = 105 mm Htot = 158 mm Voltot= 2.1 L Htot
For Melting 2, aluminum was added in the furnace (Step 2, Fig. 3) and a second addition was made in the ladle for Tests 5, 6, and 7. For Test 4, no aluminum was added in the ladle, so part of Step 3 was skipped.
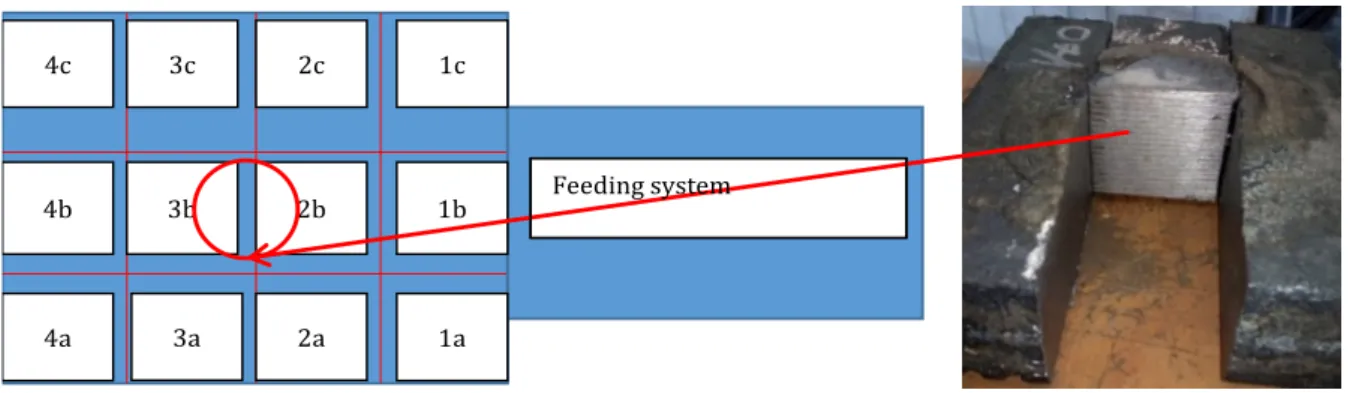
The ingots are cut, and a sample is withdrawn in the cen- ter as shown in Figure 4. SEM analyses are made in the center of the ingot on a surface of 11 mm² – the same sur-face observed in other competing software [10] for these kinds of analyses.
2.2. Characterization methods
To analyze the ingots’ chemical compositions, spark spec-trometer HORIBA has been used. In order to define the steel cleanliness, a method has been defined many years ago and is described in the standard NF EN 10247 [8]. This consists in counting inclusions on 20 random fields with ×500 mag-nification. All types of inclusions have then been classified in a table, and the coefficients have been calculated to de-fine the steel cleanliness. One drawback of this method is that some inclusions may be missed because the observer will not have distinguished them from the porosity.
In our study, the identification and classification of the in-clusions has been realized automatically on a JEOL SEM-FEG (Scanning Electron Microscopy – Field Emission Gun). Image analysis software AZTEC (developed by Oxford) identified the different shades of gray of a sample to de-fine the morphology of the inclusion and give its chemical composition by an EDS analysis. The chosen magnification is ×500 (the same as the optical method), referring to the NF EN 10247 norm [8, 11, 12]. For this, a meticulous metal-lographic preparation is obligatory. The camera movement and EDS analyses are automated. The scanned fields are saved for possible future review.
The first step of this analyze is the acquisition of the first field (Fig. 5). The size of the field corresponds to the size of the optical method. The gray levels are defined in such a way as to detect a maximum number of particles (no mat-ter their type). The studied area (as defined in Figure 4) has to be representative of the total sample in order to detect all types of inclusions.
The second step is automation. A large surface is defined by the operator; the software divides this large area into elementary fields (the same area as for the optical meth-ods) and detects and analyzes each particle inside each
elementary field. The chosen surface is determined in the software, and on each field, particles are detected and then analyzed. Several surfaces can be examined (as shown in Figure 6). This means that different samples can be ana-lyzed during the automation. In Figure 6, we can see one surface whose automation is done and another surface whose analysis is still in progress; each light gray (green) part corresponds to one field. The size of the field is the same as that presented in Figure 5.
Fig. 4. Ingot cutting for analysis
1c 1b 1a 2a 3a 3b 3c 4c 4b 4a 2c 2b Feeding system
Fig. 5. Field and detection of particles in AZTEC software
Fig. 6. Analyses in progress on AZTEC software: 1– area
complete-ly anacomplete-lyzed; 2 – studied area in progress; 3 – elementary fields al-ready analyzed
1 2 3
100 Deoxidation Impact on Non-Metallic Inclusions and Characterization Methods
The last step is classifying the particles thanks to chemi-cal analyses. The whole defined area chosen by the operator can be analyzed, or only a part of it (randomly selected by software). The method of classifying the particles is done according to their chemical composition and morpholo-gy. The classification of the morphology is made thanks to determining the threshold of the ratio of the equivalent diameters. It is comparable to the classification used in competing software [10]. This classification will apply to all of the particles after analysis and is the same for each sur-face evaluated. The software also identifies the shape of the inclusions, so a classification of the different types of sulfide inclusions is made [8].
As the system is automated, the time-saving is enormous when compared to conventional observation under an opti-cal microscope. The conventional method is based on the counting of inclusions on 20 random fields of the same size as in Figure 5. The covered area is then less wide than with the software, and the accuracy for detecting the inclusions is subjective to the observer. For the same amount of time it takes to count the inclusions in 20 fields in the optical meth-od, around 80 fields will be analyzed with the software; and more, the chemical composition of the inclusions will be determined, and shape measurement will be done. Another advantage is the easier way of distinguishing the porosity from the inclusions (thanks to the chemical composition). 3. RESULTS
3.1. Aluminum addition
The aluminum addition is based on the proportion used in the industry, which means 1 kg/ton of steel.
For Melting 1, aluminum was added only in the ladle. For the first pouring (1), aluminum was added at the bottom of the ladle, and for the second (2) and third (3) pouring, alumi-num was added in the middle of the ladle. If it refers to Fig- ure 3, Step 2 is skipped. No aluminum is added in the furnace. In the second melting, aluminum is added in the fur- nace and in the ladle. All steps from Figure 3 are realized.
Table 3 shows the residual amount of aluminum in the steel. Test 1 (aluminum added in the bottom of ladle) shows that it is better to add aluminum in the middle of the ladle. Furthermore, the carbon content is far from the expected value (0.31 wt.%).
In the case of a unique addition in the furnace (Test 4), no residual aluminum is detected, as it was totally consumed. Only the aluminum added in the ladle appears in the resid-ual amount.
The aluminum’s addition in the furnace is necessary for killing the bath. It also reduces the activity in the oxygen, which can create defects like porosity in the steel. The alu-minum completely reacts with the oxygen in the furnace. This can explain the very low residual amount of aluminum in the steel in Test 4.
Figure 7 shows that residual aluminum is proportional to aluminum added in the ladle. The aluminum is well-in-tegrated; so, the oxygen activity must be very low, and the process of pouring steel from ladle to mold is not enough to generate a renewal of oxygen activity.
3.2. Impact of aluminum deoxidtion on steel cleanliness
SEM/FEG analyses were made on three types of deoxida-tion (as seen in Table 2):
• Aluminum added in furnace, Test 4, • Aluminum added in ladle, Tests 2 and 3, • Aluminum added in both, Tests 5, 6, and 7.
Then, these particles are classified and reported in Table 4.
Table 3
Spectrometer analyzes of different ingots
– Test C Mn Si S P Ni Cr Mo V Al Cu Melting 1 1 0.31 0.57 0.24 0.017 0.02 0.02 0.11 0.01 0.01 0.027 0.03 2 0.26 0.54 0.22 0.016 0.017 0.02 0.11 0.01 0.01 0.044 0.03 3 0.23 0.49 0.19 0.015 0.016 0.02 0.10 0.01 0.01 0.045 0.03 Melting 2 4 0.20 0.36 0.07 0.009 0.015 0.02 0.10 0.01 0.01 0.001 0.03 5 0.23 0.41 0.11 0.013 0.017 0.02 0.10 0.01 0.01 0.120 0.03 6 0.22 0.45 0.12 0.012 0.017 0.02 0.10 0.01 0.01 0.070 0.03 7 0.22 0.45 0.12 0.011 0.017 0.02 0.10 0.01 0.01 0.040 0.03
Fig. 7. Aluminum: residual amount (wt.%) as a function of quantity
added, g 0 5 10 15 20 25 30 35 40 0.00 0.02 0.04 0.06 0.08 0.10 0.12 0.14 Test 5 Test 6 Test 2, 3 and 7 Al in ladle, g Al re sid ua l a m ou nt, w t.% Test 4
The important amount of porosity in Tests 2 and 3 show that deoxidation in the ladle alone is insufficient. So, it is necessary to kill the bath thanks to the addition of alumi-num inside the furnace. Tests 4, 5, 6, and 7 highlight that this step allows us to reduce number of porosities by 3. Nevertheless, the transfer between the furnace and the ladle causes a reoxidation of the steel. This is why an addi-tional deoxidation has to be done in the ladle. This phe-nomenon is shown by the presence of Al2O3 in the steel in Tests 5, 6, and 7 realized with two aluminum additions. Finally, the amount of Al2O3 in Tests 5, 6, and 7 is more or less equivalent. So, the quantity of Al2O3 is independent of the weight of the aluminum added for the second deoxida-tion. This is why the minimum addition of Al (Test 7) is suf-ficient for the deoxidation in the ladle.
First, Tests 2 and 3 have been realized to show the repeat-ability of the experimental protocol and of the characteri-zation method. The results shown in Table 4 being nearly similar reveals this repeatability. Deoxidation in the furnace in addition to traditional deoxidation in the ladle can really improve the oxygen treatment in steel.
The quantity of MnS Types I and III is at its lowest lev-el with aluminum added in the furnace. MnS Type II is the worst type of inclusion (as previously seen) [8]. The total amount of sulfide is not correlated with the residual amount of sulfur (Tab. 3); however, the amount of sulfur could affect the size and morphology of the inclusions.
In Test 5, the quantity of MnS inclusions is lower. The sulphide nucleation could be related to the amount of alu-minum. So, the hypothesis is that the quantity of those par-ticles could be equivalent to that of Tests 6 and 7, but their size is too small to be detected with the parameters cho-sen in the software. Because of this singularity in Test 5, it would be interesting to analyze the sizes and morphology of the inclusions in more-exhaustive ways (which are possible thanks to the AZTEC software).
4. CONCLUSION
First, this study gives information about steel elaboration and particularly its deoxidation. The whole process of deox-idation used in this study was realized during two different steps in the steelmaking; in the furnace, and in the ladle. Characterizations of the obtained steel using spark spec-trometer and SEM with software image analyses allow us to determine the best process of deoxidation. Spark spec-trometer shows that aluminum is totally consumed in the furnace but completely integrated in the ladle. The oxygen
activity consumes the aluminum in the furnace, but the rest of the oxygen activity is too low in the ladle to consume all of the aluminum. The porosity in steel is also lower with a de-oxidation furnace (as the SEM analyses show). So, complet-ing deoxidation with a furnace aluminum addition increas-es the quality of the steel. The content of 1 kg/ton is still enough in the ladle to complete deoxidation. To complete these results, measurement of the oxygen activity in liquid steel by the adapted equipment would be helpful to confirm the choice of deoxidation.
Then, the analyses of inclusion cleanliness show that the quantity of sulfur in the steel does not affect the quantity of the MnS inclusions. The mechanism of MnS nucleation is more linked to the alumina quantity than sulfur quantity. MnS morphology can evolved with the deoxidation process. A better mastery of AZTEC would allow for a finer analysis concerning the counting and inclusion classification.
Finally, the numerical method of inclusion counting makes it possible to cover a larger surface in less time than the tra-ditional optical method (for the same surface, the numeri-cal method is 4.6 times faster than the optinumeri-cal method). It also makes it possible to obtain all of the chemical compo-sitions of all of the particles. This method also reduces the bias of the observer during the inclusion count. This avoids missing inclusions or counting porosities as inclusions. The software makes it possible to distinguish between the glob-ular and elongated types of MnS inclusions, but this method needs to be further studied in order to draw conclusions about their respective quantities in steel. This software is very efficient and shows possible improvements in alumi-num deoxidation in low-carbon steel.
Acknowledgments
This study was realized with the financial support of SAFE Metal.
REFERENCES
[1] Zhang G.-H. & Chou K.-C. (2015). Deoxidation of molten steel by aluminum. Journal of Iron and Steel Research,
Internation-al, 22(10), 905–908. doi:10.1016/S1006-706X(15)30088-1
[2] Li Y., Wan X. L., Lu W.Y., Shirzadi A.A., Isayev O., Hress O. & Wu K.M. (2016). Effect of Zr-Ti combined deoxidation on the microstructure and mechanical properties of high-strength low-alloy steels. Materials Science and Engineering A, 659, 179–187. doi:10.1016/j.msea.2016.02.035
[3] Golubtsov V.A., Shub L.G., Deryabin A.A. & Usmanov R.G. (2006). Treating steel outside the furnace more efficiently.
Metallurgist, 50(11–12), 634–637. doi:10.1007/s11015-006-
0135-1
Table 4
Inclusions analyses (SEM-FEG)
– Test 2 (ladle) Test 3 (ladle) Test 4 (furnace) and furnace)Test 5 (ladle and furnace)Test 6 (ladle and furnace)Test 7 (ladle
Porosity 2069 2113 790 797 645 670
MnS Type I or III 114 98 150 38 108 113
MnS Type II 55 45 7 18 57 45
MnS total 69 143 157 56 165 158
102 Deoxidation Impact on Non-Metallic Inclusions and Characterization Methods
[4] Li Z., Liu C., Sun Q. & Jiang M. (2015). Effect of deoxidation process on distribution characteristics of inclusions in sil-icon steel slabs. Journal of Iron and Steel Research,
Interna-tional, 22(Supplement 1), 104–110. doi:10.1016/S1006-706X
(15)30147-3
[5] Yarwood J.C., Flemings M.C. & Elliott J.F. (1971). Inclusion formation in the Fe-O-S system. Metallurgical Transactions, 2(9), 2573–2582. doi:10.1007/BF02814897
[6] Zhang L. & Thomas B.G. (2006). State of the art in the control of inclusions during steel ingot casting. Materials and
Metal-lurgical Transactions, 37(5), 733–761.
[7] Ito Y., Masumitsu N. & Matsubara K. (1981). Formation of manganese sulfide in steel. Transactions of the Iron
and Steel Institute of Japan, 21(7), 477–484. doi:10.2355/
isijinternational1966.21.477
[8] Editions Techniques des Industries de la Fonderie. (2007). Méthode micrographique de détermination de la teneur en inclusions non métalliques des aciers moulés. NF EN 10247. [9] Pokorny A. & Pokorny J. (1998). Inclusions non métalliques
dans l’acier. Techniques de l’Ingenieur, 33(M220), 1–43. [10] Hénault E. (2006). Method of automatic characterization of
inclusion population by a SEM-FEG/EDS/Image. JEOL News, 41E(1), 22–24.
[11] Le Coze J. & Saleil J. (2015). La propreté des aciers: une longue conquête scientifique et technologique de la sidé-rurgie. Matériaux et Techniques, 103(5), 1–16. https://doi. org/10.1051/mattech/2015047
[12] ASTM International (2005). ASTM E45-05 Standard Test Methods for Determining the Inclusion Content of Steel, 19. doi:10.1520/E0045-05E03.2
![Fig. 1. Example of sulfur inclusion: a) Type I, ×800; b) Type II, ×500; c) Type III, ×500 [9]](https://thumb-eu.123doks.com/thumbv2/123doknet/7349889.212937/2.892.92.809.889.1131/fig-example-sulfur-inclusion-type-type-type-iii.webp)