HAL Id: tel-01303955
https://pastel.archives-ouvertes.fr/tel-01303955
Submitted on 18 Apr 2016HAL is a multi-disciplinary open access archive for the deposit and dissemination of sci-entific research documents, whether they are pub-lished or not. The documents may come from teaching and research institutions in France or abroad, or from public or private research centers.
L’archive ouverte pluridisciplinaire HAL, est destinée au dépôt et à la diffusion de documents scientifiques de niveau recherche, publiés ou non, émanant des établissements d’enseignement et de recherche français ou étrangers, des laboratoires publics ou privés.
Long-term energy prospective modeling for South
America - Application to international climate
negotiations
Sebastien Postic
To cite this version:
Sebastien Postic. Long-term energy prospective modeling for South America - Application to inter-national climate negotiations. Environmental Engineering. Ecole Nationale Supérieure des Mines de Paris, 2015. English. �NNT : 2015ENMP0048�. �tel-01303955�
N°: 2009 ENAM XXXX
MINES ParisTech
Centre de Mathématiques Appliquées
1 rue Claude Daunesse CS 10 2017, 06904 Sophia Antipolis Cedex, France
T
H
E
S
E
École doctorale n° 84 : Sciences et technologies
de l’information et de la communication
présentée et soutenue publiquement par
Sébastien POSTIC
le 11 décembre 2015
Long-term energy prospective modeling for South America
–
Application to international climate negotiations
Doctorat ParisTech
T H È S E
pour obtenir le grade de docteur préparée dans le cadre d’une cotutelle entre
l’École nationale supérieure des mines de Paris
et La Universidad de Chile
Spécialité “ Contrôle, Optimisation, Prospective ”
Directeur de thèse : Nadia MAÏZI Co-directeur de la thèse : Alejandro JOFRÉ Co-encadrement de la thèse : Sandrine SELOSSE
C
T
H
È
S
E
JuryM. Sébastien VELUT, Professeur, Université Paris 3 Président / Rapporteur
M. Bob van der ZWAAN, Professeur, Energy Research Center of the Netherlands /
Faculty of Science, University of Amsterdam Rapporteur
Mme Nadia MAÏZI, Professeur, Directrice de Recherches CMA / MINES ParisTech Examinateur Mme Sandrine SELOSSE, PhD, Chargée de Recherches CMA / MINES ParisTech Examinateur
M. Alejandro JOFRÉ CÁCERES, Professeur, DIM / Universidad de Chile Examinateur
Remerciements
Je voudrais remercier ici, tout d’abord, MM. Sébastien Velut et Bob van der Zwaan, qui ont accepté la lourde tâche de relire ce travail. Merci pour leur temps et leurs remarques, merci tout spécialement à M. Velut pour m’avoir mis en contact avec les équipes de la CEPAL, permettant peut-être que cette thèse trouve un jour un débouché utile ici au Chili. Merci aussi aux membres de mon jury, en particulier MM. Alejandro Jofré et Héctor Ramírez, qui ont eu le douteux privilège de se lever à 4h30 du matin pour assister à ma soutenance. Au-delà de ce geste très apprécié, merci aussi à M. Jofré d’avoir permis que cette thèse se déroule en partie dans les locaux du CMM à Santiago du Chili, condition indispensable à sa bonne réalisation ; et merci pour m’avoir initié aux subtilités mathématiques de la théorie de l’agence !
Côté français, un très grand merci à Nadia Maïzi pour avoir accueilli cette thèse au CMA, et m’avoir accordé une grande confiance et une grande autonomie. Merci pour les coups de pouce, et merci pour m’avoir permis de garder le cap et la confiance dans les moments de creux… J’aurais eu du mal à me convaincre tout seul de l’utilité de ce que je faisais ! Merci Sandrine, pour tout le temps dédié, pour la patience, pour la joie et la bonne humeur, pour ton accompagnement dans les bons et dans les mauvais moments, malgré la distance, la grossesse, la mairie, la Chaire… Il nous reste à nous remettre pour de bon au ukulélé !
Je me sens chanceux d’avoir pu réaliser ces trois ans dans un environnement aussi privilégié. Merci à tous ceux qui ont pu contribuer à cette excellente ambiance, les doctorants, les élèves de Mastère (merci à ma promo du Mastère OSE avec qui on a quand même passé six mois formidables, et à ceux des suivant-e-s que j’ai eu la chance de croiser)… Merci à Marc, qui n’a pas vu la fin de ce travail et avec qui on ne fera jamais cette sortie en bateau, pour sa joie communicative, et pour les bons moments partagés. Merci à Edi pour nos conversations instructives sur la vie, l’univers et le reste ; merci à Valérie, l’irresponsable des doctorants, qui nous a largement appuyés même si elle vole notre goûter ; merci à Seb Folio et Gilles pour le support informatique, à Evariste pour le Mah-jong, à Amel pour la logistique, et surtout merci à Catherine pour tout… On serait perdu si tu n’étais pas là pour faire la maman, et puis aussi on s’ennuierait ! Mais interdiction de taper les thésards, et de courir en talons… Merci, bien sûr, aux occupants successifs du bureau E209, qui ont fait de chaque jour un plaisir de venir au bureau, partager les discussions philosophico-comptoiro-foireuses, les footings et les sorties ultimates ! Merci Steph, François, Paul, Rémy, Vincent, Thomas… Et merci aux occupants de la Maison du Bonheur, et tant pis si les noms se répètent : Steph, Théo, Camille, Raph, Vincent, Matthieu, Valentine, Paul, Victoire, Fiona, Vadim, Daria, Geoffrey, Clémence. C’est vous qui avez fait que je me suis senti chez moi à chaque retour dans le Sud, et que j’y ai été si heureux ! Merci pour les randos, les soirées jeux, les dîners en terrasse ou à la table du salon, les molkky, les tisanes, les repas de coloc et repas d’anniv, les expérimentations culinaires, merci pour le grain de folie qui a régné sur cette maison et tous ces moments inoubliables, de la soirée Game of Thrones au Mud Day maison en passant par le vrai-faux Gélas, la chasse au sanglier, le terrible chien-moquette du jardin, les batailles de Nerf et l’infaisable rando raquettes… Et à bientôt pour d’autres aventures ! Un grand merci, aussi, à tous les gens qui ont peuplé notre aventure chilienne à Camille et à moi : merci bien sûr à Vincent, pour toutes ces heures passées à me traîner sur les sentiers du Cerro Carbón, les empanadas du midi, et surtout toutes nos discussions… Merci à tous les autres
partageurs de nos sorties du week-end et de nos belotes de la semaine, Myriam, Julien, Boris, Déodat, Florent et Philomène… Un abrazo grande a Ivan y Nato, gracias por las clases de escalada, y gracias por las salidas del finde, aunque nunca lograré terminar Luna Creciente… La culpa del reemplazante de la profe! Merci à ceux qui sont venus nous rendre visite au bout du monde, aussi : merci aux M&M’s Manon et Mounir pour ces deux semaines de rando et la découverte culinaire de l’année, le queque di pasta, merci Anaïs et Alex même si vous êtes mauvais perdants aux cartes, merci à Clément et Solène d’avoir fait tant de kilomètres pour se faire tremper jusqu’aux os à Pucón, merci à Martin, Robin et Antoine d’être venus royer rouler « quelques » kilomètres avec moi sur la Carretera Austral et visiter ces charmantes haciendas isolées (ach !), merci à Mickaël et Célia d’avoir bravé les voleurs de sac de Calama et les containers de nuggets de Valparaiso juste pour nous… Merci Papa et Maman d’être venus vous aussi passer ces moments privilégiés avec nous entre le Cajón de Maipo et les salars d’Atacama, et merci à André et Gabrielle pour cette virée en Patagonie, et pour l’introduction à l’ornithologie !
Enfin, ou presque, merci aux animateurs de la dernière ligne droite : merci à Sandrine et Nadia, pour vos retours tant sur l’architecture de ce manuscrit, que sur les vices cachés dans ses détails. Merci à Etienne et à Paul, mes prédécesseurs docteurs et relecteurs providentiels, sans qui la qualité de ce manuscrit serait loin de ce qu’elle est ; votre soutien a aussi été psychologiquement précieux ! Merci à Anne-Marie Harper pour la relecture de l’anglais, dans un timing plus que serré. Merci à Vincent, Fiona, Sophie, Sandrine, Nadia, Edi pour avoir supporté mes premières répétitions de soutenance, celles qui ne ressemblaient pas à grand-chose… Et un très gros merci à tous ceux dont l’entourage m’a été si précieux dans ces derniers mois un peu compliqués ; si c’est dans le besoin qu’on reconnaît ses vrais amis, j’ai la chance d’avoir de vrais, bons amis. Qu’ils en soient remerciés. Merci à mes témoins de non-mariage, Kroko, Etienne, Bruno, Clément. Merci pour vos heures d’attention, merci pour écouter mes doutes et mes vacillements, et pas seulement mes blagues et mes projets fous. Sachez que vous ne perdez rien pour attendre, il y aura un mariage, et vous en serez ! Un merci tout particulier à toi Vincent, coloc, collègue, ami précieux, pour l’énergie, la bonne humeur, les pauses café, les jeux de mots, les discussions, pour le temps que tu m’as donné. Et bon courage pour finir ton modèle univers avant le prochain siècle ! Merci au Père Hubert, lui aussi accompagnateur de non-mariage, qui a su nous dédier beaucoup plus de temps que prévu, et d’excellents conseils qui peut-être nous sauveront. Merci, de nouveau, à mes parents, à mes frères, pour leur compréhension, leur écoute, parce qu’ils font la vie belle ; merci avant tout d’être là.
Et pour finir, merci Camille. Toi qui m’accompagnes depuis cinq ans maintenant et partages mes joies et mes peines. Mes joies, pendant longtemps, et mes peines de ces derniers temps. Toi que j’admire et qui as illuminé ces années, toi qui payes cette thèse d’un prix trop élevé. Merci pour tous les beaux moments partagés, merci pour tout ce que nous avons construit. Merci pour les journées, les soirs et les matins, les vacances et les week-ends, les discussions, les rires et les projets… Et pardon, aussi. Pardon pour tout ce que j’ai cassé aujourd’hui, pardon pour ces mêmes rires, ces mêmes projets. Merci de tenir le choc pour deux, merci de me retenir, d’être là malgré tout. Je suis perdu aujourd’hui et je ne sais de quoi nos futurs seront faits, mais notre passé est beau, et ta présence aussi.
À mes parents, À Camille, Aux rêves.
9
Contents
Remerciements ... 4
Contents ... 9
Table of Figures ... 14
Table of Tables ... 16
Table of Boxes ... 17
Acronyms ... 17
Introduction ... 26
Document structure ... 29
A
Contributions ... 30
B
Bibliography of the Introduction ... 31
Chapter 1:
South American energy – Historical perspective and current
challenges 33
1500-1825: Rise and fall of colonial empires ... 36
A
1825-1870: The independence aftermath ... 36
B
1870-1930: The golden era ... 37
C
Energy: early ages ... 371930-1980: Shocks and recoveries ... 38
D
Energy: Strategic assets and power struggles ... 391980-2010: Stabilization without cooperation ... 39
E
Energy: regional convergence versus national rivalries ... 40Energy in South America: Specificities and challenges ... 42
F
Sustainability of renewable energy ... 42Transportation issues ... 44
Economic development issues ... 45
Integration issues ... 46
Concluding remarks ... 47
10
Chapter 2:
Overview of South American prospective ... 55
Energy prospective - concepts ... 58
A
A.1. Planning, prediction and prospective ... 58A.2. Scenarios and models ... 59
Latin American energy prospective – A panorama ... 68
B
B.1. 1930-1980: The early ages of planning and prospective in South America ... 68B.2. 1980-1995: The neo-liberal wave ... 73
B.3. 1990-Today: Emergence of dedicated climate-energy prospective ... 76
B.4. Interest of a regional planning tool ... 85
Concluding remarks ... 92
Chapter 2 – Bibliography... 93
Chapter 3:
Construction of a dedicated South American prospective model
105
Organizing South American energy trends ... 107
A
A.1. Brazil: A heavyweight with strong internal disparities ... 107A.2. Other relevant dynamics in Central and South America ... 111
A.3. Subregional disaggregation of T-ALyC: a 10-region approach ... 113
Presentation of the TIMES paradigm and the TIAM platform ... 116
B
B.1. TIMES: general considerations ... 116B.2. TIMES equations and structure ... 118
B.3. Focus on the TIAM experiment ... 121
Model architecture and data ... 125
C
C.1. Demand ... 126C.2. Time in T-ALyC ... 128
C.3. Supply ... 129
C.4. Trade and transport ... 147
Concluding remarks ... 151
Chapter 3 – Bibliography... 152
Chapter 4:
Climate change, climate negotiations and their implications for
South America ... 160
Climate change: From global patterns to South American implications ... 164
A
A.1. Background elements: climate research, the IPCC and its Fifth Assessment Report ... 164A.2. Implication of global climate change for South America ... 167
South America in the global climate negotiations ... 172
B
B.1. An overview of climate mitigation negotiations ... 17211
B.2. South American intended contribution to global climate effort ... 174
Chapter 4 – Bibliography... 184
Chapter 5:
Energy sector contribution to regional climate action – Modeling
and results 192
Mitigation options and adaptation threats for South America’s energy sector ... 195
A
A.1. Hydropower ... 197A.2. Biofuels and biomass ... 199
A.3. Other renewable energies ... 200
A.4. Fossil fuels and carbon storage ... 202
A.5. Demand-side options ... 202
Modeling mitigation ... 204
B
B.1. Pledge scenarios ... 204B.2. Greenhouse gas emissions and storage in T-ALyC ... 206
Results and analysis ... 211
C
C.1. Impact of climate pledges on the energy sector: NAMAs vs. INDCs ... 211C.2. Impact of climate pledges on the electricity sector: the weight of Southeast Brazil ... 214
C.3. Primary energy consumption decarbonizes mainly through electrification ... 217
C.4. Non-energy emissions ... 224
Concluding remarks ... 226
Chapter 5 – Bibliography... 227
General concluding remarks ... 236
Appendix ... 238
Demand in South America: drivers ... 238
A
Trade ... 239
B
Cogeneration : from TIAM to T-ALyC ... 240
C
C.1. TIAM version ... 242C.2. T-ALyC version ... 244
Translations and acronyms for Chapter 2 ... 246
D
Additional results ... 251
E
Extraits de la thèse en Français ... 259
Introduction ... 259
A
A.1. Structure du document ... 26212
Chapitre 1 : L’énergie en Amérique du Sud : perspective historique et défis actuels
B
264
Chapitre 2 : Panorama de la prospective énergétique en Amérique du Sud ... 264
C
Chapitre 3 : Construction d’un modèle spécialisé sud-américain ... 265
D
Chapitre 4 : Changement climatique, négociations climatiques et leurs
E
consequences pour l’Amérique du Sud ... 266
Chapitre 5 : Contribution du secteur énergétique à l’action climatique régionale :
F
modélisation et résultats ... 267
Conclusion générale ... 268
G
14
Table of Figures
Figure 0-1: South American borders and capitals ... 26
Figure 1-1: Renewable electricity share (left) and per capita emissions (right) in Latin America vs. the rest of the world ... 44
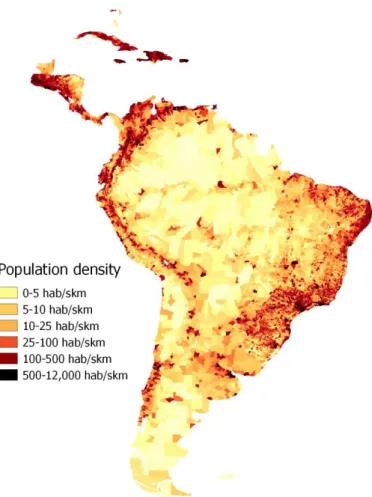
Figure 1-2: Latin America population density, 2000 (adapted from SEDAC, 2004) ... 45
Figure 1-3: Per capita TPES in South America and the world (left) / Electricity production from 1990 to 2012 (right) ... 46
Figure 2-1: Baseline GHG emissions, according to IPCC's AR5 Database (IPCC, 2014) ... 60
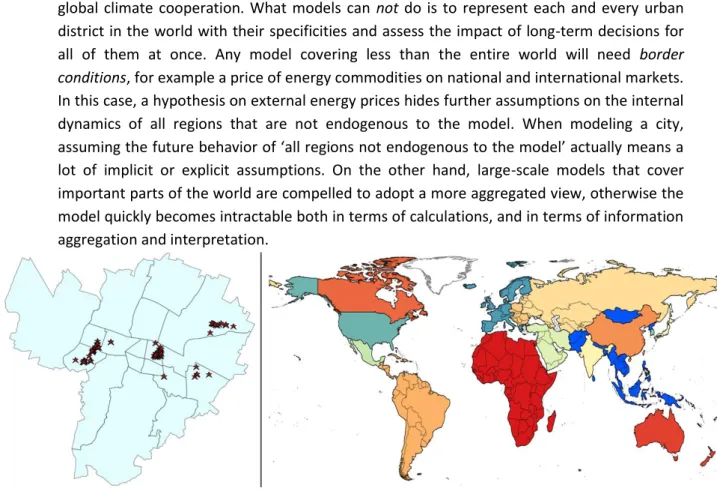
Figure 2-2: An illustration of geographical disaggregation choices. ... 64
Figure 2-3: Top Down, Bottom-up and impact assessment coupling (adapted from Assoumou, 2006) 66 Figure 2-4: South American models – An overview ... 86
Figure 2-5: Models used for European energy prospective (Source: Manna, 2010) ... 87
Figure 3-1: Share of CSA countries in regional GDP and primary energy consumption (BP, 2014; CIA, 2012) ... 107
Figure 3-2: Population density, hydroelectricity generation and electricity transmission in Brazil (ONS, 2014; SEDAC, 2004) ... 109
Figure 3-3: Sugar cane and soybean production in Brazil (Source IBGE, 2013) ... 110
Figure 3-4: The strategic location of Bolivia, Paraguay and Uruguay in South America... 112
Figure 3-5: Regional disaggregation of South America in T-ALyC ... 115
Figure 3-6 : Schematic description of a TIMES-based model ... 117
Figure 3-7: TIAM 15 regions (source: TIAM model) ... 121
Figure 3-8: TIAM RES sketch view (adapted from Loulou and Labriet, 2008) ... 122
Figure 3-9: Final energy demand in T-ALyC in 2010 (left) and 2050 (right) ... 128
Figure 3-10: Time periods in T-ALyC (blue circles: period length – squares: milestone years) ... 128
Figure 3-11: T-ALyC's timeslice tree ... 129
Figure 3-12: South America energy potentials, including (right) or not including (left) oil, solar and biomass potentials ... 130
Figure 3-13: Structure of coal resources and extraction in T-ALyC ... 131
Figure 3-14: Structure for gas resources and gas extraction in T-ALyC ... 132
Figure 3-15: Structure for oil resources and extraction in T-ALyC ... 133
Figure 3-16: Structure for solar resources and extraction in T-ALyC ... 136
Figure 3-17: Investment costs for solar technologies in T-ALyC ... 137
Figure 3-18: Structure for hydro resources and extraction in T-ALyC ... 138
Figure 3-19: T-ALyC hydro costs – comparison with existing literature (adapted from Kumar et al., 2011) ... 139
Figure 3-20: Structure for wind resources in T-ALyC ... 139
Figure 3-21: Investment (left) and O&M (right) costs for wind power generation in T-ALyC ... 140
Figure 3-22: Structure for geothermal resources in T-ALyC ... 141
Figure 3-23: Investment costs (left) and O&M costs (right) for geothermal-based electricity production in T-ALyC ... 142
Figure 3-24: Structure of the nuclear module in T-ALyC ... 142
Figure 3-25: Architecture of the biomass module in T-ALyC... 144
15
Figure 3-27: Electricity and heat generation from biomass – Combined fixed and variable costs ... 146
Figure 3-28: Trade in T-ALyC: concept ... 147
Figure 3-29: Electricity and gas infrastructure in South America as of 2010 ... 148
Figure 3-30: Network efficiency for centralized electricity in T-ALyC ... 150
Figure 4-1: IPCC's RCP and assessed policy scenarios. The CO2-eq concentration refers to 2100 projected values ... 164
Figure 4-2: Change in temperature and precipitation following RCP2.6 and RCP8.5, averaged over CMIP5 models (IPCC, 2014a) ... 165
Figure 4-3: Possible impacts of Climate Change in South America (IPCC, 2014b, p. 1543) ... 168
Figure 4-4: World GHG emissions in 2010, by region, including AFOLU (World Resources Institute, 2015) ... 174
Figure 5-1: Accounting for non-energy GHG sources and sinks in T-ALyC ... 207
Figure 5-2: BAU emissions in 2030 in T-ALyC and in national projections ... 208
Figure 5-3: Chile and Argentina's power mix under BAU conditions ... 209
Figure 5-4: Latin American GHG emissions in 2030 under BAU (left) and Cond_TALyC (right) scenarios ... 211
Figure 5-5: GHG emissions in CSA under BAU, NAMAs and INDC conditions ... 212
Figure 5-6: GHG emissions by region, under BAU, NAMA and INDC conditions ... 213
Figure 5-7: Electricity production in South America, 2010-2050 (Business-As-Usual) ... 214
Figure 5-8: BAU electricity production in South America in 2030 (left) and 2050 (right) ... 215
Figure 5-9: Modification of the power mix relative to BAU in climate scenarios ... 216
Figure 5-10: Modification of the power mix relative to BAU in COND_TALyC (sub-regional detail) ... 217
Figure 5-11: Primary energy production under BAU assumptions ... 218
Figure 5-12: Latin America's fossil fuel trade with the rest of world (BAU) ... 219
Figure 5-13: Change in primary energy consumption in CSA, in the case of low global oil prices ... 220
Figure 5-14: Primary energy consumption in BAU case, 2010-2050 – Net of trade ... 220
Figure 5-15: Fossil fuel consumption in 2010, 2030 and 2050 (BAU) ... 221
Figure 5-16: BAU primary consumption in South America in 2030 (left) and 2050 (right) ... 222
Figure 5-17: Modification of primary energy consumption relative to BAU in climate scenarios ... 223
Figure 5-18: End-use energy consumption according to consumptions sectors, in BAU and Cond_TALyC scenarios ... 224
Figure 5-19: GHG net emissions by sector, under BAU, NAMAs and Cond_TALyC scenarios ... 225
Figure 5-20: GHG capture and storage by sector (NAMAs and Cond_TALyC scenarios) ... 225
Figure 0-1: CHP representation in T-ALyC ... 241
Figure 0-2: End-use consumption according to consumptions sectors, in BAU and Cond_TALyC scenarios (subregion detail)... 255
16
Table of Tables
Table 1-1: An excerpt from South American cooperation agreements (Adapted from Dabène, 2012) 42
Table 2-1: Comparative strengths and weaknesses of bottom-up and top-down approaches ... 62
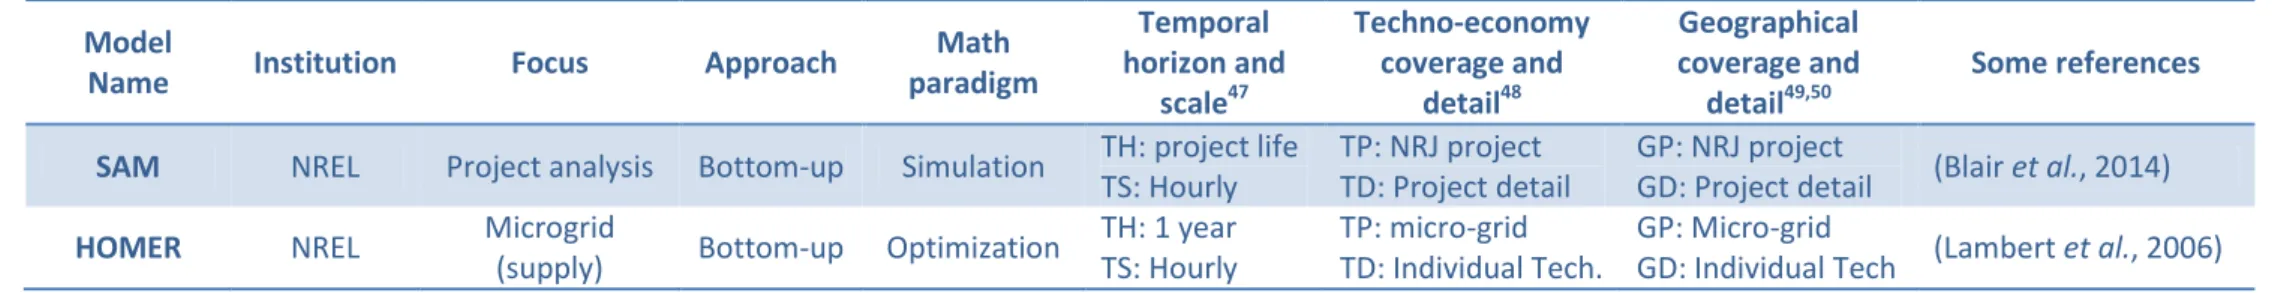
Table 2-2: Review of Latin American energy planning models ... 91
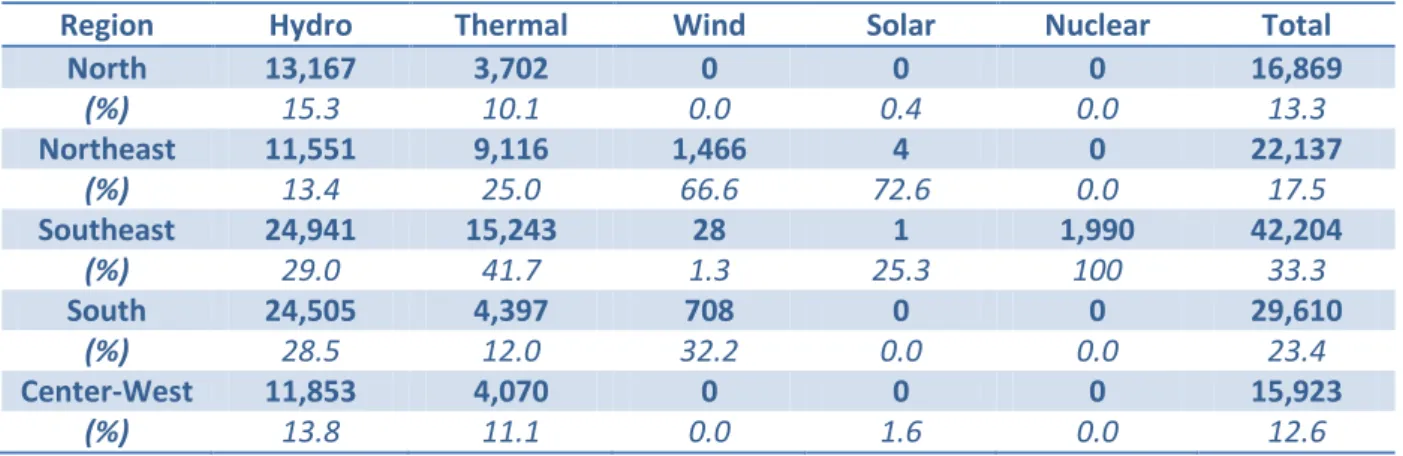
Table 3-1: Brazil - Installed electric capacity by regions in 2013, in MW (EPE, 2014) ... 110
Table 3-2: T-ALyc's regions and description ... 114
Table 3-3: End-use demands of TIAM and their units (From Loulou and Labriet, 2008) ... 124
Table 3-4: T-ALyC: General parameters ... 126
Table 3-5: Coal extraction potential in T-ALyC (EJ) ... 133
Table 3-6: Gas resources in T-ALyC (EJ) ... 134
Table 3-7: Oil resources (extraction potentials) in T-ALyC (EJ) ... 135
Table 3-8: Extraction costs in T-ALyC ($2000 / toe) ... 135
Table 3-9: 2010 costs for gas extraction in T-ALyC ($2000 / MMBTU) ... 135
Table 3-10: 2010 costs for oil extraction in T-ALyC ($2000/boe) ... 135
Table 3-11: Annual exploitable solar income in T-ALyC (EJ/yr) ... 137
Table 3-12: split of hydro potential in T-ALyC ... 138
Table 3-13: Hydropower potentials in T-ALyC (GWe) ... 138
Table 3-14: Wind potential in South America (GWe) ... 140
Table 3-15: Geothermal potential in T-ALyC (PJ/yr) ... 141
Table 3-16: High and low scenarios for nuclear production in 2050 in T-ALyC (PJ/a) ... 143
Table 3-17: Biomass potential in T-ALyC (PJ/yr) ... 145
Table 3-18: Biofuels production from 2015 to 2020 (PJ/yr) ... 146
Table 3-19: Intra-regional distances in T-ALyC (thousand km)... 148
Table 3-20: Investment costs for electricity interconnection projects (thousand $ / MW) ... 149
Table 3-21: Delivery premium for centralized electricity, as a percentage of electricity marginal cost ... 151
Table 3-22: Residual capacity for LNG liquefaction and gasification in 2010 (PJ/yr) ... 151
Table 4-1: Temperature and precipitation compared to 1986-2005 under RCP2.6 and RCP8.5 (Adapted from ECLAC, 2014a) ... 167
Table 4-2: Summary of NAMAs and INDCs submissions by South America to the UNFCCC ... 183
Table 5-1: Scenario assumptions for regional emission targets ... 206
Table 5-2: exogenous emissions in T-ALyC in 2010 (MtCO2eq/yr) ... 207
Table 5-3: Cumulative storage capacity (2010-2050) for T-ALyC carbon storage options (MtCO2) .... 210
Table 5-4: Cost of carbon storage technologies ($2000/tCO2) ... 210
Table 0-1: Selected T-ALyC drivers, from 2015 to 2050, respective to 2010 ... 238
Table 0-2: International energy trade distances in T-ALyC ... 239
17
Table of Boxes
Box 2-1: Hybridization and comparison... 67
Box 2-2: The Chile-Argentina gas crisis ... 80
Box 4-1: Climate scenarios - IS92, SRES and RCP ... 166
Box 4-2: South America's climate ... 171
Box 4-3: UNFCCC and the CBDR concept ... 173
Box 4-4: Greenhouse gases and global warming potential ... 179
Box 5-1: The water cycle ... 198
Acronyms
$2000 US dollar, expressed in 2000 current value AFOLU Agriculture, Forestry and Other Land-Use
ALADI Asociación Latinoamericana de Integración – Latin American Integration Association ALBA Alianza Boliviana para los Pueblos de nuestra América – Boliviarian Alliance for the
People of our America
AMPL A Mathematical Programming Language
AND Andean States
ANP Agência Nacional do Petróleo, Gás Natural e Biocombustíveis – National agency for Oil, Natural Gas and Biofuels
AR5 Fifth Assessment Report of the Intergovernmental Panel on Climate Change
ARG Argentina
ARPEL Asociación Regional de Empresas del Sector Petróleo, Gas y Biocombustibles en Latinoamérica y el Caribe – Regional Association for oil gas and biofuel companies in Latin America and the Caribbean
ATEsT Analysing Transition Planning and Systemic Energy Planning Tools for the implementation of the Energy Technology Information System
BAU Business-As-Usual
BCO Brown Coal
BKB Braunkohlenbriketts – Brown Coal Briquettes
BNDES Banco Nacional de Desenvolvimento – National Development Bank boe Barrel of Oil Equivalent
BPU Bolivia, Paraguay, Uruguay
BSE Brazil – South and East
BTU British Thermal Unit - 1 BTU = 1,055 J
18
CAF Corporación Andina de Fomento – Andean Development Corporation
CAREM Central Argentina de Elementos Modulares – Argentine Plant of Modular Elements CATE Compañia Alemana Transatlantica de Electricidad – German Transatlantic Electricity
Company
CBDR Common But Differentiated Responsibility
CCS Carbon Capture and Storage
CDM Clean Development Mechanism
CEPAL Comisión Económica para América Latina y el Caribe – see UN-ECLAC CEPE Compañia Estatal Petrolera Ecuatoriana – National Oil Company of Ecuador
Ceplan Centro Nacional de Planeamiento Estratégico – National Division for Strategic Planning
CHL Chile
CHP Combined Heat and Power generation
CIER Comisión de Integración Energética Regional – Regional Energy Integration Committee CMIP5 Coupled Model Intercomparison Project 5
CNRS Centre National de Recherche Scientifique – National Center for Scientific Research
COL Colombia
Colciencias Fondo Colombiano de Investigaciones Científicas y Proyectos Especiales – Colombian Fund for Scientific Investigation and Special Projects
COM Commercial
Cond_Nat Conditional INDCs, based on national BAUs Cond_TALyC Conditional INDCs, based on T-ALyC's BAU COP Conference of the Parties (to the UNFCCC)
COPPE Instituto Alberto Luis Coimbra de Pós-Graduação e Pesquisa de Engenharia – Alberto Luis Coimbra's Institute for engineering investigations and post-graduate formation Corfo Corporación Nacional de Fomento – National Development Agency
CSA Central and South America
CSP Concentrated Solar Power
CYC Central America and the Caribbean
DNP Departamento Nacional de Planeación – National Planning Department DSE Dirección Sectorial de Energía – Sectorial Direction for Energy
ECLAC See UN-ECLAC
ECOPETROL Empresa Colombiana de Petróleos S.A. – Colombian Oil Company S.A.
EGR Enhanced Gas Recovery
EJ ExaJoule (1018 Joule)
ELC Electricity
ENAP Empresa Nacional de Petróleos – National Oil Company ENSO El Niño - Southern Oscillation
19
EOR Enhanced Oil Recovery
EPE Empresa de Pesquisa Energética – Energy Investigations Company ESMAP Energy Sector Management Assistance Program of the World Bank ETSAP Energy Technology Systems Analysis Program
EU-27 European Union in its 27-member form (2007-2013) FAO Food and Agriculture Organization
FARC Fuerzas Armadas Revolucionarias de Colombia – Colombia's Revolutionary Armed Forces
FB Fundación Bariloche – The Bariloche Foundation GAMS General Algebraic Modeling System
GDP Gross Domestic Product
GHG Greenhouse Gas
GJ Giga-Joule
GtCO2eq Giga-ton (109) of CO2 equivalent Gtoe Gigatonne of oil equivalent
GW Giga-Watt (109 Watt)
GWP Global Warming Potential
HCO Hard Coal
Hydro Hydropower
IAEA International Atomic Energy Agency
IBGE Instituto Brasileiro de Geografia e Estatística
ICE Instituto Costarricense de Electricidad – Costa Rican Institute for Energy
IEA International Energy Agency
IER Institut für Energiewirtschaft und Rationelle Energieanwendung – Institute for Energy Economics and the Rational Use of Energy
IIASA International Institute for Applied Systems Analysis
IIRSA Iniciativa para la Integración de la Infraestructura Suramericana – Initiative for the Integration of the Regional Infrastructure of South America
IMF International Monetary Fund
IND Industry sector
INDC Intended Nationally Determined Contribution
Inesad Instituto de Estudios Avanzados del Desarrollo – Institute for Advanced Development Studies
INP Instituto Nacional de Planificación – National Planning Institute IPCC Intergovernmental Panel on Climate Change
kW kiloWatt
20 LCOE Levelized Cost Of Electricity
LEAP Long-Range Energy Alternatives Planning
LNG Liquefied Natural Gas
LULUCF Land-Use, Land Use Change and Forestry MAED Module for the Analysis of Energy Demand MAPS Mitigation Action Plans and Scenarios MarkAl Market Allocation model
MERCOSUR Mercado Común del Sur – Southern Common Market
MESSAGE Model for Energy Supply Strategy Alternatives and their General Environmental Impact MHE Ministerio de Hidrocarburos e Energía – Ministry of Hydrocarbons and Energy
MMBTU Million British Thermal Units MME Ministerio de Minas e Energia
MPD Ministerio de Planificación del Desarrollo – Ministry for Development Planning MPPEE Ministerio del Poder Popular de Energía Eléctrica – Ministry of People's Power for
Electric Energy
MSW Municipal Solid Waste
MtCO2eq Million tonnes of CO2 equivalent Mtoe Megaton (106 tonne) of oil equivalent
MW MegaWatt
MWh MegaWatt-hour
NAE Núcleo de Assuntos Estratégicos – Department of Strategic Affairs NAMA Nationally Adapted Mitigation Action
NREL National Renewable Energy Laboratory
NRJ Energy
O&M Operation and Maintenance
Odeplan Oficina de Planificación – Planning Bureau
OECD Organization for the Economic Co-operation and Development
OLADE Organización Latinoamericana de Energía – Latin American Energy Organization OPEC Organization of the Petroleum Exporting Countries
PDVSA Petróleos de Venezuela S.A. – Venezuelan Oil S.A. PEMEX Petróleos de México S.A. – Mexican Petroleum S.A.
PJ Peta-Joule
PND Plano Nacional de Desenvolvimiento – National Development Plan PPA Plano Pluri-Anual – Pluri Anual Plan
PSR Power Systems Research
21
PV Photovoltaic solar panel
RCP Representative Concentration Pathways
REDD Reducing Emissions from Deforestation and forest Degradation in Developing countries
RES Reference Energy System
RNW Renewable energy
RSD Residential
SEI Stockholm Environment Institute SEU Specific Electricity Uses
SRES Special Report on Emissions Scenarios
SUG Suriname, Guyana, French Guyana
T&D Transport and Distribution
T-ALyC TIMES-América Latina y el Caribe – TIMES for South America and the Caribbean tCO2eq Ton of CO2 equivalent
TIAM TIMES Integrated Assessment Model
TIMES The Integrated Markal-EFOM System
toe Ton of Oil Equivalent
TPES Total Primary Energy Supply
TRA Transport
UFRJ Universidade Federal do Rio de Janeiro – Rio de Janeiro’s Federal University
UN United Nations
UNASUR Unión de Naciones Suramericanas – Union of South American Nations
UNDP United Nations Development Program
UN-ECLAC United Nations Economic Commission for Latin America and the Caribbean UNEP United Nations Environment Program
UNFCCC United Nations Framework Convention on Climate Change Uni_Nat Unilateral INDCs, based on national BAUs
UNIDO United Nations Industrial Development Organization
UPME Unidad de Planeación Minero Energético – Mining and Energy Planning Division
US United States (of America)
US$ US Dollar
USAID United States Agency for International Development
USDA US Department of Agriculture
US-EIA US Energy Information Administration USSR Union of Soviet Socialist Republics VEN Venezuela, Trinidad & Tobago
22
VMDE Viceministerio de Desarrollo Energético – Viceministry for Energy Development
WTE Waste-To-Energy
WWI First World War
WWII Second World War
YPF Yacimientos Petrolíferos Fiscales S.A. – National Oilfields, S.A.
25
Que veut-on, et que faut-il vouloir?
26
Introduction
Together, Central and South America and the Caribbean represent more than 450 million people and 18.5 million square kilometers of land area – twice the size of the United States and 12% of the Earth’s total emerged land. The continent’s final energy consumption in 2010 was 460 Mtoe, close to 40% of the final consumption of the EU-27 countries put together, and its greenhouse gas (GHG) emissions accounted for nearly 8% of global emissions in 2011 (World Resources Institute, 2015).
27
The region stands out in the global energy landscape for the outstanding contribution of renewable sources to its energy production: 68% of the continent’s electricity in 2012 was of renewable origin (CIER, 2013), against a world average of 20%; hydropower alone accounted for roughly 64% of South American electricity production. 30% of Brazil’s liquid fuels are bio-sourced; sugarcane alone accounted for 17% of the country’s total primary energy supply (TPES) in 2010. Maintaining this level of renewable energy in the future might prove a challenging task, as ‘historical’ energy sources (hydropower, biomass) run into sustainability issues and ‘new’ options (wind, solar, geothermal energy) still depend on public support schemes (feed-in tariffs, specific auctions, renewable portfolio standards, etc.). However, South America benefits from a small fossil resource endowment and excellent renewable potential for hydropower, biomass, solar, wind and geothermal energy, which make it the ideal candidate for pioneering a renewable energy transition.
Most South American countries are experiencing rapid growth that drives fundamental changes in many economic sectors, including energy. The continent has more than doubled its electricity production in the past 20 years. The electrification rate jumped from 75% in 2009 to around 90% in 2012 in Peru and Bolivia, following average economic growth of more than 4.5% per year from 2004-2012. Chile multiplied its GDP by nearly ten between 1985 and 2008; however, its GHG emissions increased threefold in the same period (O’Ryan et al., 2010), and the country is now facing serious concerns about its mid-term electricity supply due to soaring demand, heavy dependency on imported fossil fuels, and lack of investment in electricity generation during past decades. The energy sector’s contribution in fueling economic growth in a socially and environmentally sustainable way is an issue that is particularly significant in the developing context of the entire continent.
Climate change is also a relevant region-scale concern. The continent’s emissions per capita are above the global average, and the region is also likely to be one of the most impacted by climate change, with a 1.5% to 5% permanent GDP loss by 2050 (ECLAC, 2014a). South America’s highly renewable energy mix is vulnerable to climate change both on the supply side (hydropower and biomass resources) and the demand side (increased demand for e.g. agriculture and air conditioning). Adaptation is of utmost importance, since envisioned mitigation policies can fall short of expectations or put the system under strong pressure, to the point that in some regions the cost of damage is estimated to be less than that of mitigation measures (ECLAC, 2014b).
Despite shared regional strengths and concerns, however, South America appears as a highly heterogeneous and fragmented continent. The region’s physical layout is a first stumbling block for regional integration: the Andes Mountains, the Amazon Rainforest, and desert areas such as Paraguay’s Chaco, Northeast Brazil or Argentina’s Southern Patagonia render most of the inlands inhospitable, driving human settlements to the coast. Two centuries of regional wars make political cooperation at national level difficult today. The region’s historical evolution has also created strong disparities between national energy sectors, from Venezuela’s state-owned monopolies to Chile’s minimalist state interventions in the nation’s economy. Various attempts to cooperate on transnational infrastructure, like Anillo Energético, the Great Southern Gas Pipe and Chile-Argentina gas supply agreements have ended up as costly failures in past years. As of today, more than ten transnational integration initiatives are taking place in the region, with attributions and geographical scopes that intersect more than once.
28
Dealing with South American energy challenges at regional scale is thus both interesting and challenging. Some projects such as MAPS (Mitigation Action Plans and Scenarios) (Winkler et al., 2014) or the Climate Change Economics project (ECLAC, 2014a) look at energy planning from a national perspective, but in a coordinated way. Such projects acknowledge the need for a regional perspective to tackle region-wide issues, yet they do not go so far as a unified representation of the Latin American region. Other authors, such as Acquatella (2008), consider the energy sector of the whole of Latin America, but lack the backing of a dedicated modeling tool. The CLIMACAP-LAMP project (see e.g. van Ruijven et al., 2015) proposes a coordinated evaluation of climate and energy issues for South America, through a multi-model comparison exercise involving models with different paradigms, time spans, geographical scopes, or underlying assumptions. This exercise is highly interesting as it spans the existing range of assumptions and projections for South America, yet it is based on either national or global models, none of which have been specifically designed for regional studies. As a consequence, Latin America as a region remains either partially or coarsely represented1.
The aim of this PhD work, half of which was conducted in France and half in Chile, was to develop a mathematical model adapted to the study of long-term energy issues, at a regional scale, for South America. This model was then applied to studying the impact of national climate policies on regional energy mixes, as the world prepares for a new global climate agreement at the Paris climate conference in December 2015.
1
It is worth noting, however, that global models such as TIAM-ECN have indeed been expanded in the framework of this research project, to improve their ability at tackling regional Latin American issues.
29
Document structure
A
This document is divided in five chapters. The first two chapters present the contextual elements necessary to a prospective modeling of South American energy. The third chapter presents the TIMES-América Latina y el Caribe (T-ALyC) model developed in this work; the last two chapters present a prospective application of this model to the study of regional climate commitments.
Chapter 1 offers a historical overview of South America’s history since colonization, with a focus on the energy sector. It is difficult to understand the specificities of South American energy without these generic background elements; however, I discovered at my own expense that our knowledge of South America, here in Europe, is rather limited. These twenty or so introductory pages thus try to give some insights into half a millennium of history of a full continent. I then turn to the current specificities and challenges of South America’s energy sector.
Chapter 2 presents the base concepts of prospective and scenario modeling, along with a short guide to prospective model classification. Then, building on this introduction and the historical elements presented in chapter 1, we present a historical overview of South American energy prospective, finishing with a state-of-the-art of the institutions, models and recent exercises for energy prospective in South America.
Chapter 3 details T-ALyC’s main features. I present first a disaggregation of South America into ten regions, based on physical, political, economy and social criteria. The generic construction rules of T-ALyC, known as the TIMES paradigm, are then presented, along with the TIAM global model, from which T-ALyC is derived. I finally detail the structure and main assumptions for T-ALyC’s supply and demand, including macroeconomic drivers, resource potentials, and extraction costs.
Chapter 4 presents the climate change issue and its implications for South America. The first half of this chapter is dedicated to presenting the potential impacts of climate change at global scale, and their implications for South America, relying heavily on the extensive literature review conducted by the Intergovernmental Panel on Climate Change (IPCC). The second half of this chapter describes the international climate negotiations, from their beginning in 1972 to the current tentative contributions prepared in view of the Paris conference, with a special focus on South America’s contributions.
Finally, chapter 5 proposes an analysis of the impact of these pledges on South America’s energy sector, and the contribution of the latter to fulfilling these pledges. This analysis is a direct application of the T-ALyC model described in Chapter 3. Given the weight of Agriculture, Forestry and Other Land Use (AFOLU) in South America’s greenhouse gas emissions, a special emphasis is put on describing non-energy emissions and mitigation options in T-ALyC.
30
Contributions
B
Two scientific papers were submitted to peer-reviewed publications:
- TIMES-ALyC: A model for long-term energy prospective in South America – Sébastien Postic, Sandrine Selosse, Nadia Maïzi – Applied Energy
- Energy sector contribution to regional climate action: the case of Latin America – Sébastien Postic, Sandrine Selosse, Nadia Maïzi – Energy Policy
The work described here was presented in various scientific conferences:
- Energy trends in Latin America: a regional disaggregation meeting the requirements of the TIMES prospective approach – Sébastien Postic, Sandrine Selosse, Edi Assoumou, Nadia Maïzi – 4th Meeting of Latin-American Energy Economics – Montevideo – 8-9 April, 2013
- Energy resources and sustainable response to climate constraint in Latin America: A long-term analysis with TIAM-FR – Sandrine Selosse, Sébastien Postic, Nadia Maïzi – 4th Meeting of Latin-American Energy Economists – Montevideo – 8-9 April, 2013
- Combating Climate Change in Latin America: the energy prospect – Sebastien Postic, Sandrine Selosse, Nadia Maïzi – UN Climate Change Conference 2014, COP20|CMP10 – Lima – 3 December, 2014
- Considérations énergétiques regionales pour l’Amérique du Sud – Ressources et engagements climatiques – Sébastien Postic, Sandrine Selosse, Nadia Maïzi – Journée de la Chaire Modélisation Prospective au Service du Développement Durable – Paris – 2 March, 2015 - Energy sector contribution to climate action – The case of Latin America – Sébastien Postic,
Sandrine Selosse, Nadia Maïzi – Semi-annual ETSAP Meeting– Sophia-Antipolis, France – 22 October, 2015
One working paper was produced to synthetize the technical modeling work on T-ALyC:
- TIMES Prospective Modeling for South America, and applications – Sébastien Postic, Sandrine Selosse, Nadia Maïzi – Working Paper n° 2015-01-15 of the Chair Modeling for Sustainable Development – 15 January, 2015
Parallel to the development of T-ALyC, the role of active building control in European energy efficiency policies was investigated using the Pan-European TIMES model, and presented in a scientific conference:
- Long-term assessment of energy efficiency solutions: Application to Active Control in the residential sector – Sébastien Postic, Sandrine Selosse, Edi Assoumou, Vincent Mazauric, Nadia Maïzi – Semi-annual ETSAP meeting – Paris – 18 June, 2013
31
Bibliography of the Introduction
Acquatella, J., 2008. Energía y cambio climático: oportunidades para una política energética integrada en América Latina y el Caribe. CEPAL.
CIER, 2013. Síntesis Informativa energética de los países de la CIER, datos 2012.
ECLAC, 2014a. The economics of climate change in Latin America and the Caribbean: Paradoxes and challenges. ECLAC.
ECLAC, 2014b. La Economía del cambio climático en la Argentina - Primera aproximación.
O’Ryan, R., Díaz, M., Clerc, J., 2010. Consumo de energía y emisiones de efecto invernadero en Chile 2007-2030 y opciones de mitigacion. Universidad de Chile.
van Ruijven, B.J., Daenzer, K., Fisher-Vanden, K., Kober, T., Paltsev, S., Beach, R.H., Calderon, S.L., Calvin, K., Labriet, M., Kitous, A., Lucena, A.F.P., van Vuuren, D.P., 2015. Baseline projections for Latin America: base-year assumptions, key drivers and greenhouse emissions. Energy Econ.
doi:10.1016/j.eneco.2015.02.003
Winkler, H., Delgado, R., Palma-Bahnke, R., Pereira, A., Vásquez Baos, T., Moyo, A., Wills, W., Salazar, A., 2014. Information for a developmental approach to mitigation: Linking sectoral and economy-wide models for Brazil, Chile, Colombia, Peru and South Africa.
World Resources Institute, 2015. CAIT 2.0: WRI’s climate data explorer [WWW Document]. World Resour. Inst. URL http://cait2.wri.org/wri?undefined (accessed 3.17.15).
33
Chapter 1: South American energy –
Historical perspective and current
challenges
América Latina, la región de las venas abiertas.
–Eduardo Galeano35
Chapter 1:
South American energy – Historical perspective and current
challenges 33
1500-1825: Rise and fall of colonial empires ... 36
A
1825-1870: The independence aftermath ... 36
B
1870-1930: The golden era ... 37
C
Energy: early ages ... 37
1930-1980: Shocks and recoveries ... 38
D
Energy: Strategic assets and power struggles ... 39
1980-2010: Stabilization without cooperation ... 39
E
Energy: regional convergence versus national rivalries ... 40
Energy in South America: Specificities and challenges ... 42
F
Sustainability of renewable energy ... 42 Transportation issues ... 44 Economic development issues ... 45 Integration issues ... 46
Concluding remarks ... 47
Chapter 1 – Bibliography... 48
36
South American energy issues cannot be understood without placing them in their historical, social, economic and political context: that of a highly contrasted continent, home to Fidel Castro and Augusto Pinochet, to Salvador Allende and Carlos Menem. From colonization to the Cold War, from commodity lotteries to debt crises, for South America the last half millennium has featured abrupt changes and violent crises, strongly influenced by external dynamics. Despite the common culture imposed by colonists, the continent’s independence wars, post-independence conflicts and successive crises have created a highly fragmented region in which sub-regional relationships remain precarious. South American energy today bears both the common features and strong divergences of this tormented regional history. This preamble chapter presents a portrait of these past evolutions, as well as the present and future challenges awaiting South America’s energy sector. Although limited, this background is fundamental to understanding the main determinants of South America’s energy sector, as a prelude to any investigation about the sector’s future.
1500-1825: Rise and fall of colonial empires
A
In 1492, Christopher Colombus set sail from Palos de la Frontera with the mission to discover the western sea route to the East Indies. After a 2-month trip, he set foot on what would come to be known as the Bahamas, thus starting the first lasting contact between Europe and America.
This contact did not really benefit South America’s natives; the region, home to ancient civilizations, was conquered through violent wars in which most of its population was killed or died from European illnesses. The last Inca stronghold was conquered in 1572, extending the Viceroyalty of Peru to its maximum scope. The conquest of Mexico ended in 1697; the Viceroyalty of New Granada was definitively established in 1739 in what would become Colombia, Ecuador, Panama and part of Venezuela. In 1775, the State of Brazil was born from the union of the three colonies of Portuguese America. When the Viceroyalty of Río de la Plata was established in 1776 in what is now Argentina, Portugal and Spain had conquered a 20 million km² territory, killing roughly 40 million of indigenous American –80% of the native Latin Americans– in the process.
Following the French Revolution and the United States of America’s independence, Latin American colonies profited from the Napoleonic wars that undermined their colons’ influence, and claimed their independence. Military leaders such as Bolívar, San Martin, Sucre and O’Higgins fought violent independence wars to decolonize Argentina, Bolivia, Chile, Colombia, Peru and Venezuela. The Prince Regent Dom Pedro declared Brazil’s independence in September 1822, becoming Pedro I, Constitutional Emperor of Brazil. By September 1823, the last Portuguese garrison had surrendered and Brazil’s independence was formally recognized by Portugal in 1825, making the whole of South America independent.
1825-1870: The independence aftermath
B
The initial dream of Bolívar and San Martin to found a United States of South America was quickly lost, as regional rivalries drove South American countries ever further apart. In spite of a very strong common administrative and cultural base and a shared language, the continent soon headed towards political fragmentation under the rule of the former colonial elite. Its pathway towards national states’ emergence was marked by devastating wars whose lasting consequences are still embedded
37
in regional relationships today. The Triple Alliance War (1864-1870), opposing Paraguay to Brazil, Argentina and Uruguay, killed over 70% of Paraguay’s male population; in the War of the Pacific (1879-1883), lost to Chile by Bolivia and Peru, Peru ceded 66,000 km² to Chile, including 400 km of littoral and saltpeter-rich territories, while Bolivia lost its Littoral Department, becoming a land-locked country in a treaty which is still challenged today. Brazil and Argentina engaged in the Cisplatine war during the first year of Brazil’s independence, giving birth to Uruguay as an independent state in 1828. The consolidation of post-colonial institutions also took significant time and effort: towards the mid-19th century, only 2% of Latin Americans had voting rights2, while Brazil, the last South American country to abolish slavery, outlawed it in 18883. Together with internal and international struggles and the effort of consolidating post-colonial institutions, Latin American development was hindered by strong geographical barriers to physical integration; the region thus experienced decades of weak growth in the early 19th century (Halperín Donghi, 1969).
1870-1930: The golden era
C
From 1870 on, South America’s dynamics evolved strongly in what has been called the ‘first globalization’. Thanks to steam navigation and rail transportation, the region’s sluggish economic development picked up speed, sustained by exports of mining products (silver, gold, tin, copper, nitrates, oil) and agricultural goods (corn, meat, fruit, sugar, coffee, cocoa beans, quinine, rubber, cotton), and sustained immigration from Europe and Asia. Argentina, for a while, became one of the wealthiest countries on Earth, with a per capita GDP reaching 70% of that of the US and salaries at the same level as French or German ones. However, apart from the Argentine4 exception, this regional economic boom mainly benefitted a small and wealthy elite. Power and influence had shifted from colonial metropolises to local former colonial elites, land owners and foreign capital, in what has been called the ‘new colonial pact’, or the ‘second conquest of Latin America’ (Topik and Wells, 2010). While at first Great Britain headed this second conquest, the USA made themselves ever more present, becoming the first foreign power after WWI. Wealth was localized in space and time, based on primary commodities with little added value and heavy dependence on international prices. Such commodity dependence brought quick expansions and equally quick collapses in what came to be known as the ‘commodity lottery’ period (Diaz-Alejandro, 1982), while labor conditions under the rule of foreign investors often came close to slavery5.
Energy: early ages
After having kept a low profile during colonial times, energy emerged as a strategic issue in post-1870 South America. Oil was discovered first in Mexico (1868), then in Argentina (1907), Ecuador (1911), Bolivia (1913), Venezuela (1914), opening an era of quick industrialization: Argentina’s national oil company YPF (Yacimientos Petrolíferos Fiscales, National Oil Fields) was created in 1922, Ecuador published its first hydrocarbon law in 1921, and by 1928 Venezuela had become the world’s first oil exporter and second-largest producer behind the US (arguably, third-largest behind Russia)6. Oil,
2
(Dye, 2006; quoted by Bértola and Ocampo, 2010).
3 Through the so-called Golden Law, or Ley Áurea (Galloway, 1971). 4
And the Uruguayan one, as Uruguay’s fate remained close to its former sister colony for a while.
5
cf. the famous book by Literature Nobel Gabriel García Márquez (1967) on the rise and fall of the banana business in Colombia, or the very good portrait by Rivera Letelier (2002) of the repression of the Chilean saltpeter miners’ strike in 1907.
6
38
together with copper and tin, jumped from 4% of South American exports in 1913 to 14% in 19297. Oil interests in Mexico in 1914 were already leading the US and Great Britain to meddle with the country’s politics, bringing down Madero’s government and Huerta’s subsequent dictatorship (Meyer, 1988). Electricity was the new wonder of the moment: in 1883, Dom Pedro II, second Emperor of Brazil, inaugurated the first public electric lighting system in South America in the state of Rio de Janeiro. In Argentina, La Plata was the first city to get public lighting installed, and also saw the first electricity plant in the country, in 1886. The first Argentine hydroelectric plant, with a capacity of 1,000 kW, was built in 1891 near the city of Córdoba. In 1908, a six-generator hydropower plant was inaugurated in Brazil’s Rio de Janeiro state, totaling a capacity of 24,000 kW; in 1910, the CATE electricity company inaugurated the Dock Sud Coal Plant in Buenos Aires, one of the most powerful in the world with 36,000 kW installed capacity. In 1930, 40 years after the first plant was installed, São Paulo state in Brazil counted 166 power plants alone, totaling more than 330 MW installed capacity (Ghía, 2012; Hesla, 2011; Paulo Pombeiro Gomes and Vieira, 2009). Electricity was initially used for public lighting, telegraphs, tramways and specific productive uses such as textile mills. Coal consumption grew steadily with the development of electricity and rail transportation; Argentina and Mexico displaced Cuba as the third coal consumer on the continent, behind Chile and Brazil (Yáñez et al., 2013). Coal exports, on the other hand, remained very low, as Colombia (today’s main coal exporter) had not yet discovered its national reserves.
1930-1980: Shocks and recoveries
D
In 1929, this economic boom came to an abrupt end. The 1929 economic crisis, which brought the world’s economy to its knees, marked the start of a troubled period for the world in general and Latin America in particular. The region was little involved in WWII; however its export-based, debt-fueled economy had been heavily dependent on outside lenders and buyers since the first commodity lottery episodes, prone to sharp economic booms and crises. In the two decades following 1929, it was severely impacted by the drop in export incomes and war-owed import shortages. Foreign capital flows dwindled, Western economies set up protectionist measures, the US stopped buying, and the weight of debt service grew unbearable. The paradigmatic change from commodity-based export economy to state-controlled industrialization by import substitution took place on a continent where political, economic and social instability became the rule. Between 1930 and 1980, Argentina saw 9 successful coups and 15 military governments. Brazil ‘only’ experienced 2 coups, yet 30 years of civilian and military dictatorship did not prevent the country from undergoing deep restructuration and rampant inflation (Baer, 2008). Uruguay, Bolivia, Paraguay, Chile and Peru were also subject to military coups and dictatorships. The La Violencia civil war in Colombia between 1946 and 1953 resulted in 200,000 to 300,000 casualties, displaced 2 million people and made armed violence a feature of the country’s political background for decades. The Cuban Revolution and the subsequent rise of Fidel Castro are a textbook case of Cold War history. On the other hand, the post-WWII period was the most prosperous so far for Latin America, whose production system remained intact after WWII. The continent benefited strongly from the Bretton Woods agreements and the second wave of globalization, registering its highest growth rates ever for both growth and productivity between 1945 and 1980. This growth was, however, quite unequal: while Brazil and Mexico over-performed, the more advanced economies of Argentina, Chile and Uruguay, which had fared well from 1870 to
7
39
1930, experienced severe regressions. Argentina’s per capita GDP plummeted from 70% to 45% relative to the US (Bértola and Ocampo, 2010).
Energy: Strategic assets and power struggles
Regional wars for the control of mining resources added to the general instability. In 1932, Colombia and Peru clashed over the control of rubber-rich Amazonian territories. In the same year, Bolivia and Paraguay started the most destructive South American war in the 20th century, the Chaco War, which caused 90,000 deaths in 3 years and ended with Bolivia abandoning its territorial claims on three quarters of the Chaco desert – a zone nearly as big as France. Key to the war decision was the assumption that the Chaco’s underground was filled with oil (Seiferheld, 1983); and peace was agreed when the Paraguayan army’s progression began to threaten the oil-rich Santa Cruz region (Guachalla, 1978). Energy had invited itself into the foreground of political preoccupations in South America. In 1936, as a direct consequence of the war, Bolivia nationalized the Standard Oil’s branch in the country and created its own national company, YPFB (Yacimientos Petroleros Fiscales de Bolivia, National Oil Fields of Bolivia) (Molina, 2011). In 1938, following in Bolivia’s footsteps, Mexico expropriated all foreign oil companies operating in the country and created its own national company, PEMEX (Meyer, 1988). Energy gained consideration under the rule of military dictatorships, which came to consider it explicitly as a ‘strategic sector’. This triggered the creation of state-controlled companies such as ECOPETROL in Colombia (1951), ENAP in Chile (1951), PetroBras in Brazil (1953), PetroPerú in Peru (1968) or the CEPE in Ecuador (1971). Venezuela, still the second producer in the world in 1940, prompted the creation of OPEC in 1960 together with Saudi Arabia. In 1975, in the wake of the first oil crisis, the country nationalized its oil sector and created the national oil company PDVSA, while Brazil launched its emblematic bioethanol program Proalcool (Moreira and Goldemberg, 1999). The power sector also went through a wave of nationalizations. Beyond the strategic aspects of electricity supply, nationalizing was seen as a necessary step to finance large, capital-intensive hydropower works. Argentina started nationalizing its power sector in 1945 and the state company Agua y Energía bought out the last private concession in 1979 (Ghía, 2012). The Argentine El Chocón-Cerros Colorados complex, totaling nearly 2 GW of installed capacity, was inaugurated in 1973. Brazil connected the giant Paulo Alfonso complex (4.1 GW on the São Francisco river) to its national network in 1955 (Moretto et al., 2012). In 1961, after 10 years of political struggle, it nationalized its power sector, giving birth to the national giant Eletrobras. Brazil, Argentina and Mexico started nuclear programs in the 1950s, which culminated with the inauguration of the Atucha I nuclear plant in Argentina in 1974. The works started in 1971 for Brazil’s Angra I plant and in 1976 for Mexico’s Laguna Verde plant. The key bi-national collaborations for the giant dams of Yacyretá (Argentina-Paraguay) and Itaipu (Brazil-Paraguay) were launched in 1973.
1980-2010: Stabilization without cooperation
E
The 1970s may have been South America’s best decade from an economic viewpoint; yet, the 1980s was most probably the worst, confirming the cyclic nature of the region’s economy. In 1979, the US Federal Reserve increased its interest rates, while primary commodity prices started plummeting, losing up to 40% of their historic value during two decades. South America’s economy still depended heavily on exports and had been the focal point of more than half of the private debt that had been flowing towards the developing world since 1973 (Ocampo et al., 2003); the shock was tremendous, prompting what has been labeled the ‘debt crisis’, or ‘lost decade’ (United Nations, 1996). Argentina, Venezuela and Mexico experienced massive capital flights; inflation peaked at 2,477% in Brazil (Baer,