R i | UNJVERSITEDE
Ml SHERBROOKE
Faculte de genieDepartement de genie civil
BEHAVIOR OF SYNTHETIC FIBER-REINFORCED CONCRETE
CIRCULAR COLUMNS UNDER CYCLIC FLEXURE AND CONSTANT
AXIAL LOAD
COMPORTEMENT DES POTEAUX CIRCULAIRES EN BETON RENFORCE AVEC FIBRES SYNTHETIQUES SOUMIS A CHARGE AXIALE CONSTANTE ET FLEXION
CYCLIQUE
Memoire de maitrise en sciences appliquees Specialite: genie civil
Composition du jury: Patrick Paultre Jean Proulx Kenneth Elwood Nathalie Roy
Laura Isabel OSORIO GOMEZ
1*1
Library and
Archives Canada
Published Heritage
Branch
395 Wellington Street Ottawa ON K1A0N4 CanadaBibliotheque et
Archives Canada
Direction du
Patrimoine de I'edition
395, rue Wellington Ottawa ON K1A0N4 CanadaYour file Votre reference ISBN: 978-0-494-42999-0 Our file Notre reference ISBN: 978-0-494-42999-0
NOTICE:
The author has granted a
non-exclusive license allowing Library
and Archives Canada to reproduce,
publish, archive, preserve, conserve,
communicate to the public by
telecommunication or on the Internet,
loan, distribute and sell theses
worldwide, for commercial or
non-commercial purposes, in microform,
paper, electronic and/or any other
formats.
AVIS:
L'auteur a accorde une licence non exclusive
permettant a la Bibliotheque et Archives
Canada de reproduire, publier, archiver,
sauvegarder, conserver, transmettre au public
par telecommunication ou par Plntemet, prefer,
distribuer et vendre des theses partout dans
le monde, a des fins commerciales ou autres,
sur support microforme, papier, electronique
et/ou autres formats.
The author retains copyright
ownership and moral rights in
this thesis. Neither the thesis
nor substantial extracts from it
may be printed or otherwise
reproduced without the author's
permission.
L'auteur conserve la propriete du droit d'auteur
et des droits moraux qui protege cette these.
Ni la these ni des extraits substantiels de
celle-ci ne doivent etre imprimes ou autrement
reproduits sans son autorisation.
In compliance with the Canadian
Privacy Act some supporting
forms may have been removed
from this thesis.
Conformement a la loi canadienne
sur la protection de la vie privee,
quelques formulaires secondaires
ont ete enleves de cette these.
While these forms may be included
in the document page count,
their removal does not represent
any loss of content from the
thesis.
Canada
Bien que ces formulaires
aient inclus dans la pagination,
il n'y aura aucun contenu manquant.
Resume
La ductilite et la capacite a dissiper de Fenergie sont deux qualites tres importantes pour les elements structuraux des structures situees dans les regions sismiques comme Test du Canada. Soulignons que Montreal occupe la deuxieme place en ce qui a trait au risque sis-mique au Canada. De plus, la reduction des couts de maintenance des infrastructures est un sujet d'interet pour les proprietaries alors que ces derniers doivent en tout temps garantir la securite des usagers. Or, le beton renforce avec des fibres synthetiques semble etre un materiau qui remplit ces caracteristiques. Pourtant, son utilisation est actuellement lim-itee aux elements non structuraux ou structuraux mais non principaux. Afin de generaliser 1'utilisation du beton fibre dans le domaine structural, il faut continuer a produire et a analyser des donnees experimentales qui permettront de valider et d'ameliorer les prescrip-tions de design et les modeles analytiques actuels pour la conception des elements en beton arme avec des fibres dans les zones sismiques. Dans ce contexte, six poteaux circulaires a grande-echelle ont ete testes sous une charge axiale constante (25% de Agf'c) et en flexion
cyclique. Trois poteaux ont ete confectionnes en beton normal (BN) et les trois autres en beton renforce avec des fibres synthetiques (BRFS). La resistance a la compression du beton specifiee a 28 jours pour les specimens etait de 30 MPa. Le volume de fibres synthetiques en polypropylene-polyethylene utilise a ete de 1%. Les trois poteaux en BN etaient renfor-ces par une armature transversale constitute d'une spirale ayant un pas de 42, 75 et 100 mm respectivement. Ces trois specimens ont ete compares avec des specimens similaires en BRFS. Les resultats montrent que la presence des fibres synthetiques dans la matrice de beton ameliore le comportement ductile et la capacite a dissiper de l'energie des specimens. II a ete observe que cette amelioration n'est pas directement proportionnelle a la quantite d'armature transversale. Toutefois, 1'utilisation du beton fibre semble rendre possible une reduction de l'armature transversale tout en conservant un aussi bon sinon un meilleur com-portement.
Mots cles: comportement sismique, poteaux circulaires, beton avec des fibres, fibres synthe-tiques, ductilite, dissipation d'energie
Abstract
Ductility and energy dissipation are two important properties of columns when being part of a structure placed in moderate/high seismic regions like the East of Canada, being Mon-treal the second place in seismic risk in the country. These properties are directly related to the seismic performance of a structure. The reduction in cost of maintenance is also an important issue for the buildings owners, who have the obligation to warrant the security of the occupants and users of the infrastructures. The synthetic fiber reinforced concrete (SNFRC) seems to be a good material that fill up these characteristics, but its utilisation is actually restrained to non structural elements or structural but non principal elements. Therefore, to extend its application to the structural field, data must be collected for the development of models and seismic design requirements of columns made from SNFRC. Six large-scale circular columns were tested under constant axial load (25% de Agf'c) and cyclic
flexure to study their seismic performance. Three columns were made from normal reinforced concrete (NRC) and the three others from SNFRC having all of them a concrete strength of 30 MPa. The volumetric ratio of synthetic fibers in polypropylene-polyethylene was 1%. Three specimens of NRC having a spiral pitch of 100, 75 and 42 mm were compared with three similar columns made from SNFRC. The results show that the presence of fibers into the concrete matrix helps to improve the ductile behavior and energy dissipation capacity of the columns. This improvement, however, was found not to be proportional to the amount of confinement steel. Reduction in the confinement steel seems to be possible when SNFRC is used, and even a better behavior was obtained.
Keywords: seismic behavior, circular columns, normal-strength concrete, fiber-reinforced concrete (FRC), synthetic fiber-reinforced concrete (SNFRC), ductility, energy dissipation
Remerciements
Cette recherche a ete faite sous la direction du professeur Patrick Paultre et la co-direction du professeur Jean Proulx. Je tiens a les remercier de m'avoir offert l'opportunite d'etudier a l'Universite de Sherbrooke, et surtout de leur support et de leurs commentaires qui m'ont permis d'avancer tout au long de ma maitrise.
Je voudrais aussi remercier Rami Eid pour la supervision technique de ma recherche, ainsi que la revision et la correction de ce memoire. A Nathalie Roy, mon amie, je la remercie pour son assistance technique durant les essais mais aussi pour toute la gestion administrative qui a fait avancer ce projet.
Je dois une grande reconnaissance a Jeason Desmarais, technicien du CRGP, pour sa pa-tience, sa collaboration et le travail bien fait lors de la construction de tous mes specimens. Aussi, je suis tres reconnaissante de l'aide que Claude Aube et Laurent Thibodeau m'ont donnee. Je dois dire que ca m'a fait plaisir de travailler avec les techniciens et les stagiaires Cedric Poirier et Jeremie Sturtevant du CRGP. Egalement, je remercie Ghyslaine Luc du groupe de beton pour sa collaboration a la reserve des equipement.
Ce projet n'a ete possible qu'avec la collaboration de Jean-Francois Trottier, qui a fourni la fibre synthetique developpee a l'Universite de Dalhousie. Aussi, je voudrais exprimer ma gratitude a EUCLID pour la donation du superplastifiant et a DEMIX pour la disposition de leurs installations lors de la fabrication du beton avec des fibres.
Finalement, je remercie Luis Ignacio Cardona, mon amour, pour etre toujours avec moi et pour m'avoir accompagnee dans tout cette aventure.
Doubting of the acquaintance requires perhaps more audacity that exploring the unknown.
Contents
1 Introduction 1 1.1 Parameters who influence the FRC behavior 2
1.2 Previous studies 4 1.2.1 High-strength concrete 4
1.2.2 Normal-strength concrete 6
1.3 Research significance 7 1.4 Objectives and Methodology 7
2 Experimental Program 9 2.1 Test variables 9
2.1.1 Fiber volumetric ratio 9 2.1.2 Spacing for transversal reinforcement 10
2.1.2.1 CSAA23.3-04 11 2.1.2.2 New Zealand Standard 3101:1995 13
2.1.2.3 ACI Code 318M-05 14 2.2 Test specimens 16 2.3 Materials properties 18 2.3.1 Concrete 18 2.3.1.1 Normal concrete 19 2.3.1.2 Fiber-reinforced concrete 21 2.3.1.3 Concrete curing 24 2.3.2 Steel reinforcement 25 2.3.3 Synthetic Fibers 26 2.4 Instrumentation 28 2.5 Test setup 31 2.6 Test procedure 32 3 Test Results 35
3.1 General behavior and test observations 35
3.2 Force-displacement relationship 37 3.3 Moment-curvature relationship 43 3.4 Ductility parameters and energy dissipation 47
3.5 Tension demand on longitudinal steel bars 51 3.6 Tension demand in transverse steel (or spiral) 55
3.7 Damage zone and plastic hinge length 58
4 Discussion of Test Results 62
5 Conclusions and Recommandations 67
List of Figures
1.1 Causes of early cover spalling in HSC columns (adapted from Collins et al. [15]) 4
1.2 Early rupture mechanism caused by cover buckling 5 2.1 Interaction diagram for a circular section calculated with WMNPhi 10
2.2 Dimensions and reinforcing steel of the specimens: (a) front view of columns
; (b) section A-A; (c) plan view of the stub 16
2.3 Aspect of reinforcing cage 17 2.4 Column formwork ready before casting 18
2.5 Stress-strain relationship for normal concrete at 28 days 20 2.6 Fiber-reinforced concrete mixing procedure at DEMIX 22 2.7 Stress-strain relationship for fiber-reinforced concrete at 28 days 24
2.8 Curing method by wet coverings 25 2.9 Stress-strain relationship for longitudinal steel 26
2.10 Stress-strain relationship for transversal steel 27
2.11 Aspect of synthetic fibers 27 2.12 Strain gages positions on longitudinal steel bars and spirals 29
2.13 Potentiometers and LVDTs positions 30 2.14 Rods placement and general view of the instrumentation 31
2.15 Experimental setup 32 2.16 Lateral displacement history 34
3.1 Idealization of the specimen 38 3.2 Lateral load versus tip displacement for C30S100FP0 40
3.3 Lateral load versus tip displacement for C30S100FP1 41 3.4 Lateral load versus tip displacement for C30S75FP0 41 3.5 Lateral load versus tip displacement for C30S75FP1 42 3.6 Lateral load versus tip displacement for C30S42FP0 42 3.7 Lateral load versus tip displacement for C30S42FP1 43
3.8 Moment versus curvature for C30S100FP0 44 3.9 Moment versus curvature for C30S100FP1 45 3.10 Moment versus curvature for C30S75FP0 45 3.11 Moment versus curvature for C30S75FP1 46 3.12 Moment versus curvature for C30S42FP0 46
3.13 Moment versus curvature for C30S42FP1 47 3.14 Envelope curve calculation and energy dissipation 48
3.15 Bilinear response idealization 48 3.16 Strain progression on longitudinal bars in tension for C30S100FP0 52
3.17 Strain progression on longitudinal bars in tension for C30S100FP1 52 3.18 Strain progression on longitudinal bars in tension for C30S75FP0 53 3.19 Strain progression on longitudinal bars in tension for C30S75FP1 53 3.20 Strain progression on longitudinal bars in tension for C30S42FP0 54 3.21 Strain progression on longitudinal bars in tension for C30S42FP1 54
3.22 Tension demand of the spiral in C30S100FP0 55 3.23 Tension demand of the spiral in C30S100FP1 56 3.24 Tension demand of the spiral in C30S75FP0 56 3.25 Tension demand of the spiral in C30S75FP1 57 3.26 Tension demand of the spiral in C30S42FP0 57 3.27 Tension demand of the spiral in C30S42FP1 58 3.28 Diagrams of most damaged regions for each specimen 60
3.29 Photographs of damaged and plastic hinge regions for all specimen 61 4.1 Normalized moment-curvature for C30S100FPO and C30S100FP1 62 4.2 Normalized moment-curvature for C30S75FP0 and C30S75FP1 63 4.3 Normalized moment-curvature for C30S42FP0 and C30S42FP1 63 4.4 Normalized moment-curvature for C30S75FP0 and C30S100FP1 64 4.5 Normalized moment-curvature for C30S42FP0 and C30S75FP1 65
List of Tables
2.1 Spacing of transverse reinforcement en mm 15 2.2 Real dimensions and amount of reinforcing steel 17 2.3 Mixture composition for normal concrete at f'c = 30 MPa (kg/m3) 19
2.4 Properties of fresh normal concrete 20 2.5 Mechanical properties of normal concrete 21 2.6 Modulus of rupture for normal concrete 21 2.7 Mixture composition for synthetic fiber-reinforced concrete at f'c = 30 MPa
(kg/m3) 23
2.8 Properties of fresh fiber-reinforced concrete 23 2.9 Properties of fiber-reinforced concrete measured from compression test . . . 23
2.10 Modulus of rupture for fiber-reinforced concrete 24
2.11 Reinforcing steel properties 26 2.12 Physical and mechanical properties of synthetic fibers 28
2.13 Exact strain gage positions on the spirals t 29 2.14 Distance for the metallic rings and steel rodsj 30
2.15 Applied axial load 33 3.1 Experimental yielding displacement 36
3.2 Curvature measure height 43 3.3 Bilinear curve points for H' — A and M — ip relationships 49
3.4 Ductility and Energetic Indexes 51
3.5 Plastic hinge length 59 4.1 Confinement indexes 66
Liste of symbols
Ac area enclosed by outside perimeter of concrete cross-section
Ach cross-sectional area measured out-to-out of the spiral (ACI 318M-05)
Ag gross area of the section
Ast area of longitudinal reinforcement
c dimension laterale du noyau de beton parallele a une direction principale
D section diameter of the column
db bar diameter of the steel reinforcement
Dc core diameter measured out-to-out of the spiral
DEW damage index
d" diameter of concrete core of circular column measured
to outside of the spiral
Ec modulus of elasticity of concrete
Ei energy dissipated in one cycle Es modulus of elasticity of the steel
Ehyst total dissipated energy EN normalized dissipated energy
f'c specified compressive strength of concrete
/c28 specified compressive strength of concrete at 28 days
f'ctest compressive strength of concrete the day of the test
fr modulus of rupture of concrete
fie effective confinement pressure
fsu ultimate stress of steel
fy yield strength of the steel
fyh specified yield strength of transverse reinforcement
fyt yield strength of the spiral (NZS and ACI)
H lateral load applied to the column
H' lateral load applied to the column including the P-Delta correction
H'max maximum lateral load applied to the column including the P-Delta correction
and defined as in section 3.4
hx lateral dimension of the concrete core measured to center-to-center
Ie effective confinement index
Ik confinement index Iw work index
Ki stiffness in the ith. cycle corresponding to the maximum displacement kp relation between factored axial load and the nominal axial resistance
at zero eccentricity
Kyi stiffness corresponding to the idealized yield displacement
I distance from the top of the base to the application point
of the lateral load
I' distance from the top of the stub to the tip of the column lp plastic hinge length
m coefficient equals to fy/(Q.85Agfc) (NZS)
Mmax maximum moment
N* design axial load at ultimate limit state (NZS) Pf factored axial load
P0 nominal axial resistance of the column at zero eccentricity
q distance from the top of the base and the pin joints of the actuators Rd ductility-related force modification factor
s spacing center-to-center of transverse reinforcement s' free distance between two levels of the spiral
Sx spacing of the transverse reinforcement defined in Clause 21.4.4.3
of the CSA A23.3-04
S0 spacing of the transverse reinforcement defined in Clause 21.4.4.2
of the ACI318M-05
y distance from the pin joints of the actuators to the application point
of the lateral load
y1 distance from the pin joints of the actuators to the tip of the column
5U interstory drift ratio
A horizontal tip displacement of a cantilever column measured at the load application point
A* maximum horizontal displacement at the ith cycle the load application point
A ' horizontal tip displacement of a cantilever column
Ay e x p experimental yielding displacement
Ayi idealized yielding displacement
A2 idealized ultimate displacement
e'c axial strain in plain concrete corresponding to f'c
£c5ou axial strain in plain concrete corresponding to 0.5/^ after the peak
ey yield strain in the steel
esh strain corresponding to the beginning of steel hardening
esu ultimate strain corresponding to ultimate stress fsu of the steel
fi^i sectional ductility pf fiber volumetric ratio
ps volumetric ratio of spiral reinforcement
pt volumetric ratio of longitudinal column reinforcement
<3> capacity reduction factor (NZS)
1P2 idealized ultimate curvature (pyi idealized yielding curvature
Chapter 1
Introduction
In the last decades, the evolution in technology has allowed the development and the appli-cability of fibers as a concrete mix component. This composite material is known as Fiber Reinforced Concrete (FRC), which is basically concrete with large amount of discrete fibers randomly distributed.
The presence of fibers in the concrete matrix offers several advantages like the reduction of shrinkage (cracking control), the enhancement in toughness and tensile strength, as well as the improvement of strain characteristics while cracking is occurring. Furthermore, it is well known that concrete is a brittle material and the steel inside the concrete has the role of resisting the tensile stresses. In the long term, the structure suffers deterioration caused by corrosion of the reinforcing steel, and reparation becomes an essential matter. However, the FRC has been found to be a more impermeable material, so corrosion phenomenon could be minimized resulting in a reduction of the maintenance which is beneficial for the infrastructure owners.
Basically, the application fields of FRC concern non-structural elements and non-principal structural elements like ground slabs, tunnels, pools and the stabilization of ground slops. However, the advantages of FRC keep the researchers' attention for the possibility of using this new material in the structural field.
There are a variety of fiber materials developed for the FRC like steel, glass, natural and synthetic fibers. Studies done to evaluate the structural application of FRC, have been
more interested in steel and synthetic fibers. Besides, the ACI Committee 544 published design considerations for steel fiber reinforced concrete (SFRC) [3], and they expresse their confidence that once the engineers will be aware and familiar with the benefits and design procedures of the SFRC, a variety of applications will be developed.
On the other hand, for SNFRC, there are few research studies reported and some positive field experiences. As it will be shown in the following sections, they have shown several advantages even over the SFRC. For example, the ability of synthetic fibers to melt during a fire allows the steam pressure inside the concrete to dissipate through the pathways left by the melted fibers, and this in turn helps to reduce severe spalling (Han et al. [23]). This is not observed when using SFRC. Also SNFRC elements placed in aggressive environments will have better appearance than those made of SFRC because the surface of elements containing steel fibers will corrode with time. This will not occur when using synthetic fibers (Chernov et al. [11]). Therefore, there is an interest to continue investigating the structural applications of this material. Such studies will enable the development of analytical models and appropriate design procedures.
1.1 Parameters who influence the FRC behavior
As mentioned in the ACI 544.4R [3], the FRC may be best view as a concrete with increased strain capacity, impact resistance, energy absorption, and tensile strength. However, the increase in these properties will vary from substantial to nil depending on the quantity and the type of fibers used. Moreover, this increase is not proportional to the quantity used. As the performance of the FRC will vary depending on the fiber material, fiber geometry, fiber concentration, etc., then many mechanical behavior theories could be obtained. Therefore, the parameters described below are helpful to explain the influence of these variables without describing the mechanical behavior itself. The most common fiber parameters are: the fiber efficiency or fiber count, and the fiber specific surface. To understand the concept of these parameters, some useful terminology must be explained: the equivalent diameter, the fiber aspect ratio, and the pre- and post-mix denier. The equivalent diameter of a fiber is the diameter of the circle having the same area as that of the average cross-sectional area of an actual fiber. Relatively small equivalent diameter fibers have correspondingly low flexural
stiffness and thus they have a certain ability to conform to the shape of the space they occupy in the concrete mixture [47]. The opposite will have influence on the consolidation of aggregates during the mixing and casting process.
The fiber aspect ratio measures the slenderness of individual fibers. It is computed as fiber length divided by the equivalent fiber diameter for an individual fiber. Fibers for FRC can have aspect ratio varying from 40 to 1000 but typically less than 100 [47]. This parameter will also affect the mixing and the casting process.
The denier is defined as the weight of 9000 meters of fiber. It is computed using a single filament. This parameter measures the fineness and it is often related to equivalent diameter if the specific gravity is known [3, 47]. This will allow to compare fibers of different materials. For example [2], synthetic fibers of polypropylene with a specific gravity of 0.91 and which are comparable in size to steel fibers, approximately 0.025 mm in diameter, are 360 denier. The denier of the comparable steel fiber would be 3100. This means that a FRC element made of this steel fiber type will be heavier than any other made using the equivalent in size synthetic fibers. The terms pre- and post-mix denier is used for the fact that fibers may change from the time they were added to the mix to the time they were mixed and dispersed into the concrete matrix.
Fiber efficiency or Fiber count (FC), which is the number of fibers within an unit volume of concrete, is controlled by the resistance of the fibers to pullout, which in turn depends on the bond strength at the fiber-matrix interface [2]. Pullout resistance is proportional to interfacial surface area. For example, smaller diameter round fiber offers more pullout resistance than larger diameter round fiber because it has more surface area per unit volume. Therefore, it seems that for a given length, higher aspect ratio is associated with high fiber efficiency. However, it has been shown that an aspect ratio greater than 100 is not practical because, as it was mentioned above, it affects the mixing process and placing. There are other ways to increase the pullout resistance without increasing the aspect ratio, i.e., deformed surface or end anchorage, but failure will be usually governed by pullout even if some fibers are fractured. The pullout failure mode has an advantage because it is gradual and ductile. According to the ACI 544.1 [2], fiber specific surface (FSS) is the predominant factor deter-mining crack spacing and crack width. The FSS is the surface area of fiber in a unit volume of FRC. The FSS is a function of the fiber count and a single fiber surface area, being directly
related. Hence, the greater the fiber specific surface, the closer the crack spacing and the narrower the crack width.
1.2 Previous studies
In the following sections, a summary of the principal conclusions and observations from various studies will be presented, concerning the utilisation of fibers with high-strength concrete (HSC) and normal-strength concrete (NSC).
1.2.1 High-strength concrete
The cover spalling, ductility and strength gains are the most studied variables in fiber-reinforced HSC. In previous studies, it was observed that the sudden spalling of the cover influences the maximal axial load carried by the reinforced concrete column. According to Collins et al. [15], this rupture could be generated by the tension strengths caused by deformation differences between the core and the cover. These deformation differences are due to the fact that the exterior concrete layers dry faster than the core which is waterproof (Figure 1.1a). Moreover, axial cracks are originated by the longitudinal bars which limit the cover shrinkage (Figure 1.1b). Hence, earlier cover spalling can be cause by the combination of these two phenomenons.
Tension in the cover —-x <J=3 » = £ . waterproof core shrinkable cover <=
I
cracks around the bars N \ X-(V
^y. ^V
+
~6~
<V
^y.
-<V -<V
(a) Shrink in concrete cover <b> b a r s P^sence
restricting the shrink
(c) cracks propagation and cover spalling
Other factor causing this phenomenon can be related to the instability generated by the presence of a weak plan between the confined concrete and the cover due to the dense steel cage [16] (Figure 1.2). This brittleness characteristic of HSC is clearly observed in the postpeak behavior of the specimens made of such concrete, having as a consequence a low deformation capacity with a brutal rupture of the element. Further information can be found in Legeron and Paultre [28], Mongeau [31], Saatcioglu and Razvi [40], Sheikh and Khoury [41], and Thomsen and Wallace [43] among others.
w i n
buckling length of concrete cover plan of - weakness caused by the dense steel cage- cover buckling
TTTTT
Figure 1.2: Early rupture mechanism caused by cover buckling
Langlois [26] studied the role of the cover on the HSC columns' performance subjected to axial load and the influence of the addition of steel fibers on the stress-strain behavior of the columns. In this research, the columns without fibers experienced the same problems described previously. However, it was found that the presence of fibers helps avoid the problems of instability, even if the volumetric ratio of fibers was as low as 0.25%. Also, the spalling of the concrete cover occurs gradually due to the presence of the fibers which prevented the propagation of cracks. As a result, a better behavior of the fibrous specimens was observed.
Moreover, Levesque [30] studied the ductility in HSC columns with steel fibers subjected not only to axial load but also to cyclic flexural load. This study has shown that fibers not only improve the ductility of HSC columns but also prevent the premature spalling of the concrete
cover which failed by crushing instead of by buckling due to the instability (phenomenon described at the beginning of this section).
Djumbong [18] analyzed the influence of synthetic fibers and the role of the cover in HSC columns' behavior under axial loading. As the others, he found that synthetic fibers help to avoid the premature rupture of the concrete cover. Consequently, a gain in ductility and resistance were observed when the behavior of the synthetic fiber-reinforced concrete columns were compared to the non-fibrous specimens behavior.
1.2.2 N o r m a l - s t r e n g t h concrete
In the literature, most of the studies concerning NSC with fibers have been performed on small-scale specimens. The subjects investigated are the bonding capacity of the corroded steel bars surrounded by FRC (Haddad and Ashteyate [22]), the effect of high temperatures on the cover spalling in specimens with lateral confinement (metal, glass and carbon fabrics) (Han et al. [23]), and the compression behavior of lightweight FRC confined with transverse steel reinforcement (Campione and La Mendola [10]), among others.
The use of fiber-reinforced NSC with traditional steel reinforcement can be of great interest for the seismic design. After a literature survey, it was found that this subject has not been extensively studied. Lee [27] studied the shear strength and behavior of steel fiber reinforced concrete columns under seismic loading. The tests were made on 8 square specimens of 300x300 mm and 1 m height. The theoretical compressive strength was 24 MPa. Results indicate that steel fibers are more effective improving the strength and ductility than the stiffness and energy capacity of columns. Furthermore, the addition of steel fibers (volumetric ratio of 1.5%) can change the failure mode from a brittle to a ductile flexural one.
In seismic regions like the west and part east of Canada, ductility and energy dissipation are the most important structural properties. Therefore, as it is evident, there is a need of studying the application of fibers in NSC, not only for the benefits that are until now observed but also to open the possibility of allowing the reduction in the required transversal steel for seismic design.
1.3 Research significance
The improvement of the seismic performance of the structural elements is an important issue in order to accept the SNFRC as a structural material. Concrete design codes ensure ductile behavior of columns by setting a requirement for a minimum amount of transverse steel reinforcement. Studies have shown however, that the use of fiber-reinforced concrete (FRC) can enhance the postpeak behavior and hence, the ductility and the energy absorption ability of concrete columns subjected to axial loading. The higher resistance to crack growth and the excellent durability of FRC over non-fibrous concrete can result in higher cost-effective value. As current prescriptions of the design codes do not consider columns seismic design concerning FRC, then experimental data is required to develop these prescriptions taking into account the advantages offered by this material. This research program contributes to the knowledge in this field by providing experimental data of six large-scale circular columns (three of them made of SNFRC) subjected to a combined constant axial load and reversed cyclic flexure simulating earthquake loading.
1.4 Objectives and Methodology
The main objective of this research program was to study the seismic behavior of SNFRC circular columns under constant axial load while relating the amount of transversal rein-forcement. To achieve this study, the following specific objectives were established:
• Analyse the influence of synthetic fibers in the concrete matrix with respect to the spacing of the transverse reinforcement;
• Study the general response of the columns, taking particularly attention to the gain in ductility, energy dissipation, and damaged related to the spalling of the cover;
• Verify the validity of the spiral spacing limits required by the Canadian standard A23.3-04 for the structural design of concrete columns when using SNFRC.
• Design of an experimental program that allows relating adequately the amount of transversal reinforcement with the volumetric ratio of synthetic fibers. This experi-mental program is described in the next section;
• Execution of cyclic flexural test under constant axial load on each specimen. The main data acquired from these tests were: lateral force applied by the actuators, tip displacement, strain gages and LVDT's lectures;
• Data processing consisting mainly in: the elaboration of load-displacement relation-ships and moment-curvature relationrelation-ships, the calculus of the envelopes and bilin-ear curves for these relationships, the calculus of ductility and energetic indexes, and the normalization of the moment-curvature relationships to allow comparison between specimens of different strength;
• Comparisons of all parameters estimated in the previous stage between specimens with same transversal steel spacing but having different volumetric ratio of synthetic fibers. Also, comparisons between specimens with different transversal steel spacing and dif-ferent volumetric ratio of fibers were carried-out. These analyses allowed studying the influence of fibers and the transversal steel spacing on the behavior of the columns in relation to the ductility, energy absorption, and resistance gains;
• Study of the influence of fibers on the failure mode of the cover and damage levels of the specimens, made from the tests observations and the final aspect of the specimens.
Chapter 2
Experimental Program
Cyclic lateral loading tests under constant axial load were made on six (6) concrete circular columns in the structural laboratory at the University of Sherbrooke. This chapter presents the test variables, description of the specimens, materials properties, instrumentation and the testing procedure.
2.1 Test variables
As mentioned earlier in section 1.4, the main objective of this research is to study how the fiber content into the concrete matrix could influence the column behavior. Another objective is to determine whether the fiber content would allow to increase the spacing of the transverse reinforcement. Therefore, two main parameters will be studied: the volumetric percentage of fibers in the concrete mixture pj, and the spacing of transverse reinforcement s.
2.1.1 Fiber volumetric ratio
Djumbong [18] and Nguyen [32] found that using a pf of more than 1% of synthetic fibers, the concrete mixture loses workability and presents segregation. Also, according to their experiences in the fabrication of FRC with volumetric percentage higher than 1%, the mixing process is difficult. Therefore, values of 0% and 1% were taken for pf.
2.1.2 Spacing for transversal reinforcement
To determine the values of s for this experimental program, the seismic design of the speci-mens was made in accordance to the requirements of three well known design codes. Those codes were: the standard A23.3-04 of the Canadian Standard Association (CSA), the New Zealand Code NZS 3101:1995, and the American Code ACI 318M-05.
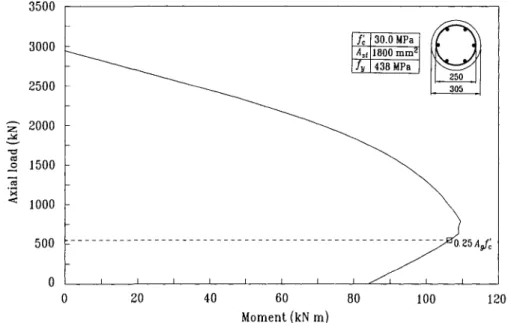
The NZS 3101:1995 and the A23.3-04 take into account the axial load applied to the column for calculating the transverse reinforcement. Hence, for all specimens, 25% of the column gross axial load capacity {Agf'c) was assumed. At this level of loading, as shown in Figure 2.1,
the column is close to the balanced point but always inside the flexural rupture zone, i.e. when the stress in the steel goes over its yielding limit before the concrete rupture.
3500 3000 2500 S" 2000 -a 2 1500 "* 1000 500 0 0 20 40 60 80 100 120 Moment (kN m)
Figure 2.1: Interaction diagram for a circular section calculated with WMNPhi In the following sections, a summary of the requirements for each design code will be pre-sented, accounting not only for the seismic provisions of the three codes, but also the non seismic minimum provisions in the case of the CSA standard A23.3-04.
2.1.2.1 CSA A23.3-04
The CSA A23.3-04 standard requires that compression members using spirals have to comply with Clause 7.6.4, which is the minimum requirement for transverse reinforcement in this kind of members. Thus,
• The transverse reinforcement shall comply with Clause 10.9.4; • The minimum bar diameter for the spiral has to be 6 mm;
• The pitch or distance center-to-center of the spiral shall not exceed 1/6 of the core diameter;
• The clear distance of the pitch shall not be smaller than 25 mm, but not greater than 75 mm.
According to Clause 10.9.4, it demands that the minimum volumetric ratio of spiral rein-forcement ps (out-to-out of spirals) shall be:
>-°-«(£-
1
)f (2.1,
where Ag is the gross area of the section, Ac is the area enclosed by outside perimeter of
concrete gross section, f'c is the specified compressive strength of concrete and fy is the
specified yield strength of the spiral reinforcement (not to be taken more than 500 MPa). The equation (2.1) intents to provide sufficient confinement for the concrete core after the cover spalling, so the loss in capacity is compensated by the gain of the concrete core resis-tance.
On the other hand, the seismic provisions of the CSA A23.3-04 standard for members sub-jected to flexure and significant axial load (i.e. when Pj exceeds 0.10^/^) are divided in two parts. The first part is for ductile moment-resisting frame columns (with ductility-related force modification factor Rd = 4.0), and the second part is for moderate ductile
less than the value obtained from equation (2.2) with fyh not greater than 500 MPa (Clause
21.4.4.2(a)).
ps = 0Akp^ (2.2)
Jyh
where kp — Pf/P0, Pf is the factored axial load, P0 is the nominal axial resistance at zero
eccentricity and fyh is the specified yield strength of transverse reinforcement.
Furthermore, to provide a minimum degree of confinement and lateral support for the lon-gitudinal bars preventing them for buckling, Clause 21.4.4.3 demands that the spacing shall not exceed the smaller of:
• One-quarter (1/4) of the minimum section dimension diameter. For circular section, it is one-quarter of the section diameter;
• Six times the diameter of the smallest longitudinal bar;
SJX1 r, as follows:
Sx = 100 + [^-^) (2.3)
For columns with Rd = 2.5 or 2.0, according to Clause 21.7.2.2.5(a), ps shall not be less than
the following:
Ps = Q.3kp^- (2.4)
Jyh
Moreover, in accordance to Clause 21.7.2.2.3, for columns part of moderately ductile moment-resisting frame, the spacing of transverse reinforcement shall not exceed the smaller of:
• Eight times the diameter of the smallest longitudinal bar; • Twenty four times the tie diameter;
• One-half the minimum column dimension. For circular columns, the minimum column dimension corresponds to the column diameter.
2.1.2.2 New Zealand S t a n d a r d 3101:1995
The provisions of the New Zealand Standard NZS 3101:1995 are also divided in two parts: those members who need additional design requirement for earthquake effects (equivalent to a Rd = 5.0 of the CSA A23.3-04), and those members whose design are not governed by seismic actions (equivalent to a Rd = 2.5 of the CSA A23.3-04).
For columns who need additional design requirement for earthquake effects, the NZS 3101:1995 requires that, according to Clause 7.5.4, the volumetric ratio and spacing limits of spirals shall conform to Clause 8.5.4.3 (a), (c) and (d). Thus, the Clause 8.5.4.3 specifies the fol-lowing:
•
•
(2.6)
Clause 8.5.4.3(a)(i), which is for columns using spiral as a transverse reinforcement, ps
inside the potential plastic hinge region shall be the greatest of:
with ^ > 1.2; ptm < 0.4. Or,
Ast f'c 1
Ps
nod" f
ytd
bwhere pt is the ratio of longitudinal column reinforcement, m = fy/(0.85f^), fyt is
the yield strength of the spiral, N* is the design axial load at ultimate limit state, $ is the strength reduction factor, <f' is the diameter of concrete core of circular column measured to outside of the spiral, and <4 is the bar diameter of the spiral. In equations (2.5) and (2.6), fyt shall not be taken greater than 800 MPa.
Also, according to Clause 8.5.4.3(ii), the center-to-center spacing of the spiral s shall not exceed:
{
one-quarter of the section diameter6 times the diameter of the longitudinal bar
Clause 8.5.4.3(c) requires seventy percent of the equation (2.5) but not less than that given by the equation (2.6) if the columns are designed to prevent formation of plastic hinges.
• Clause 8.5.4.3(d) limits the spacing outside potential plastic hinge zone to the smaller of one-third of the section diameter and 10 times the longitudinal bar diameter. Also, the quantity of transverse reinforcement shall not be less than 70% of that required for the plastic hinge region.
For columns whose design is not governed by seismic actions, the NZS 3101:1995 speci-fies that, according to Clause 7.4.1, the volumetric ratio and spacing limits of spirals shall conform to Clause 8.4.7.1. Thus, the Clause 8.4.7.1 demands to comply with the following:
• Clause 8.4.7.1(a), which is for columns using spiral as a transverse reinforcement, ps
shall be the greatest of:
where ^ > 1.2; ptm < 0.4. Or,
Ast fc 1
Ps 155d" fvt db
In equations (2.7) and (2.8), fyt shall not be taken greater than 800 MPa.
Clause 8.4.7.1(b) limits the spacing of the spiral s to the following:
(2.8)
s < < one-third of the section diameter
10 times the diameter of the longitudinal bar Clear spacing shall not be less than 25 mm.
2.1.2.3 ACI Code 318M-05
Only seismic provisions for members taking part of a structure with a high seismic perfor-mance or located in a region with high seismic risk will be presented. Thus, the requirements are the followings:
• Clause 21.4.4.1 specifies t h a t ps shall not be less t h a n the value given by f I— fyt ps = 0 . 1 2 - ^ (2.9)
A
, \
f'
c And it shall not be less than:"-"•"Uu-MS
(210)
where Ach is the cross sectional area measured out-to-out of the spiral.
• Clause 21.4.4.2 limits the spacing to the smaller of
one-quarter of the section diameter
s < ^ 6 times the diameter of the longitudinal bar
S0, with 100 m m < 5o< 1 5 0 mm
where S0 is expressed as the equation (2.3).
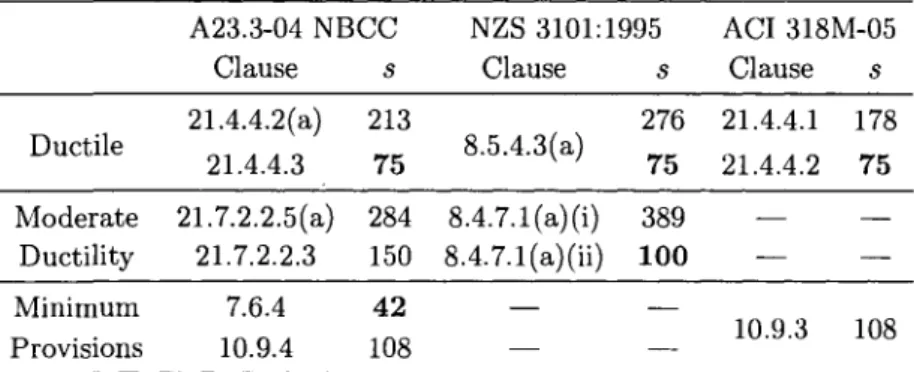
Looking the results obtained from the three codes, it is establish t h a t for ductile members with the specimens dimensions concerning this research, neither the equation (2.2), nor the equations (2.5), (2.6) and (2.9) govern the seismic design (see Table 2.1). It seems t h a t provisions are more concern about buckling of longitudinal reinforcement when column sections are small.
Table 2 . 1 : Spacing of transverse reinforcement en mm
Ductile Moderate Ductility Minimum Provisions A23.3-04 NBCC Clause s 21.4.4.2(a) 21.4.4.3 21.7.2.2.5(a) 21.7.2.2.3 7.6.4 10.9.4 213 75 284 150 42 108 NZS 3101:1995 Clause s 8.5.4.3(a) 8.4.7.1 (a) (i) 8.4.7.1(a)(ii) — 276 75 389 100 — ACI 318M-05 Clause s 21.4.4.1 178 21.4.4.2 75 — — 10.9.3 108 All spacings selected give the amount of transversal reinforcement to comply with the minimum required by Clause 10.9.1 of A23.3-04
standard, which is 0.01 times Ag.
Finally, it was decided to take de minimum spacing for each design level. In Table 2.1, the selected spacings are emphasized, so they are 42 mm, 75 m m and 100 mm.
2.2 Test specimens
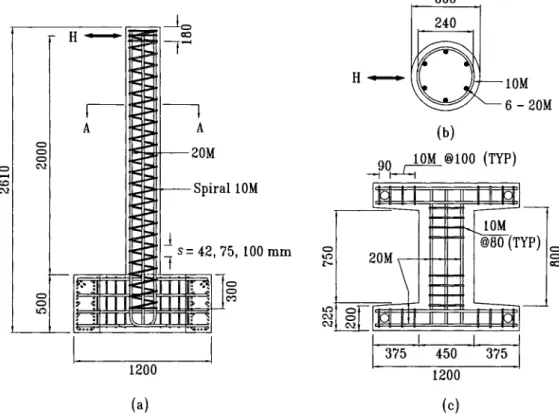
Columns have a circular section of 305 mm diameter. The total height is 2610 mm including the "I" shape rigid stub, which has 500 mm height (Figure 2.2). The column head with 180 mm height was built as a square section to facilitate the installation of the horizontal hydraulic actuator (Figure 2.3). The application point of the force is located at 2000 mm from the top of the stub. The specimens are in real scale, so they represent a first floor columns of 4000 m m height, with the contraflexure point at mid-height.
* II If * 5 | s i . . y
n
n
n
~r
CO 10M 6-20M A -20M -Spiral 10M 90 (b) 10M_@100 (TYP) s= 42, 75, 100 mmH
U
ffi
17 "i! 1200 (a) 20 0:«t=
'flltfE3E
- U
dya
^ 10M §80(TYP)mn
i i 375 450 375 1200 (c)Figure 2.2: Dimensions and reinforcing steel of the specimens: (a) front view of columns ; (b) section A-A; (c) plan view of the stub
All columns are reinforced with six longitudinal bars 20M (1800 mm2) placed symmetrically.
The total number of bars complies with Clause 10.9.3 (A23.3-04). The transverse steel
reinforcement was given by spirals 10M (100 mm2), having a pitch center-to-center of 42 mm,
Figure 2.3: Aspect of reinforcing cage
To identify the columns, we proposed the following nomenclature, which is composed by three terms. T h e first term, C _ , indicates the compression strength of concrete at 28 days in MPa. T h e second term, S _ , indicates the pitch of the spiral in mm, and the third one, F P _ , indicates the volumetric percentage of synthetic fibers. For example, C30S75FP1
signifies t h a t it is a column with f'c equals t o 30 MPa, having a spiral with a pitch of 75 mm
and a volumetric content of synthetic fibers of 1%.
Table 2.2: Real dimensions and amount of reinforcing steel
Column C30S100FP0 C30S100FP1 C30S75FP0 C30S75FP1 C30S42FP0 C30S42FP1 (mm) 304 302 303 304 302 304 (mm) 250 252 253 253 240 248 (mm2) 72583 71631 72107 72583 71631 72583 ( m m2) 49087 49876 50273 50273 45239 48305 ( m m2) 1800 1800 1800 1800 1800 1800 % 2.48 2.51 2.50 2.48 2.51 2.48 % 1.53 1.52 2.01 2.01 3.78 3.67
Table 2.2 reports the real dimensions and the amounts of longitudinal and transverse steel reinforcement used not only in the calculation of applied axial load (see Table 2.15), but also with the aim of predicting and comparing the results.
2.3 Materials properties
2.3.1 Concrete
For all specimens, the compression strength at 28 days for the concrete with and without fibers was establish at 30 MPa.
Concrete was provided by DEMIX, and all columns were casted vertically directly at the structural laboratory (Figure 2.4). The decision of using premix concrete was based on the facility to cast the column directly in place, avoiding the difficulties of transporting those large specimens from the warehouse to the University. Moreover, DEMIX is also familiar with fabrication of fiber concrete.
Before proceeding with the casting of each column, three properties of fresh concrete were measured: slump, density, and air content. The slump test, performed according to CSA Test Method A23.2-5C (ASTM 143), is the most generally accepted method used to measure the consistency of concrete [25]. It gives a reasonable indication of how easily a mixture can be placed. For this research, slump values between 90 and 140 mm were acceptable, especially high values for those columns with small spiral pitch.
Concrete density was measured in accordance with CSA A23.2-6C (ASTM C 138), and the standard test for air content using the pressure method was used, according to CSA A23.2-4C (ASTM C 231). Values of all properties for fresh concrete are reported in the following sections. Mechanical internal vibration was used to facilitate casting of concrete into the formwork.
2.3.1.1 Normal concrete
Normal concrete mixture was designed by DEMIX (see Table 2.3). The volume of concrete order for each casting was 1 m3.
Table 2.3: Mixture composition for normal concrete at f'c = 30 MPa (kg/m3)
w/c
Water
Cement (type GUb-S) Aggregate 10 mm 0.50 169 335 332 Aggregate 20 mm Sand DJL Micro-Air* EUCON MRC** 628 857 218 ml 1173 ml
* Air-entraining admixture from BASF (dosage: 65 ml/100 kg of cement) ** Water reducer admixture from EUCLID (dosage: 350 ml/100 kg of cement)
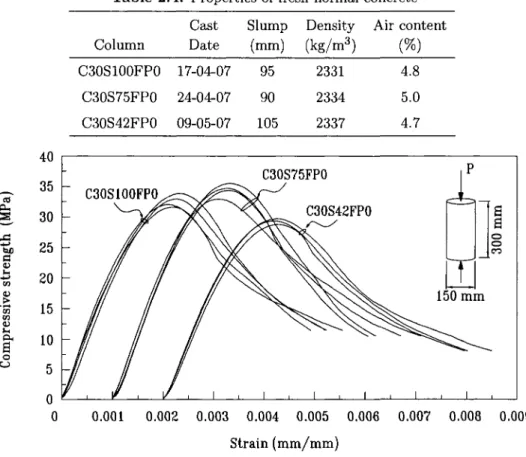
Fresh concrete properties, measured as explained in section 2.3.1, are shown in Table 2.4. To determine the mechanical properties of the hardened concrete in each batch, eight cylin-ders 150x300 mm were made for compression test according to CSA A23.2-9C (ASTM C39). Three cylinders of 100x200 mm were also built for direct tension if needed, and which the student did not perform. Six beams 100x100x400 mm were casted for each column, to de-termine the concrete modulus of rupture (flexural strength) according to the CSA A23.2-8C (ASTM C78).
Table 2.4: Properties of fresh normal concrete Column C30S100FP0 C30S75FP0 C30S42FP0 Cast Date 17-04-07 24-04-07 09-05-07 Slump (mm) 95 90 105 Density (kg/m3) 2331 2334 2337 Air content (%) 4.8 5.0 4.7 0 0.001 0.002 0.003 0.004 0.005 0.006 0.007 0.008 0.009 Strain (mm/mm)
F i g u r e 2.5: Stress-strain relationship for normal concrete at 28 days
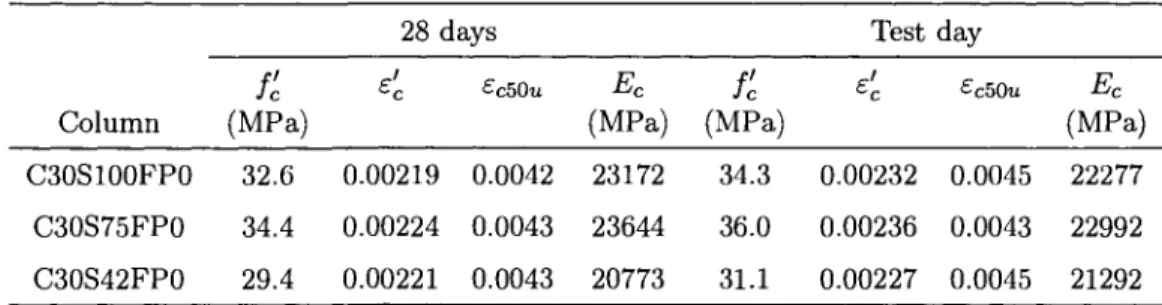
Stress-strain relationships from compression test at 28 days are shown in Figure 2.5. Also, actual stress-strain relationships were obtained at the same day of the test in order to deter-mine the mechanical properties of the specimen. The mechanical properties are reported for
each specimen in Table 2.5, where e'c is the axial strain in plain concrete corresponding to f'c,
£C50u is the strain corresponding to 0.50/^ after the peak, and Ec is de modulus of elasticity
of the concrete. T h e results of modulus of rupture, fr, from the flexural strength test are
Table 2.5: Mechanical properties of normal concrete Column C30S100FP0 C30S75FP0 C30S42FP0 fc (MPa) 32.6 34.4 29.4 28 days e'c 0.00219 0.00224 0.00221 £c50« 0.0042 0.0043 0.0043 Ec (MPa) 23172 23644 20773 fc (MPa) 34.3 36.0 31.1 Test
4
0.00232 0.00236 0.00227 day £c50« 0.0045 0.0043 0.0045 Ec (MPa) 22277 22992 21292Table 2.6: Modulus of rupture for normal concrete
Column C30S100FP0 C30S75FP0 C30S42FP0 28 days / r (MPa) 4.34 3.90 3.99 Test day fr Age (MPa) (Days) 5.60 85 5.38 128 4.64 119 2.3.1.2 Fiber-reinforced concrete
The concrete supplier company DEMIX is familiar with fiber mixtures, especially with the synthetic fiber used in this research.
However, this company is used to handle a maximum of 0.5% and not 1% for the volumet-ric ratio of the fibers for p/. Thus, the mixture optimized by Nguyen [32] for pj = 1% was adapted for premix fabrication (see Table 2.7), and the procedure described below was followed:
• At DEMIX, the recipe of this mixture is registered as S3251310, so it is easier for future projects to order the concrete with the same material proportion used for this research. The volume of concrete order for each casting was 1.5 m3;
• Standing close to the conveyor belt, all exact quantities of air-entraining and super-plasticizer must be prepared. Also, fiber bags must be opened (Figure 2.6a);
added. When the gross aggregate appears, the air-entraining (Figure 2.6b) and the superplasticizer (Figure 2.6c) shall be added on the granulate one after the other (even if addition of sand started);
• Immediately after the previous step, all fibers bags have to be added (Figure 2.6d); • The mixer rotates for about 5 minutes. After that, the speed of the mixer has to be
reduced to avoid extra air inclusion in the mixture. Properties of fresh concrete are measured in place, and later at the University's laboratory before casting the specimens.
(a) (b)
(c) (d)
Figure 2.6: Fiber-reinforced concrete mixing procedure at DEMIX
The recipe used for column C30S100FP1 (first column casted) was the same reported in Table 2.7, but with a relation W/C=0.50. Also, for this column, the slump had to be adjusted adding 1000 ml of superplasticizer directly to the mixer before bringing the concrete to the
Table 2.7: Mixture composition for synthetic fiber-reinforced concrete at fc = 30 MPa (kg/in3
w/c
Water
Cement (type GUb-S) Aggregate 14 mm 0.45-0.50 191-218 436 784 Sand DJL AIREXTRA* Plastol 5000 SCC** TUF-STRAND SF 1005 374 ml U26-2139 ml 9.2 * Air-entraining agent from EUCLID (dosage: 86 ml/100 kg of cement)
** Superplasticizer agent from EUCLID (dosage: 334 ml/100 kg of cement) Note: For column C30S100FP1, the proportions are written in italic characters
University's laboratory. As a result, the concrete strength was lower t h a n expected. This is the reason why it was decided to reduce W / C relation to 0.45 for the rest of the specimens. Properties measured at the University before casting the fiber-reinforced concrete specimens are shown in Table 2.8.
Table 2.8: Properties of fresh fiber-reinforced concrete
Table 2.9: Column C30S100FP1 C30S75FP1 C30S42FP1 Column C30S100FP1 C30S75FP1 C30S42FP1 Cast ; Date 16-05-07 29-05-07 31-05-07 Slump (mm) 130 90 100 Density (kg/m3) 2275 2217 2211 Air content (%) 6.4 8.5 8.2
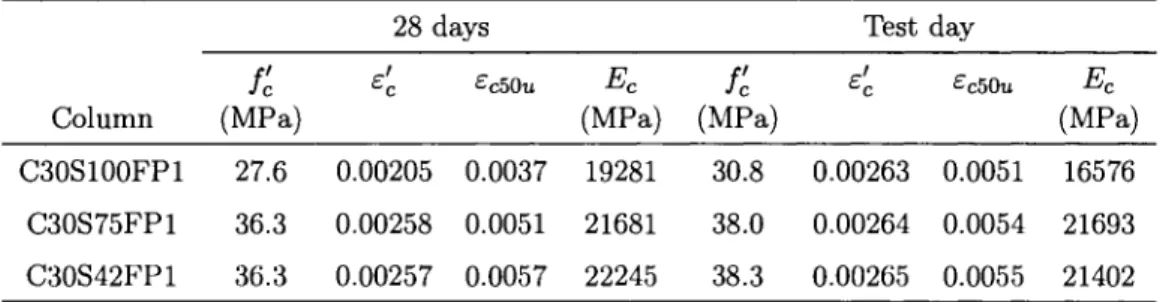
Properties of fiber-reinforced concrete measured from compression test
fc (MPa) 27.6 36.3 36.3 £ 28 days c £c50u 0.00205 0.0037 0.00258 0.0051 0.00257 0.0057 Ec (MPa) 19281 21681 22245 / c (MPa) 30.8 38.0 38.3 Test
4
0.00263 0.00264 0.00265 day £c50« 0.0051 0.0054 0.0055 Ec (MPa) 16576 21693 21402Furthermore, mechanical properties were measured for each specimen using similar procedure as shown in section 2.3.1.1. These properties are presented in Tables 2.9 and 2.10. Also, stress-strain relationships for fiber-reinforced concrete at 28 days are shown in Figure 2.7.
(0 CL, ss ^—" J 3 *n C 0) st r CD > CO CO a> t n
s
o o 40 35:w
25 20 15 10 5 0 0Figure 2.7: Stress-strain relationship for fiber-reinforced concrete at 28 days Table 2.10: Modulus of rupture for fiber-reinforced concrete
Column C30S100FP1 C30S75FP1 C30S42FP1 28 days fr (MPa) 3.46 4.86 4.86 Test day fr Age (MPa) (Days) 4.58 120 5.24 83 5.42 84 2.3.1.3 C o n c r e t e c u r i n g
Once the column is casted, it is suitable to wait 24 hours to take-off the formwork. After t h a t , we cover the whole column, stub and control cylinders and prisms with a burlap (see Figure 2.8a). Then, we sprinkle water all around until the burlap is wet enough, and we cover it with a plastic sheet to avoid vaporization until the next day (Figure 2.8b). This method of curing is called Wet Coverings.
This procedure was made once every 24 hours during 7 days. Only, columns C30S42FP0 and C30S100FP1 were cured during 28 days due to low compression strength, observed after 7 days of curing.
0.002 0.004 0.006 0.008 0.010 0.012 0.014 Strain (mm/mm)
(a) (b) Figure 2.8: Curing method by wet coverings
2.3.2 Steel reinforcement
Two types of reinforcing bars were used: 20M (300 mm2) and 10M (100 mm2). The 20M bars
were Grade 400R, and the 10M bars used to build the spirals were Grade 400W. Stress-strain curves were obtained from test coupons on each of the steel batches used (Figures 2.9 and 2.10).
Mechanical properties were estimated using the averages of tensile test results performed on three steel coupons. Only for the 10M batches, some properties in the plastic ranges were calculated using two coupons because of the irregularities in this part of the curves.
Those properties presented in Table 2.11 are: yield strength fy, yield strain ey, strain
corre-sponding to the beginning of steel hardening esh, the ultimate strain esu which corresponds
Table 2.11: Reinforcing steel properties Steel bar fy (MPa) £sh (MPa) Es (MPa) 20M (longitudinal) 10M (spiral) s = 75 and 100 mm 10M (spiral) s = 42 mm 438 0.00217 0.00792 702 0.11084 203969 445 0.00225 0.01370 625 0.13775 198532 445 0.00213 0.01303 626 0.13389 209644 750 "rt^ D . S^ j i CI m fcn -4-> CO OJ CO fl <u E-c 600 450 300 150 Bar 20M 200 mm 0.05 0.10 0.15 Strain (mm/mm) 0.20
F i g u r e 2.9: Stress-strain relationship for longitudinal steel
2.3.3 Synthetic Fibers
0.25
The fibers used in this research were developed by professor Jean-Francois Trottier and Michael Mahoney at the University of Dalhousie (Halifax). This synthetic structural fiber is made from polypropylene/polyethylene blend by extrusion procedures. Thus, giving the incompatibility of these two materials, a self-fibrillating fiber is obtained.
Also, because of its initial low surface area and its high aspect ratio, the fibers do not tend to ball so this allows them to be well-dispersed at the initial phase of the mixing
750 n3 a 450 JS 300 c <v 150 Bar10M 200 mm 0.05 0.10 0.15 Strain (mm/mm) 0.20 0.25
Figure 2.10: Stress-strain relationship for transversal steel
process. Furthermore, the three-dimensional twisted shape (Figure 2.11a) not only facilitates its fabrication and storing in bundle before cutting, but also it enhances dispersibility of the fibers (Figure 2.11b) into the concrete matrix.
(a) (b) Figure 2.11: Aspect of synthetic fibers
Once the fibers are well distributed, and after few minutes of agitation, they start to fibril-late and their surface area contacting the concrete matrix increases. Therefore, their bond capability to concrete is improved.
Table 2.12: Physical and mechanical properties of synthetic fibers
Specific gravity 0.92 Tensile strength 600-650 MPa
Modulus of elasticity 5.0 GPa Fiber length 50 mm
Aspect ratio 74
high resistance to concrete's alkaline environment, and good resistance to UV rays, made this type of fibers a good choice. More details about these fibers are given by Trottier and Mahonney [44]. Moreover, information can be complemented by the technical sheet of TUF-STRAND SF distributed by EUCLID [20] and the patent reports No. 6423134 [45] and 6340522 [46].
2.4 Instrumentation
Each specimen was provided with electrical strain gages for measuring the strains of the reinforcing steel, and with linear potentiometers to be able to calculate the curvature of two sections in the potential plastic hinge region. Also, linear variable displacement transducers
(LVDTs) were used to measure cracking opening and slippage of longitudinal bars.
The electrical strain gages used in this research were CEA-06-250UN-120 and C2A-06-250LW-120 made by Vishay Micro-Measurements. Basically, the difference between the two is the gage factors, which are 2.085 and 2.075, respectively. Also, the gages of type C2A-06-250LW-120 are the new generation of strain gages provided with two wires already welded to the gage, to facilitate their installation. Each column has a total of 30 strain gages distributed as follows: 6 strain gages placed on the spiral (distributed as Figure 2.12a), at no more than 300 mm height from the top of the stub (see the exact positions in Figure 2.12c with Table 2.13); two longitudinal bars with 8 strain gages placed on each one, according to the positions 1 to 8 shown in Figure 2.12b; and two longitudinal bars used as a backup with strain gages placed on positions 4,5,6 and 8, also shown in Figure 2.12b.
4 strain gages on each bar
(4-6,8)
3 strain gages on the spira (I, II, III)
I
(a) 3 strain gages on the spiral (IV, V, VI) 8 strain gages on each bar (1-8) - L. +500 - L. +400 - L. +250 - L. +100 - L. +40 -~L -40 - L. -150 - L. -300J)
L.: level in mm (b)F i g u r e 2 . 1 2 : Strain gages positions on longitudinal steel bars and spirals
T a b l e 2 . 1 3 : Exact strain gage positions on t h e spirals \
West side Column I II III East side IV V VI C30S100FP0 C30S100FP1 C30S75FP0 C30S75FP1 C30S42FP0 C30S42FP1 15 115 310 5 98 305 100 165 240 60 135 210 0 135 295 -5 115 280 55 170 270 50 148 240 55 125 205 40 115 185 35 160 290 20 155 280 f measured from the top of the stub in m m
-• I
(b) Section B-B (c) Figure 2.13: Potentiometers and LVDTs positions
Table 2.14: Distance for the metallic rings and steel rodsf
Column C30S100FP0 C30S100FP1 C30S75FP0 C30S75FP1 C30S42FP0 C30S42FP1 LVDT Xi 30 25 20 30 25 22 Potentiometers %2 75 75 48 58 45 45 X3 220 220 208 214 220 220 Xi 430 425 420 430 425 422 X5 150 133 134 136 123 135
| measured from the top of the stub in mm
top of the base to which the metallic rings and the steel rods are placed in each column to support the potentiometers and the LVDTs.
Two sets of four potentiometers were installed along the calculated plastic hinge region, using the equation from Priestly, Seible and Calvi (1996) shown in section 3.7. One set was supported by metallic rings installed at a distance £4 (see Figure 2.13c) which measure the average concrete displacement over a gage length of 400 mm used to calculate the concrete strain, and the other set supported by two steel rods passing through the concrete core
(placed before concreting), as shown in Figures 2.13b and 2.14a, which measured average concrete displacement over a gage length equals to x3 —X2, also used to calculate the concrete
strain at a different section. One set of four LVDTs were supported by a metallic ring placed at x\ to measured, as mentioned before, the crack opening and slippage of the longitudinal bars.
(a) (b) Figure 2.14: Rods placement and general view of the instrumentation
All the measurement devices were connected to the System 5000 acquisition system, which was also connected to the testing software TestStar, that controls the hydraulic actuators.
2.5 Test setup
The experimental setup is presented in Figure 2.15. The column was fixed to the reaction laboratory floor by tie rods.
The horizontal force was applied by a MTS hydraulic actuator (500 kN capacity) which is controlled by the software TestStar. This actuator is fixed to the reaction wall by tie rods and is capable to apply pushing and pulling loading with displacement and force control capabilities. Also, there is a rigid frame fixed to the reaction wall and slab, whose beam helps to guide the column path when the horizontal actuator applies the force to the column. For the axial load, two MTS hydraulic actuators (500 kN load capacity) are used. The advantage of using MTS hydraulic actuators instead of ENERPAC hydraulic actuators used
Figure 2.15: Experimental setup
in the past for applying the axial load is that the first has no need to be adjust while the test is running. The actuators were also controlled by the TestStar software.
2.6 Test p r o c e d u r e
At the beginning of each test, the first step is the application of the axial load. As it was mentioned in section 2.1.2, the axial load is set to be equal to 25% of Agf'c, where the
compression concrete strength, f'c, is taken as the one measured at 28 days. Table 2.15
presents the applied axial load, Pf, the ratio Pf/Agf'c, the concrete compressive strength at
28 days and at the day of the test, f'c2s, and f'ctest, respectively, for each column.
Knowing the axial load targeted value, we proceed to apply it manually and slowly. Once the load level is reached, the test is divided in two phases: lateral cyclic loading under force
Table 2.15: Applied axial load Column C30S100FP0 C30S100FP1 C30S75FP0 C30S75FP1 C30S42FP0 C30S42FP1 f JC2& (MPa) 32.6 27.6 34.4 36.3 29.4 36.3 f (MPa) 34.3 30.8 36.0 38.0 31.0 38.3 Pf (kN) 591.6 494.3 620.1 660.5 526.5 664.2
PflK
(%) 23.8 22.4 23.9 23.9 23.7 23.7control during the first cycle; and lateral cyclic loading under displacement control from the second cycle until the end of the test (Figure 2.16).
In previous researches, the rate of loading was set to 0.375 kN/sec for the load control loading, and 0.15 mm/sec for the displacement control loading. However, it was suitable to change the rate of the latter loading because otherwise, it would take more several hours testing one specimen given the ductility levels already predicted. Thus, according to a normal strain rate for quasistatic conditions of 10~5 s_ 1 [8], a rate of 0.30 mm/s was applied.
At the first stage of the test, the horizontal force is applied under force control to a maximum of 75% of the theoretical yielding horizontal load Hy. The main goal of this cycle is to crack
the section. After completing this cycle, the second cycle starts under displacement control to reach the yielding displacement defined as the point where the longitudinal bars first yielded in tension (this criteria was taken specifically for this column section because it represents the global yielding of the section given by its shape and the steel reinforcement placement). Once the yielding displacement is reached on each side of the column, an average of these values is calculated and is defined as the experimental yielding displacement Ay . Thus,
first phase of the test is ended.
At the second stage, always under displacement control, the second cycle of 1.0 Ay is repeated
using the experimental yielding displacement. Thereafter, each cycle at 1.5, 2, 3,... times
Ayex is repeated twice until failure of the column.
6.0 5.0 4.0 3.0 2.0 1.0 -1.0 -2.0 -3.0 -4.0 -5.0 -6.0 ^Load control ... , , . . ( Displacement control Loading cycle
F i g u r e 2.16: Lateral displacement history
able to sustain axial load, characterized by a 10% loss of the applied axial load; 2) drop of more t h a n 50% of the maximum flexural capacity experienced; 3) rupture of longitudinal (by buckling or tension) or the spiral, inducing a large drop of flexural capacity. Due to safety reasons, in some cases, the test was ended without fulfilling previous criteria, however, with a least one criterion close to be approached.
Chapter 3
Test Results
In this chapter, the general behavior of the specimens and some important test observations as well as the results are presented. Basically, the results are shown as lateral load-tip displacement and moment-curvature relationships. Ductility parameters are calculated from the idealization of these curves as indicated in the following sections. Also, tension strain demands developed in longitudinal and transverse steel reinforcement are presented.
3.1 General behavior and test observations
Generally, the cracks in the cover were slightly smaller in columns with fibers comparing to those without fibers. In the first cycle (0.75 Hy), the cracks width were around 0.20 mm for
NSC columns and 0.15 mm for the SNFRC columns, except for the specimen C30S42FP1 which exhibited cracks width of 0.25 mm. This was probably caused by a no well distribu-tion of the fibers observed in some spots in the cover. In the next cycles, the values range between 0.15-0.5 mm for SNFRC columns, and between 0.20-0.70 mm for NSC columns. The minimum compressive strain at the extreme fiber of the cross-sectional concrete corre-sponding to the first sign of cover crushing was 0.0040 and 0.0043 for the C30S100FP0 and the C30S100FP1, respectively. The average values were 0.0043 for the NSC columns, and 0.0047 for the SNFRC columns. Significant crushing accompanied with visible detachment of the concrete cover occurred between the fourth (first cycle of 1.5Ay) and the sixth cycles